 Xie Jia1
 Liu Yang
- 1School of Earth Sciences and Spatial Information Engineering, Hunan University of Science and Technology, Xiangtan, Hunan, China
- 2Second Team of Hunan Nonferrous Metals Geological Exploration Bureau, Xiangtan, Hunan, China
Goaf ground collapse has great constraints on people’s lives, property safety, and social development within the influence scope because of its concealment and suddenly happening characteristics. The high-density resistivity method is used to explore the goaf of a quarry in Xiangtan City, Hunan Province. The surface subsidence of the goaf is analyzed using the apparent resistivity inversion section diagram and the comprehensive analysis results. The filling water or sediment in the goaf is reflected as a low-resistivity abnormal body, with a resistivity change that is significantly different from the resistivity change of the surrounding bedrock and the contour fluctuation. The morphological characteristics and geological conditions of the underground abnormal body in the goaf are deduced. Based on the geophysical prospecting method, geological disasters such as goaf ground collapse can be explored. From the combined analysis and processing of inversion data, the geological structure and stratum information of goaf can be inferred, which provides a theoretical basis for further disaster prevention.
Introduction
Karst ground collapse is the collapse of bedrock and overlying soils and the formation of collapse pits in the ground in areas where carbonate rocks are found, due to sufficient natural hydrological interaction and human factors (Wang and He, 2006). One of the main causes of geological hazards is the formation of subsurface cavities—underground cavities formed by human-induced destruction of ore layers on the bedrock surface (Shen et al., 2001; Zhang et al., 2015; Gong and Li, 2018). With the development of economic construction, China has become a major source of geological disasters; most of the damages caused by mining and karst collapse in China have become increasingly serious, with over 778 karst collapses and more than 30,000 collapse pits in 23 provinces, mainly in Hunan, Yunnan, Guizhou, Jiangxi, and Sichuan (Xie et al., 2021). Karst collapse is characterized by suddenness in time and concealment in space and is usually accompanied by secondary disasters such as foundation instability and building tilting and fracturing, causing significant economic losses and seriously endangering people’s lives and property. Hence, preventing and reducing the occurrence of karst collapse disasters, and therefore the occurrence of mining collapse disasters, have become a matter of close concern (Luo and Cheng, 2016; Li et al., 2017; Yan et al., 2021). The study area is located on the southwest border of Xiangtan City, which is a typical area with frequent occurrence of karst and ground collapse disasters. The mining area is rich in mineral resources such as mineral water, limestone, and gypsum, and has three basic conditions: soluble carbonate rocks, mainly chert; water with dissolution capacity; and good water circulation (Li et al., 2014; Jia et al., 2021). The ground collapse disaster site is located in the eastern part of the quarry. Due to the large scale and high frequency of mining activities prior to the collapse, there is a certain range of underground quarry area. Ground collapse disaster causes a certain degree of damage to the local ecological environment, and its potential danger has a serious impact on the safety of people’s property and economic development in the area. Therefore, it is crucial to investigate the underground space situation and analyze the potential hazards (Zeng and Zheng, 2007; Lei et al., 2009). At present, geophysical exploration is the main method to detect the geological situation of the underground mining area and karst ground collapse. Seismic exploration is based on seismic wave exploration of the stratigraphic structure, using refraction and reflection wave characteristics to determine the existence of collapse, while the geological radar method uses electromagnetic wave propagation in the stratigraphic medium. If there is an unknown geological body or anomaly, the electromagnetic wave will produce reflection and refraction, and the phase, amplitude, and frequency will change. These methods have the advantages of high efficiency, low cost, use of lighter instruments and tools, and more accurate interpretation of results (Zheng et al., 2017; Huang et al., 2019). Compared with other physical exploration methods such as the traditional resistivity method, the high-density resistivity method is used to identify geological formations and subsurface anomalies by comparing the differences in resistivity between rocks and soils through observation and analysis. The method has the advantages of fast data collection, high efficiency, rich information, and convenient interpretation, all of which can significantly improve the exploration capability (Wang et al., 2011; Jin and Liu, 2014; Li et al., 2019). In this study, the high-density resistivity method is used to conduct a rapid and effective hazard analysis of a mining area in the lower part of a township in Xiangtan City, Hunan Province, to detect and invert the geology of its subsurface space and provide a theoretical basis for further comprehensive disaster prevention and control.
Overview of the goaf
Geology
The mining area is located in a town in Xiangtan City, Hunan Province, which is mainly a hilly mountainous landscape and belongs to the Xianggan hilly area in South China, with concentrated rainfall; small differences in the spatial distribution of light, temperature, and water; more disastrous weather; and obvious continental climatic characteristics. According to the site investigation and regional information, the stratigraphy of the disaster area is divided from top to bottom into the Quaternary Holocene strata, Cretaceous red strata, and Middle Devonian Qiziqiao Group limestone, among which the Cretaceous and Devonian strata are in unconformity and have the basic conditions for karst collapse. The geological structure can be divided into a fault-fold structural zone, a basin structural zone, and a neotectonic movement zone.
Geological hazards
The ground collapse disaster site directly threatens the safety of four surrounding houses and affects the surrounding environment such as ponds and roads. The resulting collapse pit is water-filled and the inside of the pit has an irregular round shape, approximately 35 m in diameter and 20.5 m in depth. The ground collapse disaster is accompanied by secondary hazards such as sliding slopes, depleted water levels in surrounding wells, and fallen trees, and the site remains in an unstable state (Figure 1).
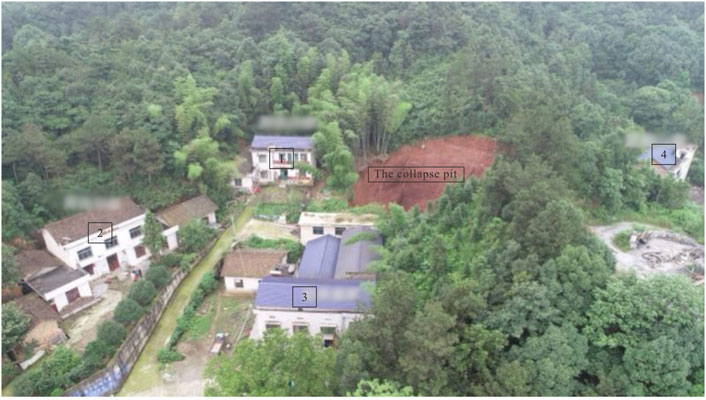
FIGURE 1. Panorama of disaster scope and affected houses.
The collapse occurred with secondary disasters such as house breakage. At present, the foundation and wall at the upper right corner of house No. 3 have collapsed, and the collapse pit has a clear tendency to increase in size. Tensile cracks are found at the entrance of the garage of house No. 3 with the occurrence of the collapse (Figure 2), and the whole house is tilted toward the collapse pit (Figure 3). House No. 1 is only 7.5 m away from the collapse pit and house No. 3 is 15 m away from house No. 1, and there are obvious tension cracks on the right side of the front lawn and new cracks in the house. Houses No. 2 and No. 4 are not obviously affected by the collapse, and no new cracks have been seen in the surrounding ground and houses for the time being. In recent years, small cracks have appeared in the house, but no obvious intensification of the phenomenon has occurred. The recent collapse is in a less stable state, and the loose soil above the slope collapses at times.
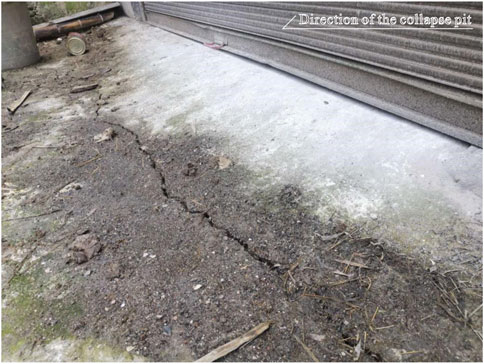
FIGURE 2. Tensile cracks in the garage of house No. 3.
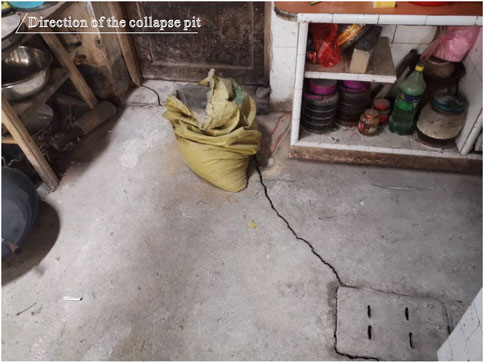
FIGURE 3. Tensile cracks in house No. 3.
Exploration method in the goaf
Principle of the high-density resistivity method
The high-density resistivity method is based on the difference in the electrical conductivity of rocks. The traditional resistivity method can realize mineral resources exploration or be used to resolve other related geological problems by observing and studying the distribution law of the artificially established stable current field in the medium. The high-density resistivity method differs from the traditional resistivity method in that the high-density resistivity method requires a large number of high-density measurement points to be set up during installation and observation. In the field, all the electrodes should be placed at once on the measurement points at certain intervals according to the required arrangement before starting the instrument for observation. After processing and analyzing the reflected apparent resistivity profile, the information on stratigraphic distribution can be obtained, which in turn can be used to delineate strata, circle anomalous areas, and determine the location of hazards (Di QingyunShi et al., 2001; Lv et al., 2005; Ge et al., 2008). The high-density resistivity method uses large-scale integrated circuits in a computer system, and automatic control theory is applied to establish the operation and processing system. Since this operating system can control a large number of electrodes at the same time and can control the connection of different electrodes for free combination, it can save a lot of time, improve the efficiency of observation, collect more information about the underground electric field, and be more intelligent (Figure 4) (Yang et al., 2012; Zhu and Wang, 2012; Han, 2020).
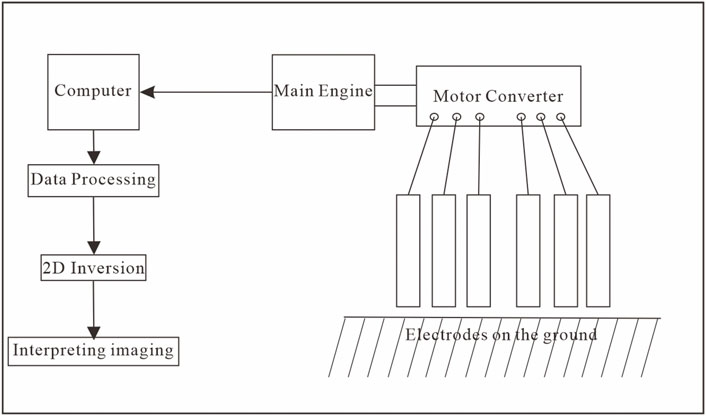
FIGURE 4. Working block diagram of the high-density resistivity method.
At present, the main ways to carry out high-density resistivity measurements include α, β, and γ arrangements; all three arrangements evolved from symmetric quadruple, monopole–monopole, etc. The β and γ arrangements are measured point by point when the electrode distance is the same, then double the electrode distance, and so on; the different points are mainly the difference between A and B positions. The α arrangement is commonly used at present, based on the basic arrangement of symmetric quadruple, setting the control electrode at the same distance from the measuring electrode, AM = MN = NB, to achieve the measurement of the proposed section of the underground space (Figure 5) (Dong and Wang, 2003).
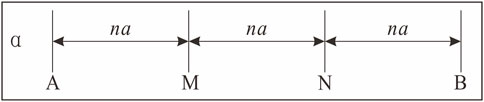
FIGURE 5. α-Array signal diagram of the high-density resistivity method. A, B, supply electrode; M, N, measurement electrode; a, electrode distance; n, measurement factor.
According to the regional geological overview and the list of rock electrical parameters (Table 1), the strata within the working area of the high-density electrical method in the goaf mainly include the Quaternary Holocene till and silty sand with low resistivity, the common value of which is 30 Ω m. The local water content is relatively small, which may present local high-resistance characteristics and uneven bodies of mass; the resistivity values of bedrocks such as silty mudstone, Devonian limestone, and dolomitic limestone vary considerably. The common resistivity value of argillaceous limestone is 400 Ω m, while the resistivity of the limestone is 1500–1800 Ω m, and its resistivity contours fluctuate widely. The resistivity is used as the basis for the collection and evaluation of parameters of the high-density electrical method and is based on the electrical differences between the goaf and the surrounding rocks. When there is an underground extraction area, the air or water filling generally appears as local high resistance or local low resistance, but when there are hidden karst and fissure development caused by tectonics such as faults and folds, the development zone is filled with water or sediment and other filling materials, and the area usually shows medium resistance or low resistance compared to the surrounding rocks, and the anomalies are often characterized by a resistivity of only a few hundred Ω·m.
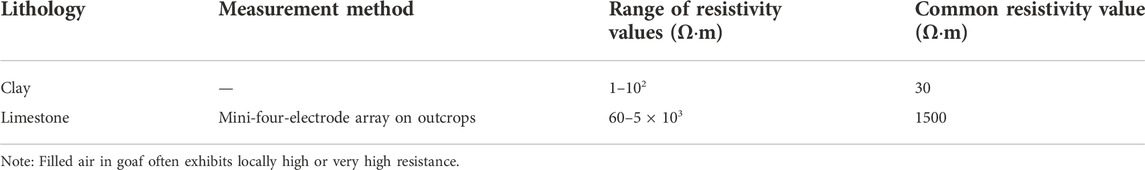
TABLE 1. List of rock electrical parameters.
Field work methods
According to the geological conditions and geophysical characteristics of the area, a total of 10 survey lines were laid in the goaf and its impact area, of which seven were in the north–south direction, named as L1, L2, L3, L4, L5, L6, and L7 from east to west, and three in the east–west direction, named as L8, L9, and L10 from north to south. The length of the measured profiles in the north–south direction was 600 m, and the length of the east–west profiles L9 and L10 was 900 m and that of L8 was 600 m. Survey line L1 was laid on the eastern periphery of house No. 2 in the goaf, with the profile direction near the north–south, to control the peripheral area affected by the collapse; survey line L2 is roughly parallel to the L1 line, laid on the eastern side of the collapse pit and passing through houses No. 1, 2, and 3, to control the investigation of the dangerous house disaster area; survey line L3 is roughly parallel to L1 and L2, laid on the west side of the collapse pit, located on the east side of house No. 4. Survey line L4 is basically parallel to L3 and is located on the west side of house No. 4; survey line L5 is basically parallel to L4 and is located on the west side of the quarry, about 100 m away from L4; survey line L6 is located on the east side of the pond; and survey line L7 is located on the west side of L6, in order to identify the karst collapse channels on the east and west sides of the pond. The east–west survey lines L8, L9, and L10 cross the area: measuring line L8 is placed to the north of the road to detect the karst development area existing in the shallow part of the collapse periphery, and measuring lines L9 and L10 pass through the dangerous house area, quarry, and pond to identify the underground anomaly information in the affected area. The main purpose of the three survey lines is to verify the stratigraphic information of the goaf and karst ground collapse area inferred from the north–south survey lines and to improve the detection accuracy. The 10 survey lines cover the quarrying area and its impact area, and can be used to effectively detect the geological conditions and resistivity anomalies, and therefore infer the ground collapse anomalies caused by quarrying and karst through the inverse map of the physical survey profile, providing a theoretical basis for further verification and disaster prevention and control (Figure 6).
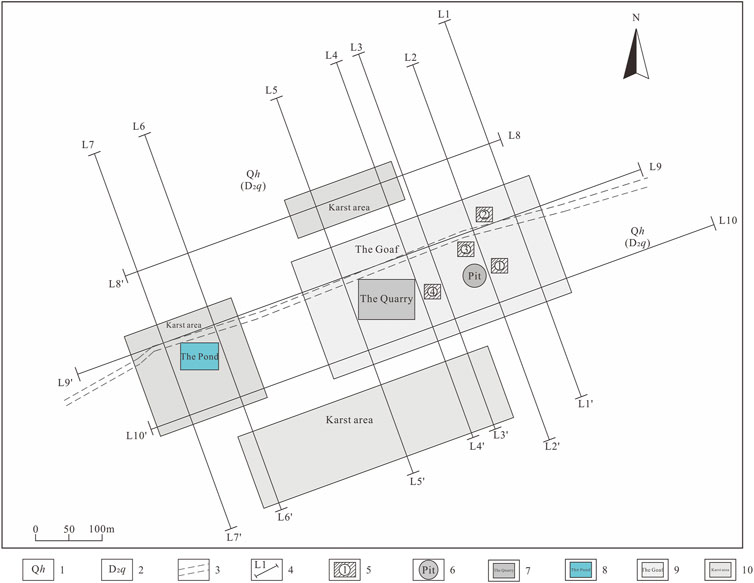
FIGURE 6. Goaf survey line layout and geological survey map. 1, Quaternary Holocene; 2, Middle Devonian; 3, road; 4, line position and number for the high-density resistivity method; 5, house; 6, collapsed pit; 7, quarry; 8, pond; 9, inferred scope of goaf; 10, inferred scope of karst.
The WDJD-3 multi-functional digital DC exciter and WDZJ-3 multiplex electrode converter were selected as the main control machine for this high-density resistivity method exploration. An electrode distance of 5 m was selected for the high-density resistivity method, 60 electrodes were arranged as one arrangement, one section was rolled 58 times, and the number of profiles was 19 layers in total. The location of the measurement points was determined by a hand-held GPS device, supplemented by compass orientation and measuring distance with a leather tape. The electrodes were arranged in an α arrangement (Winner device AMNB). In the survey process, first of all, AM = NB = MN was set as one electrode spacing; A, M, N, and B were moved from one end of the survey line to the other end one point at a time; and the first profile was measured in turn. Second, AM, MN, and NB were increased to two electrode spacing and were moved from one end of the survey line to the other end one point at a time. Subsequently, the electrode distance was measured in an increasing order to finally form an inverted trapezoidal section.
Data processing
High-density electrochemical data processing consists of two parts: the first consists of data pre-processing, pre-editing the apparent resistivity values, eliminating distorted data such as abrupt points or noise from the resistivity profiles, and then stitching multiple measurement sections into a complete and uniform profile. For profiles with significant differences in data and large topographic relief, subsequent inversion processing is required to analyze their characteristics (Gao et al., 2015; Fu et al., 2019). By converting the actual field survey data into a depth–resistivity relationship, the resistivity profile characteristics of the strata are obtained, and the influence of anomalous interference on the interpretation of the electro-magnetic data is eliminated to the maximum extent possible to ensure clarity and reliability of the inversion interpretation (Xiao et al., 2008; He, 2016). Second, the inversion calculation analysis is carried out, and the initial two-dimensional geoelectric model is established by the least squares method based on the denoised subsurface spatial information data, which are converted into a depth–apparent resistivity relationship to obtain a physical inversion cross-sectional map showing the characteristic changes in apparent resistivity at the mining area and ground collapse site (Guo et al., 2004; Luo et al., 2020).
Anomalous features and explanations
High-density resistivity method anomaly characteristics
From the basic geological data of the goaf, combined with the analysis of the geophysical inversion section map, it is inferred that the surface layer from the top to bottom is Quaternary clay and cultivated soil layer, which is about 1–8 m thick, and the contour change is not uniform due to the influence of surface hydrological conditions and human activities, and the overall low resistance form. The relative resistivity of the underlying bedrock layer is larger, and with the increase in the detection depth, the overall resistivity trend increases, and the contour change is more uniform. In the area of ground collapse caused by mining and karst, the low resistivity resistance is mainly due to water or sediment filling, and the contour changes are obvious and appear as low-resistance clumps; in the area of fractures or fissures, the originally uniform resistivity appears to be broken, and the contour lines extend in a certain direction.
Interpretation of data inferred from anomalous areas
The high-density resistivity method of physical prospecting is used to lay three lines of measurement in the east–west and seven lines of measurement in the north–south vertical direction in the goaf, covering the mining void and karst ground collapse and their impact areas, to detect and analyze the distribution of strata and the size of cavities, and to infer the morphological characteristics and location of underground anomalies. Based on the resistivity changes in the inversion map of the geophysical prospecting, the overall low-resistance anomaly and the area where the contour lines are closed into clumps are inferred to be a mining hole or a karst collapse: line L1 detects a strip of low resistance underneath the area between measurement points 200 and 290, which is laterally sloping to the north and extends for nearly 70 m, inferred to be caused by the development of fissures in the mining hole and karst, filled with low-resistance water or sediment, with uneven contour distribution. The range of anomalies is extremely large, which is a more serious area of potential ground collapse disaster (Figure 7A); measurement line L2 detects a large-scale anomalous pit-like collapse that is elliptical in shape between measurement points 250 and 330, with a depth of about 30 m from the surface, which is inferred to be a continuous anomalous zone belonging to line L1 and located in the influence area of anomalous collapse in the goaf (Figure 7B); and measurement line L3, with measurement point 300 as the center of the station, detects an anomalous pit-like collapse near the station. The anomalous zone in the south is located at measurement points 70–150, at an altitude of 110–130 m, while the anomalous zone in the middle is located at measurement points 200–270, at an altitude of 95–110 m, and is a zone prone to mining collapse (Figure 7C). The anomalous pattern revealed by measurement line L4 is obviously different, at measurement points 30–110 in the south, at an altitude of 90–120 m, and is inferred to be caused by the filling of low-resistance sediment in the goaf, while the anomalous zone between measurement points 230 and 290, which extends to the bottom in depth, is inferred to be a mining area anomaly with a resistivity of about 100 Ω m, where ground collapse disaster has not occurred yet, and the high-resistance bodies on either side of it are presumed to be the safety pillars, which refer to the part of the ore body that is not mined to protect the safety of the surrounding environment (Figure 7D). Measurement line L5 infers that the anomalous zone between measurement points 30 and 140 and at an elevation of 80–110 m is continuous with L4 and L3, while the anomalous zone between measurement points 280 and 330 extending to the bottom is presumed to be an anomalous area of collapse formed under the joint influence of mining and karst, and the high-resistance areas to the south and north of it are presumed to be the safety pillars (Figure 7E). The karst development zone revealed by the southern measurement point of measurement line L6 is distributed between measurement points 70 and 90 and at an elevation of 80–1,120 m. Another anomaly exists between measurement points 250 and 320, and at measurement point 300 in the center of the line, there is an extension of the contour to the southeast, with an obvious discontinuity with the surrounding bedrock resistivity, inferring the existence of a fracture dipping to the southeast (Figure 8A); the karst development zone in the south-central part of line L7 continues to extend and becomes wider, with another karst development zone at point 320, with the lower contour extending to the southeast and a resistivity misconnection, inferring the existence of a fracture dipping to the southeast (Figure 8B).
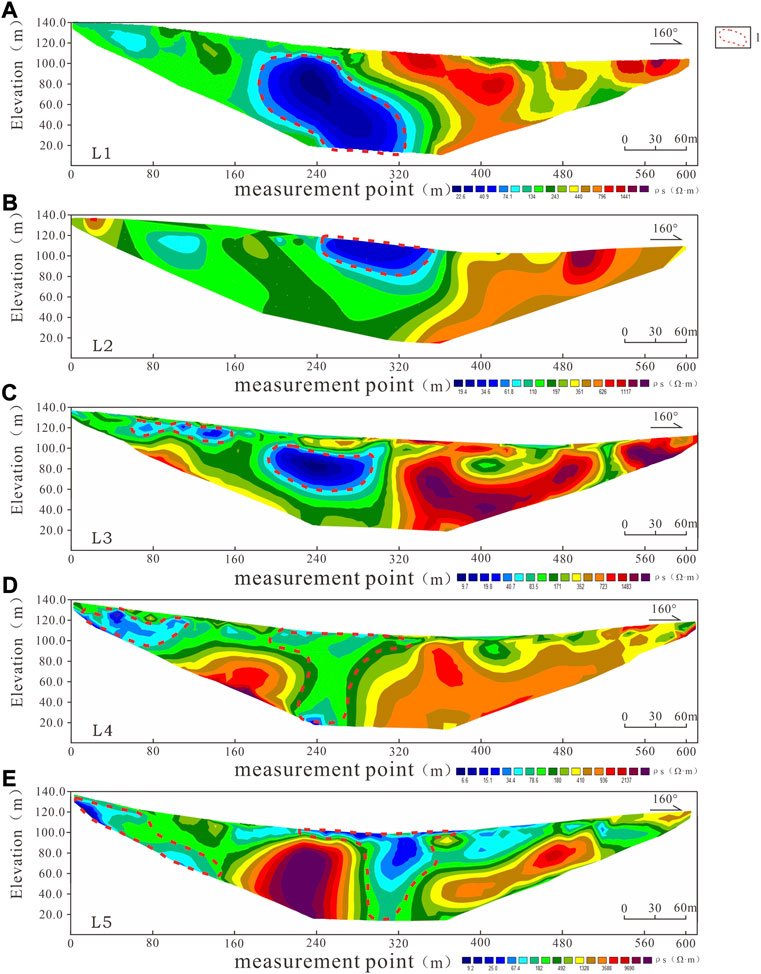
FIGURE 7. Geophysical inversion section (lines L1–L5, A–E) of the high-density resistivity method. 1, inferred scope of collapse.
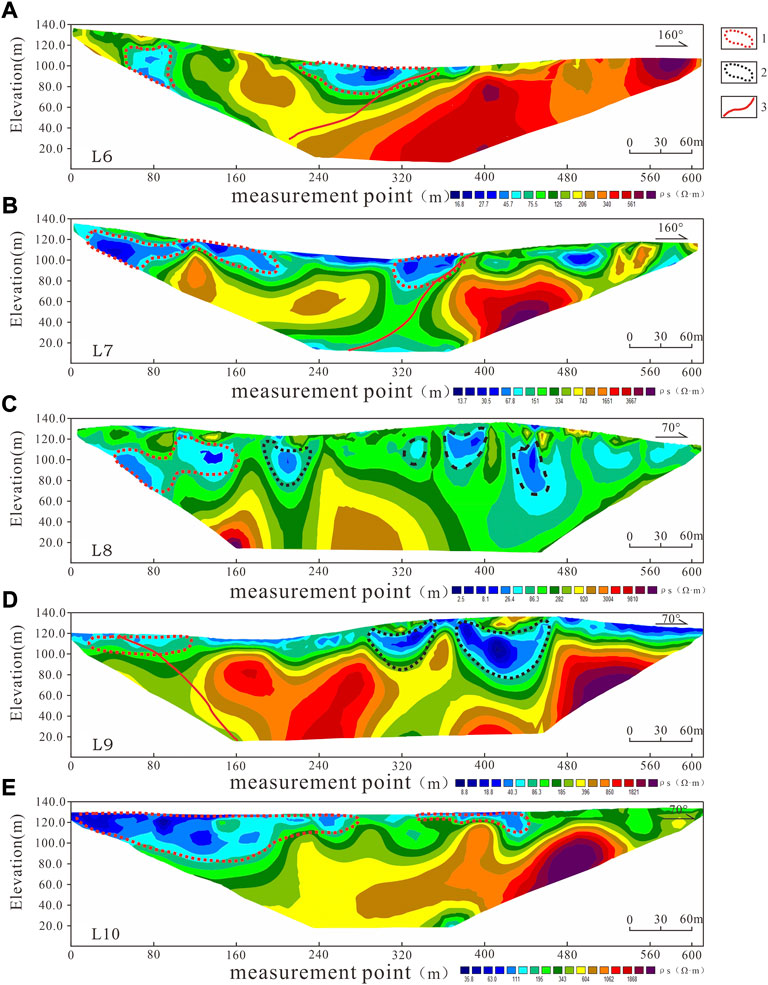
FIGURE 8. Geophysical inversion section (lines L6–L10, A–E) of the high-density resistivity method. 1, inferred scope of karst; 2, inferred scope of collapse; 3, inferred line of fracture.
Three measurement lines were laid in the near east–west profile: L8, L9, and L10. The anomalous area and geological structure distribution revealed by the seven longitudinal lines and three transversal lines are integrated, and it is inferred that line L8 is located at measurement points 50–130, with a karst development zone between 70 and 110 m in depth and an irregular elliptical shape overall. Between measurement points 290 and 320, 470 and 490, 520 and 580, and 610 and 660, the anomalous area is in the shape of small blocks or clusters. The anomaly is located between measuring points 290 and 320, 470 and 490, 520 and 580, and 610 and 660, and between 60 and 100 m above sea level, and the anomalous area is in the shape of small blocks or clusters, which may be filled with shallow water bodies and have low resistivity (Figure 8C). According to the resistivity variation of measurement line L9, there is a resistivity discontinuity in the area extending from south to north between measurement points 100 and 170, and the contour variation is uneven, presumably due to the existence of fractures; between measurement points 430 and 480 and between 540 and 660, the contour circle between 40 and 90 m above sea level is depressed, presumably a mining collapse anomaly (Figure 8D). The shallow surface above 80 m elevation was identified as a large karst anomaly with an irregular elongated shape, mainly due to the erosion of carbonate rocks by water bodies (Figure 8E).
The goaf is filled with water and sediment due to mining activities, and the geophysical inversion section shows a low-resistance irregular shape. The strong hydrological exchange in the carbonate area can easily trigger geological disasters such as cave collapse pits. Geophysical exploration of the area was carried out using the high-density resistivity method and the seven north–south lines and the three east–west lines, which run through the anomalous area of mining and karst ground collapse and its influence range, to verify the anomalous area detected by the seven north–south lines, so as to obtain the overall distribution of mining ground collapse in the area and its morphological characteristics and to detect the possible occurrence and influence range of ground collapse caused by both mining and karst. In this study, the ground collapse caused by both mining and karst and its influence range are detected, and the location of underground anomalies and the distribution pattern of stratigraphy in the area are identified, indicating that the high-density resistivity method can effectively detect the location of similar geological hazards such as ground collapse caused by mining and karst.
Conclusion
(1) The study area is located in a carbonate rock region, where there are many mining activities and human engineering activities, a certain range of underground mining areas, and good conditions for alternating water circulation. The integrity and strength of bedrocks are greatly affected by the karst ground collapse and other geological hazards and hidden dangers, together with the complex geological formations in the mining areas. This in turn greatly affects the safety of life and property of the residents. The high-density resistivity method was used to investigate the mining ground collapse in the study area by laying seven longitudinal lines and three transversal lines, and the mining ground collapse and geological structures revealed by the longitudinal lines were all revealed by the transversal lines. The cross-sectional and longitudinal profiles were mutually verified, and the revealed geohazard development areas were found to have a high degree of overlap.
(2) The high-density resistivity method is suitable for application in karst and mining collapse areas and can effectively identify the distribution of strata and the morphological characteristics of the anomalous areas. It can be used to detect and analyze ground collapse and other geological hazards caused by mining and karst. It can provide an important basis for the selection of hole placement for later drilling work and provide a theoretical basis for the detection and identification of similar geological hazards.
Data availability statement
The original contributions presented in the study are included in the article/Supplementary Material; further inquiries can be directed to the corresponding author.
Author contributions
XJ wrote the manuscript, generated the plots, and analyzed the data; LY provided guidance for data processing and result interpretation; LYL provided guidance for methods selection and the field work; and ZL provided guidance for the field work
Funding
The project was funded by the Natural Science Foundation of Hunan Province (Grant No. 2022JJ30244) and the Research Project of Teaching Reform of Hunan Province (Grant No. HNJG-2022-0790).
Conflict of interest
The authors declare that the research was conducted in the absence of any commercial or financial relationships that could be construed as a potential conflict of interest.
Publisher’s note
All claims expressed in this article are solely those of the authors and do not necessarily represent those of their affiliated organizations, or those of the publisher, the editors, and the reviewers. Any product that may be evaluated in this article, or claim that may be made by its manufacturer, is not guaranteed or endorsed by the publisher.
References
Di, Q., Shi, K., Wang, M., et al. (2001). Water resources exploration with CSAMT and high-density electric resistivity method. Prog. Geophys. 16 (03), 53–57+127.
Dong, H., and Wang, C. (2003). Development and application of 2D resistivity imaging surveys. Earth Sci. Front. 10(01), 171–176.
Fu, G., Huang, J., Liu, Y., Li, X., Chen, G., and Huang, Y., (2019). Multi-electrode resistivity method and CSAMT method in geothermal exploration of Babei area in Huichang County, Jiangxi Province. Geol. China 46 (04), 927–936.
Gao, M., Yu, S., Zheng, J., Xu, C., Zhang, K., and Hui, L., (2015). Application of PSBP method in high-density two-dimensional resistivity inversion. J. Jilin Univ. Technol. Ed. 45 (06), 2026–2033.
Ge, S., Li, X., Shao, C., Chen, J., and Chen, X., (2008). Application of seismic refraction and resistivity for exploration of reservoir dam site. Prog. Geophys. 23(04), 1299–1303.
Gong, P., and Li, W. (2018). Application of transient electromagnetic method in collapse hazard of goaf:take the investigation of the goaf in Shendong coal mine as an example. J. Geomechanics 24 (03), 416–423.
Guo, X., Jia, Y., Huang, X., and Niu, J. (2004). Application of multi-electrodes electricalmethod to detection of slide-face position. Chin. J. Rock Mech. Eng. 23 (10), 1662–1669.
Han, P. (2020). Forward modeling and inversion of the high-density resistivity method in detecting karst caves of different filling types. Geol. Explor. 56 (06), 1219–1225.
He, G. (2016). The application high-density resistivity method to karst detection. Chin. J. Eng. Geophys. 13 (02), 175–178.
Huang, G., Zhao, J., Li, C., and Li, S. (2019). Detection of underground karst caves by comprehensive geophysical exploration in karst area: Taking yongan dahu basin in fujian province as example. Prog. Geophys. 34 (03), 1184–1191.
Jia, X., Liu, Y., Li, X., et al. (2021). The application of Opposing Coils Transient Electromagnetics in the detection of karst subsidence area. Coal Geol. Explor. 49 (03), 212–218.
Jin, C., and Liu, J. (2014). Two-dimensional numerical simulation and application of the high-density resistivity method. Geol. Explor. 50 (05), 984–990.
Lei, J., Yang, J., Xiao, W., and Liu, C. (2009). Analysis of forming conditionsand maininfluential factors of karst collapse in Guanzhou. Geol. Explor. 45 (04), 488–492.
Li, H., Xu, H., Zheng, L., and He, Y. (2019). In situ experimental study on resistivity-magnetic resonance sounding coupling imaging diagnosis method for an embankment dam with seepage defects. Prog. Geophys. 34 (04), 1627–1634.
Li, J., Nie, Q., Liu, Q., and Jia, X. (2017). Logistic regression model for stability assessment of karst ground collapse of Tangshan city. Rock Soil Mech. 38 (S2), 250–256.
Li, W., Zhang, Y., Zhang, B., Li, J., Wang, J., and Ma, X. (2014). Origin, characteristics and significance of collapsed-paleocave systems in Sinian to Permian carbonate strata in Central Sichuan Basin, SW China. Petroleum Explor. Dev. 41 (05), 563–573. doi:10.1016/s1876-3804(14)60067-7
Luo, X., and Cheng, L. (2016). Comprehensive geological prediction and risk assessment of covered karst ground collapse. Carsologica Sin. 35 (01), 51–59.
Luo, Z., Liu, W., Cao, P., et al. (2020). Application of the high-density resistivity method in detecting a mined-out area in the Xiaozhuohe iron deposit of Laizhou City, Shandong Province. Geol. Explor. 56 (01), 0113–0122.
Lv, H., liu, S., and liu, B. (2005). Application of resistivity tomography survey method in detecting ground subsidence. Prog. Geophys. 20 (02), 381–386.
Shen, N., Yang, J., and Zheng, X. (2001). Prediction of mining collapse based on neural network. Coal Geol. Explor. 29(03), 42–44.
Wang, B., and He, K. (2006). Study on limit equilibrium height expression of critical soil cave of karst collapse. Rock Soil Mech. 27 (03), 458–462.
Wang, S., Xianguo, T., Li, H., et al. (2011). The application of radon measurement method and high-density electrical method in the exploration of the fault location. Earth Sci. Front. 18 (02), 315–320.
Xiao, H., Wan, L., and Sun, X. (2008). The anomaly characteristics of the high-density resistivity method used in landslide investigation. J. Catastrophology 23 (03), 27–31.
Xie, J., Tan, F., Jiao, Y., Zuo, J., and Mao, J., (2021). Prediction of karst ground collapse based on factor analysis-GA-ELM model. J. Eng. Geol. 29 (2), 536–544.
Yan, Q., Yang, y., Li, S., et al. (2021). Application of the high-density resistivity method in karst site investigation of a waste incineration environmental protection power station. Geol. Explor. 57 (05), 1107–1116.
Yang, Z., Yan, J., Liu, Y., et al. (2012). Research progresses of the high-density resistivity method. Geol. Explor. 48 (05), 969–978.
Zeng, Y., and Zheng, X. (2007). Fuzzy evaluation method for karst collapse risks. J. Eng. Geol. 15 (01), 62–65.
Zhang, G., Yang, B., Zhang, Z., et al. (2015). Susceptibility prediction of underground mining collapse based on GIS and BP neural network. Trop. Geogr. 35 (05), 770–776.
Zheng, Z., Zeng, J., Gan, F., et al. (2017). Application of high-density electrical resistivity imaging to karst collapse investigation at the Taiyangcun town, Liuzhou. Geol. Exoloration 53 (01), 124–132.
Keywords: high density resistivity method, goaf ground collapse, apparent resistivity, karst, geophysical inversion
Citation: Jia X, Yang L, Yulong L and Lianzhi Z (2022) Application of the high-density resistivity method in detecting a mined-out area of a quarry in Xiangtan City, Hunan Province. Front. Environ. Sci. 10:1068956. doi: 10.3389/fenvs.2022.1068956
Received: 13 October 2022; Accepted: 07 November 2022;
Published: 25 November 2022.
Edited by:
Lei-Lei Liu, Central South University, ChinaCopyright © 2022 Jia, Yang, Yulong and Lianzhi. This is an open-access article distributed under the terms of the Creative Commons Attribution License (CC BY). The use, distribution or reproduction in other forums is permitted, provided the original author(s) and the copyright owner(s) are credited and that the original publication in this journal is cited, in accordance with accepted academic practice. No use, distribution or reproduction is permitted which does not comply with these terms.
*Correspondence: Liu Yang, bGl1eWFuZzI1ODU4OTlAMTYzLmNvbQ==