 Xinyang Yan
- 1Meteorological Service Center of Gansu Province, Lanzhou, China
- 2Key Laboratory of Arid Climatic Change and Reducing Disaster of Gansu Province/Key Open Laboratory of Arid Climatic Change and Disaster Reduction of CMA, Institute of Arid Meteorology, China Meteorological Administration, Lanzhou, China
- 3Earth System Modeling and Prediction Centre of China Meteorological Administration, Beijing, China
In recent years, with the frequent occurrence of severe drought events, climate change in arid regions has become one of the research hotspots. However, previous studies mainly focused on a specific arid region, and the correlations and differences of drought among various arid regions have not been clearly understood. In this study, based on the latest monthly gridded dataset of the CRU, we compare the characteristics of climate change and its relationship with large-scale oceanic oscillation indexes in the three typical arid regions of Pan-Central-Asia (PCA), North America (NAm) and North Africa (NAf) in multiple perspectives. The results show that the precipitation in the PCA and NAm has increased obviously over the past 80 years, while the NAf precipitation has decreased. After the 1980s, the climate in the PCA and NAm show warm-wet types. This type of the former continues to the present, but the latter’s has changed to a warm-dry type since the 21st century. The NAf climate remains the warm-dry type since the 1990s. Nonetheless, the arid and semi-arid climate patterns in the three typical arid regions remain unchanged. The NAm precipitation has an anti-phase variability pattern compared with the NAf precipitation on both interdecadal and multi-decadal time scales. The Pacific Decadal Oscillation (PDO) has a great influence on the precipitation of the PCA and NAm. The temperature of three arid regions is significantly related to the variations in the Arctic oscillation (AO). In the inland arid region, the contribution of strong warming effect during cold season to the whole year is much greater than that during warm season, while the contribution of the coastal arid regions in warm season is greater. The precipitation in the mid-latitude arid regions is dominated by cold-season precipitation regardless of whether these regions are near the sea or not. The precipitation in the low-latitude arid regions has little difference between cold and warm seasons.
Introduction
Arid regions are areas where regional precipitation is insufficient to compensate for surface evapotranspiration, accounting for more than 40% of the global land surface area (Feng and Fu, 2013). As a special component of the land, arid regions have an extremely fragile ecological environment and are highly sensitive to human activities and global climate change (Sheffield et al., 2012; Zhang et al., 2014; Dai and Zhao, 2016). In the past 100 years, the global arid regions have shown characteristics such as area expansion (Zeng and Yoon, 2009; Cai et al., 2018), remarkable warming (Huang et al., 2012), frequent severe drought disasters (Zhang et al., 2009; Zhang et al., 2015; Yan et al., 2019), which have profound impacts on regional and global climate change. Therefore, climate change in arid regions has become one of the hot topics in the climate research field.
In the context of global warming, land precipitation has undergone obvious changes, characterized by great regional differences (Huang et al., 2015). The climate in some regions shows a warming-wetting trend (Yan et al., 2022), while in others, it tends to become warming-drying (Dai, 2012a), i.e., the climate response to global warming is not consistent in different arid regions (Greve et al., 2014; Trenberth et al., 2014; Allen and Anderson 2018). A slight change in global climate can affect the whole situation. For instance, regional temperature and humidity anomalies may cause extreme climate events thousands of kilometers away by changing atmospheric circulations (Xu et al., 2017). Therefore, it is undoubtedly of great practical and scientific significance to study the consistency and difference of climate change among multiple typical arid regions and explore the mutual influence of these regional climates.
Previous studies on climate change in arid regions have made a series of meaningful advances (Trenberth et al., 1988; Dai et al., 1998; Zhang et al., 2018; Guan et al., 2019). Giannini et al. (2003) suggest that variability of rainfall in the Sahel results from the response of the African summer monsoon to oceanic forcing, amplified by land-atmosphere interaction. Dai (2012b) used observational and reanalysis data and model simulations, and examined the influence of the Inter-decadal Pacific Oscillation (IPO) on the West US precipitation. He thought that a strong high pressure center over the North Pacific in the lower troposphere during cold phases of the IPO, which lead to below-normal precipitation over much of the West US. Zhang et al. (2022) studied the trend of warming-wetting in arid regions of northwest China. They firmly believed that the precipitation in northwest China displayed a trend of increasing in the west and decreasing in the east, but the area with increased rainfall expanded eastward, and the area experiencing humidification extended across the whole of the northwest. Nevertheless, most of them have been conducted for a specific arid region, lacking comparisons of climate change at different spatial scales and sufficient understanding of the correlations and differences among regional climates in arid zones. Especially, there are few comparative studies on the characteristics of temperature and humidity changes in the typical arid regions of Asia, Africa and America.
Therefore, in this research, the arid regions of Pan-Central-Asia (PCA), North America (NAm) and North Africa (NAf) in the Northern Hemisphere are selected as the representative regions of mid-latitude inland arid regions in Asia, mid-latitude coastal arid regions in America caused by large-scale terrain and low-latitude coastal flat arid regions in Africa, respectively. Based on the latest monthly gridded dataset of the Climatic Research Unit Time Series version 4.05 (CRU TS v4.05), the variation characteristics of temperature, precipitation and aridity index (AI) in the three typical arid regions in the past 80 years (1941–2020) are compared in multiple perspectives to reveal the correlations and differences of regional climate. In addition, the relationships between climate change characteristics and large-scale oceanic oscillation indexes are analyzed. This research aims to deepen further the understanding of climate change characteristics in typical arid regions to provide a scientific basis for effective regional climate prediction and reasonable response to regional climate change.
Study region, data and methods
Study region
The PCA covers the area west of the Taihang Mountains in China, the Hexi Corridor, north of 35°N, most of Mongolia, the Kazakh Hills and the region west of the Caspian Sea. Its climate is mainly affected by land-atmosphere interactions and large-scale terrain, which is typical temperate continental and plateau mountain climates.
The NAf is located in the northern part of the African continent, bordered by the ocean in the east, west and north. It is a representative area of low-latitude coastal arid regions, which is flat and mostly deserts. The climate of the NAf is mainly affected by the Hadley circulation, ocean-atmosphere interactions and dust aerosols, belonging to typical tropical and subtropical desert climates (Figure 1).
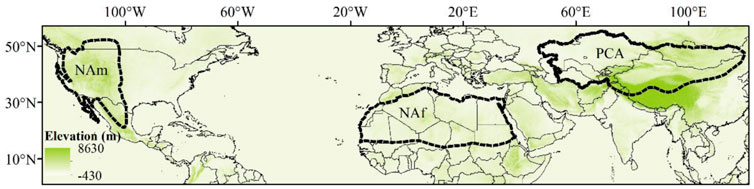
FIGURE 1. Three typical arid regions of the Northern Hemisphere.
The NAm is on the west coast of the North American continent and is mountainous, belonging to the northern part of the Cordillera Mountains and bordering the North Pacific Ocean. Its climate is mainly influenced by the Hadley circulation, large-scale terrain and ocean-atmosphere interactions (Table 1).
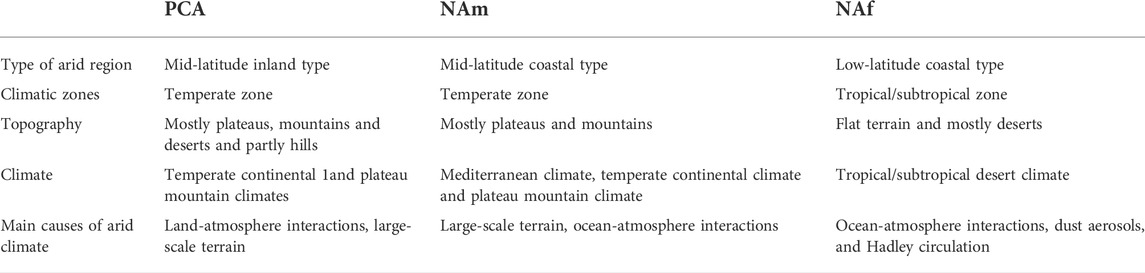
TABLE 1. Typical arid regions in the Northern Hemisphere.
Data
The data used in this study are from the CRU TS v 4.05, which has a temporal coverage of January 1941 to December 2020 and a horizontal resolution of 0.5° × 0.5° (Harris et al., 2020). This high-resolution monthly gridded dataset was developed by the CRU of the University of East Anglia by integrating several well-known databases, which is a complete, high-resolution and uninterrupted dataset of surface climate elements. It was obtained through a direct interpolation of observations, thus without the uncertainty caused by proxy data and the data gap caused by the scarcity of stations and inaccessibility in many typical arid regions (Yan et al., 2021). Currently, the CRU dataset has been widely used in climate change research because of its high resolution, long time scale and high quality control (Chen et al., 2011; Zhang et al., 2016).
It is well known that some primary oceanic oscillation significantly impact the multi-periodic changes of climate at global and regional scales (Giannini et al., 2003; McCabe et al., 2004). As the most obvious signal of interannual variability in the tropical Pacific, the Southern Oscillation Index (SOI) can cause regional and global climate change through ocean-atmosphere interactions, and it can reflect the activity of the El Niño phenomenon (Huang et al., 2015; Infanti and Kirtman 2016). The Pacific Decadal Oscillation (PDO) is a long-lived periodic pattern of oceanic and atmospheric climate change, which plays an essential role in regulating the interdecadal precipitation variability at the middle and high latitudes of the Northern Hemisphere (Gu and Adler, 2015; Guan et al., 2019). In addition, the interannual variability of the westerly circulation at the middle and high latitudes of the Northern Hemisphere can affect the water vapor transport in Central Asia (Liu et al., 2018), resulting in precipitation changes in this region. It is worth noting that the westerly circulation is closely related to the Arctic oscillation (AO) and the North Atlantic Oscillation (NAO) (Vicente-Serrano et al., 2016; Guan et al., 2019). Therefore, we discuss the impacts of the PDO, NAO, AO and SOI on climate change in typical arid regions of the Northern Hemisphere in this research. The corresponding four indexes can be obtained by the method described in Yan et al. (2022).
Methods
The AI is obtained by the calculation method described in Zhang et al. (2016), as shown in Eq. 1.
where P denotes the precipitation (mm), and PET represents the potential evapotranspiration (mm), calculated by the P-M formula. This calculation method shown in Eq. 1 makes up for the shortcomings of the traditional AI calculation method, where the results are not available due to the rainfall amount of 0 (P divided by PET). The larger (smaller) the AI, the drier (wetter) the climate.
Ensemble empirical mode decomposition (EEMD) is a noise-assisted data analysis method proposed to solve the shortcomings of empirical mode decomposition, which can effectively extract specific time-scale changes from an original time series, and has been widely used in climatology (Wu and Huang, 2009; Xu et al., 2017; Bi et al., 2018). Therefore, we use the EEMD method to decompose the annual series of precipitation and temperature, aiming to comprehensively evaluate the interdecadal oscillation and long-term trend of the climate in the study region. In the EEMD decomposition process, the signal-to-noise ratio between the disturbing signal (white noise) and the original signal is set to 0.2, and the average dataset number is 500. Finally, we can obtain the five components of the intrinsic mode functions (IMFs) with different time scales and fluctuation amplitudes and the trend term components reflecting the overall variation trend in each arid region. The components of the IMFs sequentially reflect the change of the original sequence from high frequency to low frequency, namely the local features of the original sequence.
The correlation between the two variables is characterized by the Pearson linear correlation coefficient (PCC) in this study. The PCC values were tested by using the Student’s t-test at 95% and 99% confidence levels using N-2 degrees of freedom (Hu et al., 2017). In addition, the Mann-Kendall method is used for the trend test, which was first proposed by Mann (1945) and has been widely used to calculate the variation trends of time series of elements such as precipitation and temperature. The Mann-Kendall method is a non-parametric statistical test method that does not require sample data to obey a specific probability distribution and is not disturbed by other abnormal values (Ma and Fu, 2005; Zhang et al., 2009). In addition, this method is easy to calculate. Thus, it is more suitable for non-normal distribution data such as meteorological and hydrological data. Note that “*” in the following section represents that the corresponding PCC value passed the 95% confidence level, and “**” indicates that the corresponding PCC value passed the 99% confidence level.
Results
Temporal variation characteristics
Figure 2 shows the 3-year moving averages of precipitation anomalies in the three arid regions and the global. The results indicate that the global precipitation shows an overall increasing trend in recent decades, with an obvious pattern of overall changes. Specifically, the distribution of precipitation over time is similar to the sine-shape curve before the mid-1990s, and after that, the global precipitation is basically dominated by positive anomalies (Figure 2D). The precipitation variations in the PCA and NAm are similar and have cluttered positive and negative anomaly distributions without apparent patterns (Figures 2A,B), reflecting the uncertainty and complexity of precipitation variability in arid regions. However, the precipitation in the NAf generally shows positive anomalies before the mid-1960s and negative anomalies after that (Figure 2C).
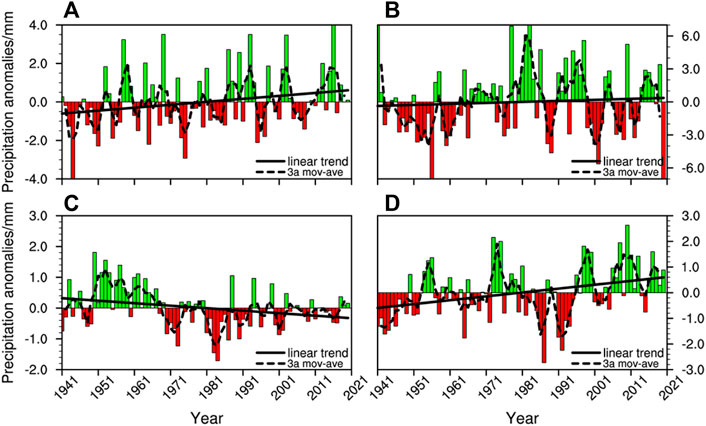
FIGURE 2. The 3-year moving averages of precipitation anomalies in the three typical arid regions of (A) PCA, (B) NAm and (C) NAf and (D) the global from 1941 to 2020.
In terms of the interannual precipitation variability (Figures 3A,C,E), the precipitation in the PCA and NAm shows an increasing trend at the rates of 1.84 mm (10a)−1 and 1.10 mm (10a)−1, respectively. Among them, the NAm precipitation shows a variation pattern of increasing-decreasing-increasing (Figure 3C), i.e., the precipitation increases from the 1950s until the peak (450.9 mm) in 1983 and then decreases, and it increases again around 2,000. However, the NAf precipitation shows a decreasing trend from the 1950s until 1984 when it reaches the valley value (64.6 mm), and then it increases, generally showing a V-shaped variation pattern of decreasing and then increasing (Figure 3E). Therefore, the precipitation in the NAm and NAf displays an anti-phase variation characteristic.
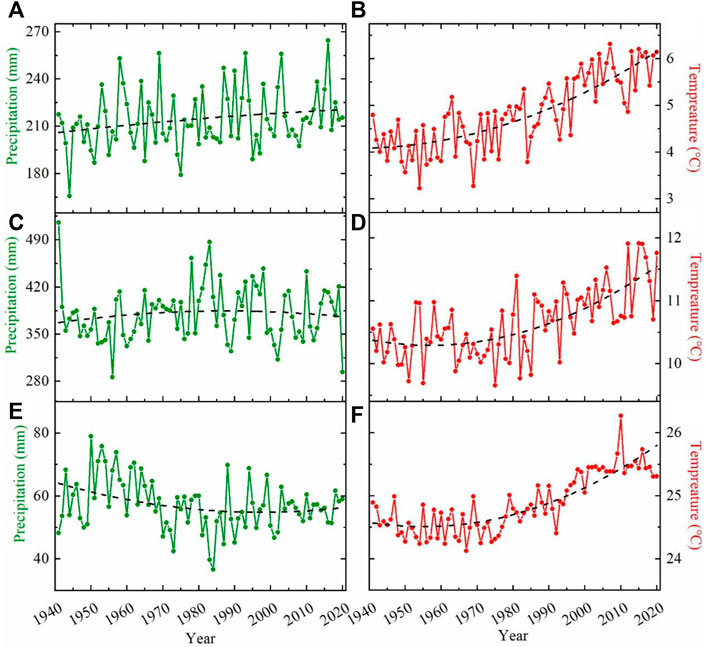
FIGURE 3. Interannual variations of the precipitation and temperature in the (A,B) PCA, (C,D) NAm and (E,F) NAf from 1941 to 2020.
In addition, the fitting curves also reflect an anti-phase variation characteristic, i.e., the fitting curve of the NAm precipitation is slightly convex, while that of the NAf precipitation is slightly concave. This feature is more obvious in the interdecadal precipitation trend of the NAm and NAf shown in Figure 4, probably due to the anti-phase variation of the sea surface temperature between the North Pacific Ocean and the equatorial ocean (Hunt 2000). This anti-phase variation characteristic of the precipitation is characterized by a cycle of 30–40 years (Figure 4).
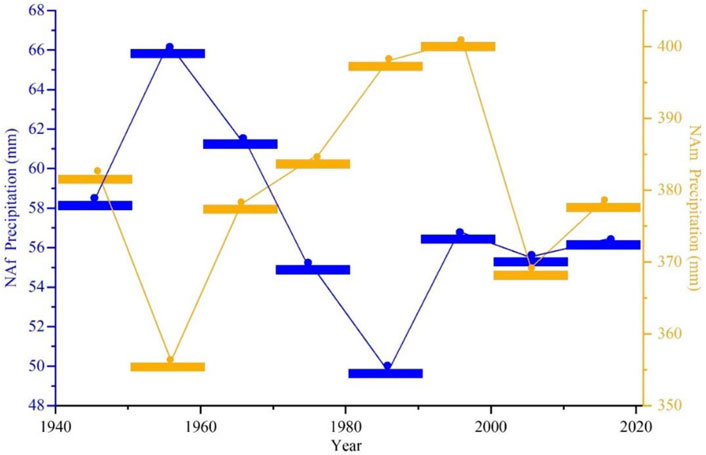
FIGURE 4. Interdecadal precipitation variations in the NAm and NAf from 1941 to 2020.
The temperature in the three typical arid regions shows an overall increasing trend (Figures 3B,D,F). Specifically, the PCA temperature increases the most obvious, with an increment of more than 2°C and a rate of 0.26°C (10a)−1 in the past 80 years. The NAm has the slowest warming rate of 0.15°C (10a)−1. The temperature variation in the NAf shows prominent tropical characteristics, and the average temperature is above 24°C, with an increasing rate of about 0.16°C (10a)−1. There is a strong consistency in the variations of temperature anomalies, namely apparent negative anomalies before the early 1990s and obvious positive anomalies after that (Figure 5).
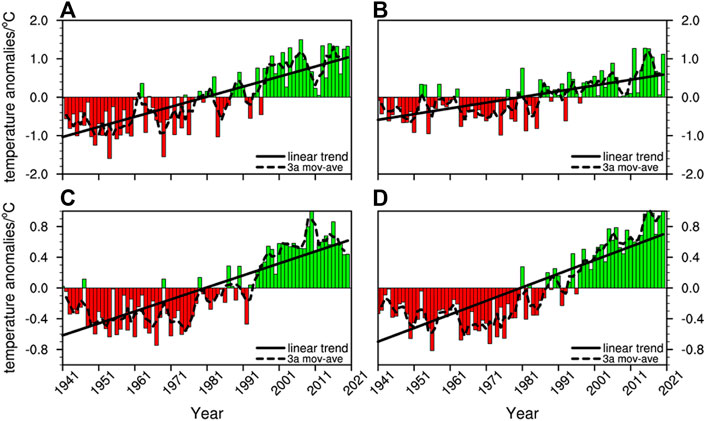
FIGURE 5. The 3-year moving averages of the tempreture anomalies in the (A) PCA, (B) NAm, (C) NAf and (D) the global from 1941 to 2020.
The differences in aridity variation among the three regions are not completely consistent with those of precipitation variation (Figure 6). The climate in the PCA shows a continuous wetting trend, and from the 1990s, the average annual non-precipitation days (NPD) and the rainfall amount increase obviously, indicating that the extremes and spatial heterogeneity of the precipitation increase in arid regions due to global warming. Under the joint influence of the increased precipitation and PET in the PCA (Figure 7A), the AI trend in this region is relatively stable, and the warming-wetting trend slows down. Since 21st century, the average NPD in the NAm increases slightly (Figure 7B), while the precipitation and PET increase. The climate in this region shows a wetting trend in the early period and a drying trend in the later period. Relative to the other two regions, the NAf is the driest, with the smallest AI amplitude and a relatively stable climate state. Similar to the situation in the PCA, the PET in the NAf also increases from the 1990s (Figure 7C). However, there is no obvious increase in precipitation in this region. Thus, the climate in the NAf shows an obvious drying trend (Figure 6). It can be concluded that the PET, as a measure of atmospheric demand for surface water, is crucial to the formation and development of arid climate.
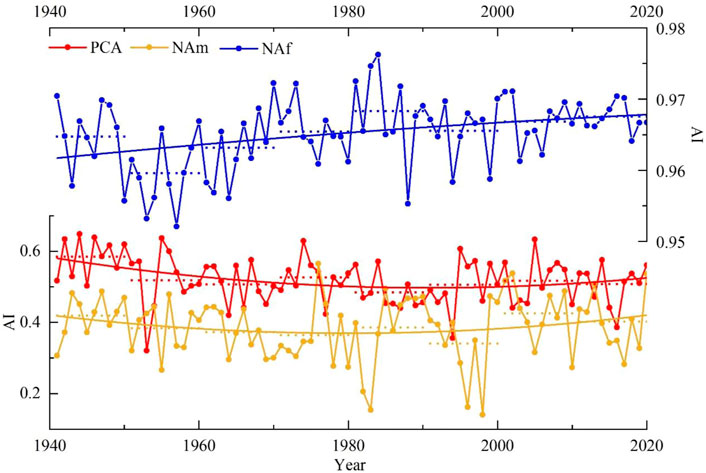
FIGURE 6. Interannual variation trends of the AI in three arid regions from 1941 to 2020. The dotted lines presents the decadal averages, and the curves are the fitting lines.
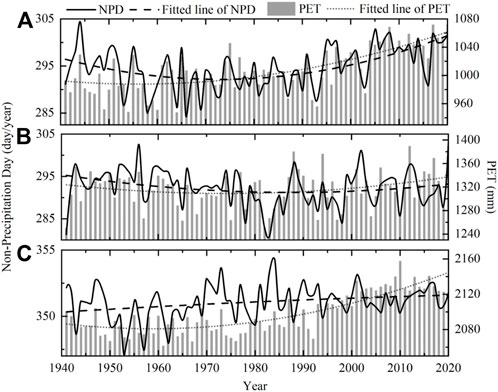
FIGURE 7. Variation trends of the NPD and PET in the (A) PCA, (B) NAm and (C) NAf from 1941 to 2020.
In order to further compare the multi-timescale characteristics of temperature and precipitation, we decompose the annual average temperature and annual accumulated precipitation using the EEMD method. The results suggest that the precipitation variability in the three arid regions is mainly on the interannual time scale, with quasi-3-year and quasi-6-year cycles and total variance contributions of these two cycles exceeding 50%. The quasi-3-year cycle is the dominant cycle of common and essential signals of atmospheric circulation and climate variabilities on the interannual time scale, and many meteorological elements in the troposphere have this cycle. In addition, the quasi-53-year cycle of the temperature and precipitation in the NAm is also obvious, with a variance contribution rate of 20.56% (Table 2). Different from precipitation, long-term variation trends dominate the temperature variability, which reflects the fact that there is continuous global warming due to long-term and massive greenhouse gas emissions. Moreover, there is an obvious quasi-3-year cycle in temperature variability in three arid regions, and the variance contribution rate of this cycle is above 22%.
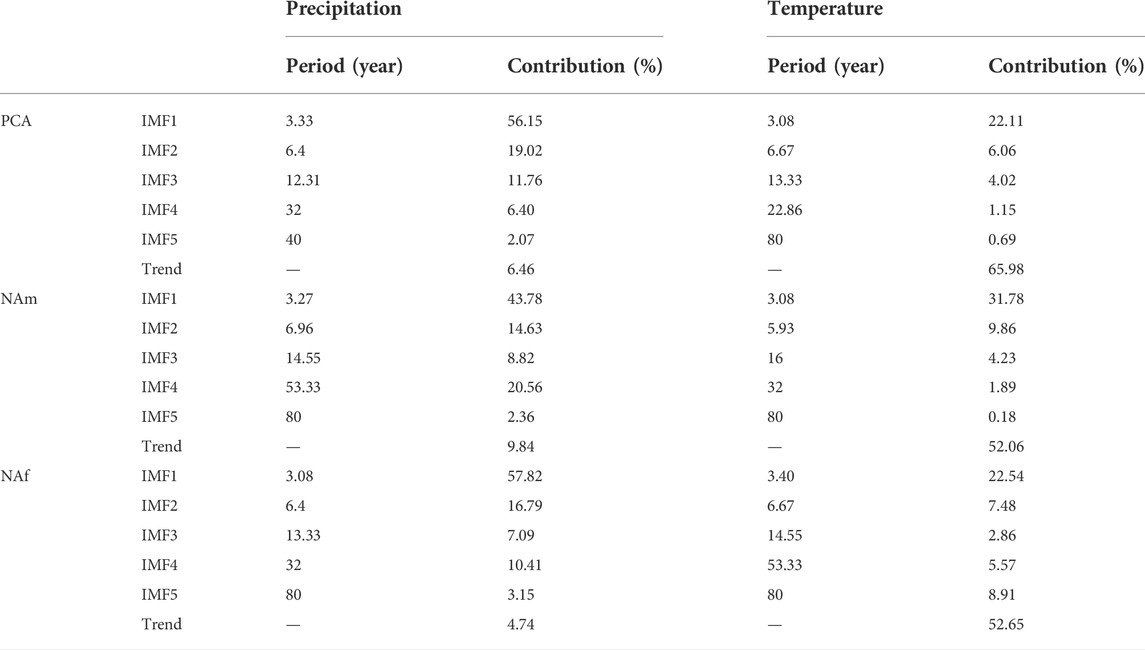
TABLE 2. Periods of the precipitation and temperature components after the EEMD and their variance contribution rates.
On the interdecadal scale, the amplitude of the precipitation variability in the PCA and NAm is small before the 1970s and increases since the 1980s, while the NAf precipitation shows exactly the opposite variability pattern (Figures 8A–C). On the multi-decadal time scale, the precipitation in the PCA and NAf have a similar variability pattern, but it is opposite to the NAm precipitation. The precipitation in the NAm has an anti-phase variability pattern compared with the precipitation in the NAf on both interdecadal and multi-decadal time scales (Figures 8B,C). Since the 21st century, the IMF 4 and IMF 5 of the temperature in the PCA and NAf are in a decreasing phase (Figures 8D,F), which together offset the long-term trend of continuous temperature increase, resulting in a slowing down of the continuous strong temperature increase in the two arid regions from the 1970s. Due to the response of precipitation to temperature, the contribution of the interannual time scale for temperature variability is prominent, but the multi-decadal time scale characteristics of both meteorological elements are not sufficiently remarkable (Figures 8D–F).
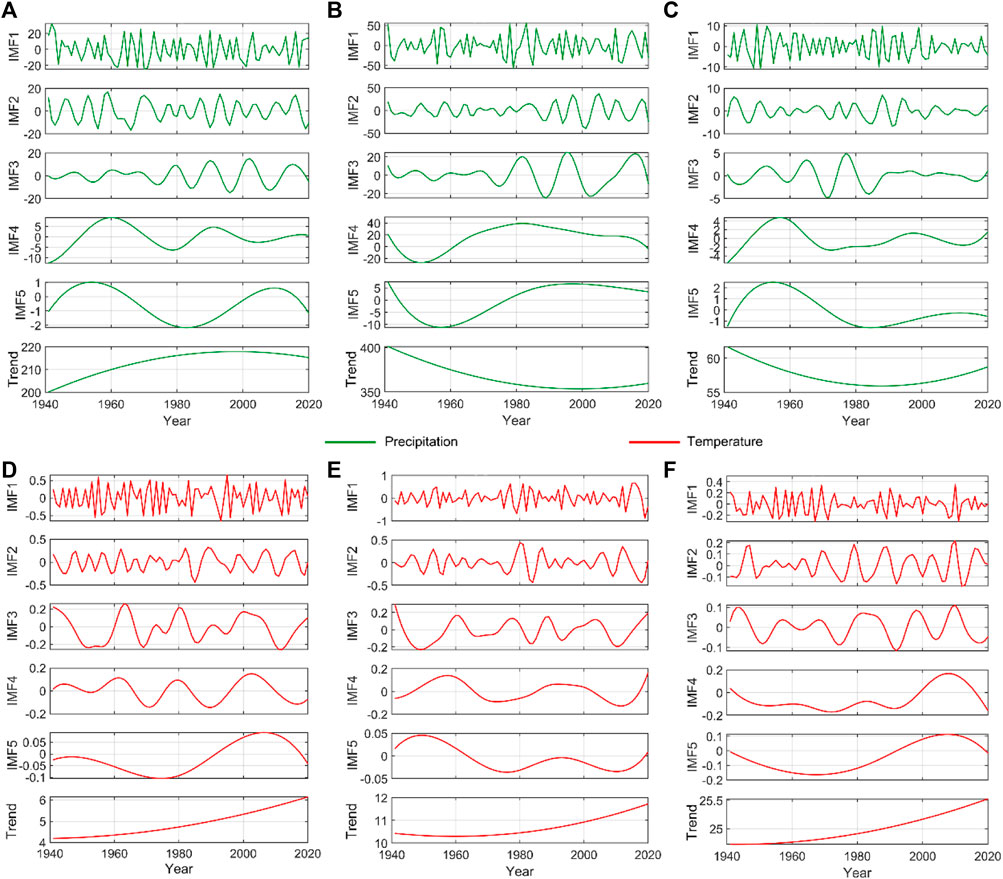
FIGURE 8. Time series of the precipitation and temperature in the PCA (A,D), NAm (B,E) and NAf (C,F) based on the EEMD.
Owing to the positive feedback of water vapor, the variations of temperature and precipitation in a specific region generally show a certain correlation on interdecadal or even longer time scales, where the periods with positive temperature anomaly (warm periods) usually correspond to the periods with positive precipitation anomaly (wet periods). However, the relationship between temperature and precipitation variations is more complex on a shorter time scale. Figure 9 shows the interdecadal distributions of temperature and precipitation anomalies in the three arid regions from 1941 to 2020. The results indicate that the climates in the three arid regions shift between cold-dry and cold-wet types from the 1940s to the 1980s. After the 1980s, the global climate warms rapidly with accelerated industrialization, and the climate in the PCA shows a warm-wet type that continues to the present (Figure 9A). The NAm climate is briefly in the warm-wet type, and it turns to a warm-dry type after the 21st century (Figure 9B). The NAf climate remains the warm-dry type since the 1990s (Figure 9C). Notably, the NAm climate seems to have a trend towards a warm-wet type. However, the climate with a trend towards a warm-wet type is not the same as a wetting climate, and they have two completely different definitions. Under the background of climate warming, the precipitation extremes increase, with a remarkably uneven distribution. Simultaneously, the PET is enhanced (Figure 7), which offsets most of the precipitation increment. Therefore, the arid and semi-arid climate patterns in the three typical arid regions remain unchanged.
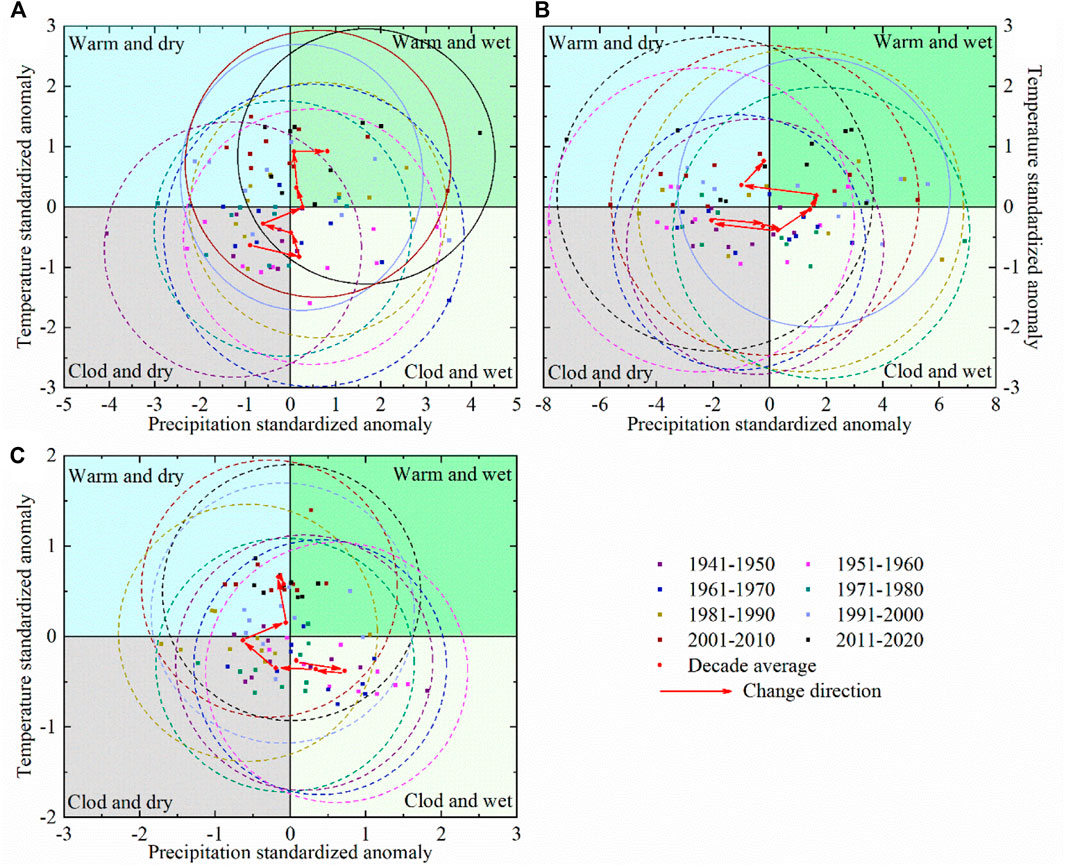
FIGURE 9. Interdecadal distribution of temperature and precipitation anomalies in PCA (A), NAm (B), NAf (C) from 1941 to 2020.
Relationships between climate change and oceanic oscillation indexes
As shown in Table 3, we analyze the correlations of the four oceanic oscillation indexes with the precipitation and AI in the three arid regions. The correlation coefficients between the precipitation and PDO index in the three arid regions all pass the significance test at the 95% confidence level, with the highest correlation (PCC = 0.55**) in the NAm. The PDO positively correlates with the precipitation in the PCA and NAm but obviously negatively correlates with the NAf precipitation. The correlations between the PDO and AI in the three regions also have a similar characteristic, i.e., they are positive in the PCA and NAm but negative in the NAf. The SOI obviously negatively correlates with the precipitation in the PCA and NAm but positively correlates with the NAf precipitation. In the positive phase of the SOI, the climate in the PCA and NAm show an apparent drying trend, while that in the NAf exhibits a wetting trend, which is consistent with the results obtained by analyzing the precipitation variability.
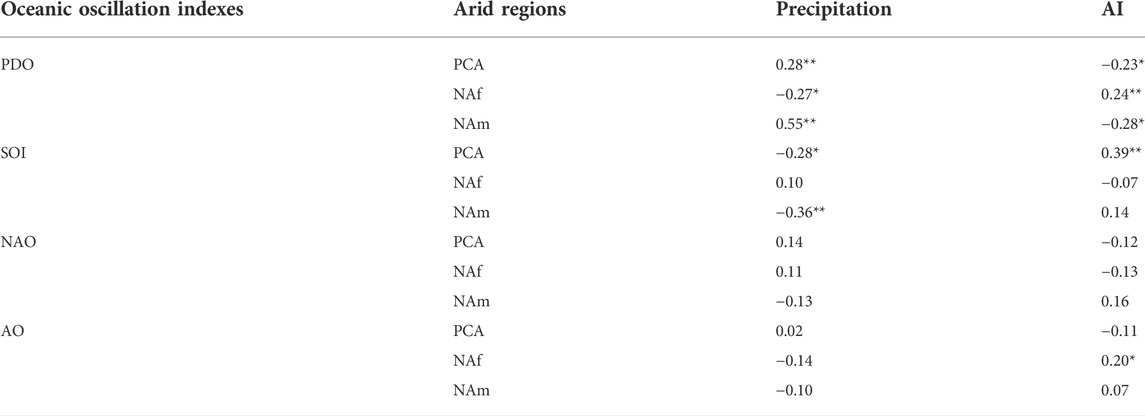
TABLE 3. Correlations of the precipitation and AI with the PDO index, SOI, NAO index and AO index in three arid regions from 1941 to 2020.
In order to investigate the driving factors of periodic climate change in three arid regions, we calculate the correlations of the four oceanic oscillation indexes with each precipitation and temperature component after the EEMD (Figure 10). The results suggest that the PDO has a great influence on the cycles of the precipitation variabilities in the PCA on the interannual scale, and it controls the precipitation variability in the NAm at different time scales. The NAO mainly affects the quasi-12-year cycle of the PCA precipitation and the quasi-3-year cycle of the NAf precipitation by regulating the strength of the westerly circulation, but it has little effect on the NAm precipitation. The AO is highly associated with the long-term precipitation trend in the NAm and PCA. However, since the contribution of this long-term trend to the original precipitation series is not high, the AO has little influence on the precipitation in the arid regions of the NAm and PCA.
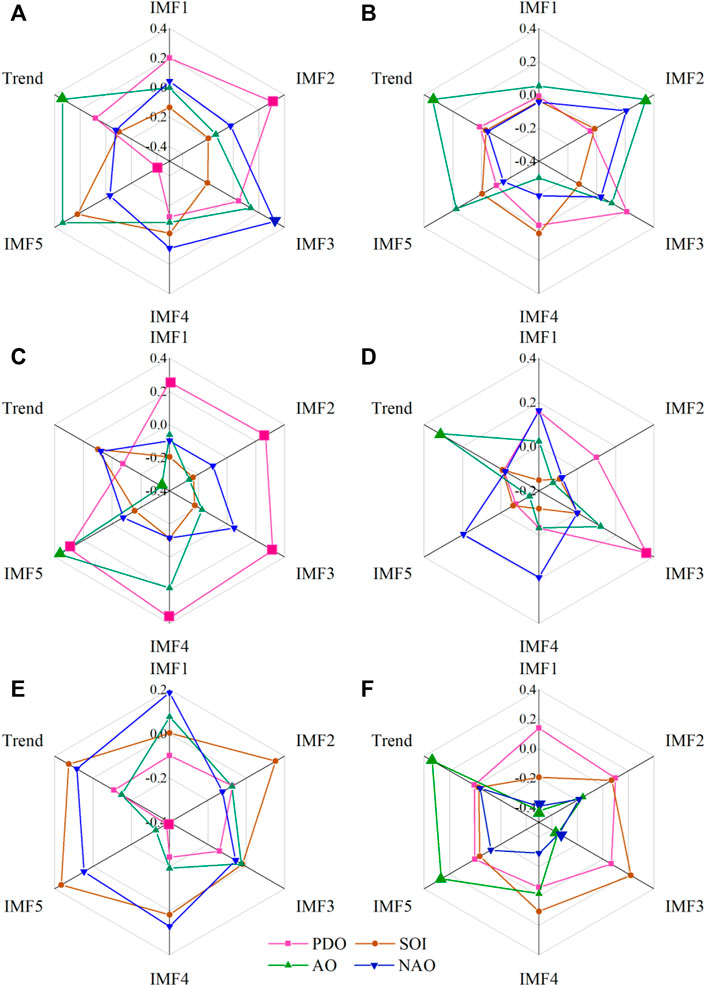
FIGURE 10. Correlations of the four oceanic oscillation indexes with the components of the precipitation (left) and temperature (right) after the EEMD in the PCA (A,B), NAm (C,D), NAf (E,F). The larger dots indicate the values passing the significance test at the 99% confidence level.
Although the AO has little effect on precipitation variability, it is closely related to the long-term temperature trend that dominates the main characteristics of temperature variability in the three arid regions. On the quasi-3-year scale with the second largest variance contribution of temperature, the NAf climate is jointly regulated by the AO and NAO, the NAm climate is affected by the PDO and NAO, while no significant correlation is found between the temperature in the PCA and the four oceanic oscillation indexes.
Spatial distribution characteristics
Figure 11 shows the trend distributions of average temperature throughout the year and in warm season (from May to September) and cold season (from November to the following March) in the three arid regions from 1941 to 2020. As shown in Figure 11A, the warming rates in most middle and high latitudes, including the NAm and PCA, are higher than in low latitudes. In the PCA, the areas with a warming rate of more than 0.2°C (10a)−1 are much more than those of the other two arid regions. The larger-value areas of warming rate in the NAm are located in the western coastal region, while those in the NAf are located in the eastern region. In warm season, although the NAf and Southeast Asia are at the same latitudes, the regional difference in temperature variability is greater (Figure 11B), which may be mainly related to the strong East Asian summer monsoon. In cold season, the middle and high latitudes of Eurasia, including the PCA, are controlled by a strong warming phenomenon, while the warming rates in the other two arid regions are considerably less than those in the warm season (Figure 11C). In other words, in the inland PCA, the contribution of the strong warming effect during cold season to the whole year is far greater than that during the warm season, while the opposite is true for the contribution of the warming effect in the NAm and NAf (near oceans), where the contribution in warm season is greater.
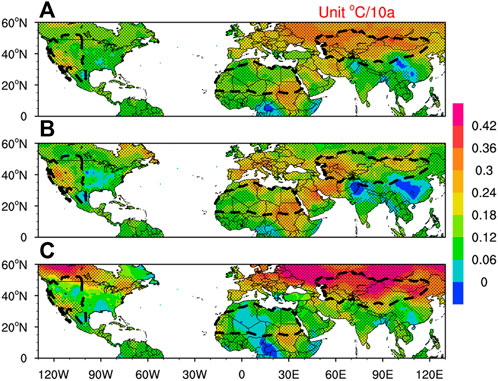
FIGURE 11. Variation rates of temperature in (A) annual, (B) warm season and (C) cold season from 1941 to 2020. The dashed lines outline the study region, and the shaded areas indicate the values passing the significance test at the 95% confidence level.
The response of precipitation to global warming is complex, and there is considerable spatial heterogeneity in precipitation distribution in both arid and non-arid regions (Figure 12). In terms of the interannual distribution, the area with an increasing trend of precipitation is obviously larger in the PCA than that of the two arid regions adjacent to oceans, which is also one of the major reasons for the apparent warming-wetting trend of climate in the PCA in recent years. The precipitation in cold season is more than that in warm season in both the PCA and NAm, while the range with an increasing trend of precipitation in the NAf is slightly larger in warm season than in cold season, which further indicates that the response of precipitation to climate warming is not consistent in different regions and has high complexity. Overall, the precipitation in the mid-latitude arid regions is dominated by cold-season precipitation regardless of whether these regions are near the sea or not. We believe that the intensities and locations of the Siberian high and the North American continental cold high in winter also play a role in local precipitation variability in the PCA and NAm, while the precipitation in the low-latitude arid region has little difference between warm and cold seasons, and the overall precipitation is slightly more in warm season than in cold season.
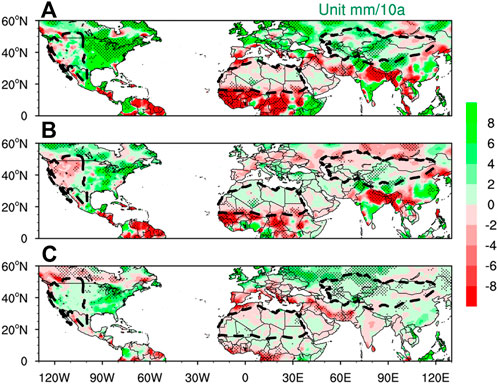
FIGURE 12. Variation rates of precipitation in (A) annual, (B) warm season and (C) cold season from 1941 to 2020. The dashed lines outline the study region, and the shaded areas indicate the values passing the significance test at the 95% confidence level.
Discussion
The previous analysis showed that the precipitation increase alleviates the drought in most regions. However, the “warming-wetting” trend is not equal to “humid climate”. In the context of climate warming, the precipitation extremes increase, with a remarkably uneven distribution. Simultaneously, the PET is enhanced (Figure 7), which offsets most of the precipitation increment. Therefore, the arid and semi-arid climate patterns in the three regions remain unchanged. The PET, as a measure of atmospheric demand for surface water, is crucial to the formation and development of arid climate.
The precipitation variability is dominated by interannual scale, with a quasi-3-year cycle in the three arid regions. The quasi-3-year cycle is the dominant cycle of common and essential signals of atmospheric circulation and climate variabilities on the interannual time scale, and many meteorological elements in the troposphere have this cycle (Liu et al., 2015). It may represent the basic cycle of the mid latitude circulation, which is worthy of further study in the future.
In the positive phase of the SOI, the climate in the PCA and NAm shows an evident drying trend, while that in the NAf shows a wetting trend. In the positive phase of the PDO, the NAm precipitation increases, the East Asian summer monsoon weakens, and thus the precipitation in the monsoon region of northern China decreases (Jiang and Wang, 2005; Dai, 2012a). Due to the seesaw effect of precipitation in the eastern (monsoon region) and western (non-monsoon region) parts of northern China (Zhang et al., 2019), the precipitation in the non-monsoon region of most of the PCA shows an increasing trend. Therefore, the precipitation variability in the PCA and NAm displays the same phase but is opposite to that in the NAf.
This feature is obvious on both interdecadal and multi-decadal time scales of the NAm and NAf shown in Figures 4, 8B,C, probably due to the anti-phase variation of the sea surface temperature between the North Pacific Ocean and the equatorial ocean (Hunt, 2000). This anti-phase variation characteristic of the precipitation is characterized by a cycle of 30–40 years.
The warming-wetting trend in the PCA is gratifying, but the warm-dry type in Nam and NAf since the 21st century deserves more attention. Although the increase of precipitation may be a positive side of this trend, the rise of PET caused by sharp warming may cause greater challenges to the regional climate and ecological environment.
At present, many scholars have used CMIP5, CMIP6 and other models to study the future climate change in arid areas (Zhao and Dai, 2016; Yang et al., 2021). Nevertheless, the estimated results are subject to considerable uncertainty, and the climate in arid areas changes in real time, the comprehensive impacts of elevated temperature and variable precipitation on drought are still unknown. Considering the significant impacts on ecosystems, solving the uncertainty of model predictions should remain a focus of climate modeling in the future.
Conclusion
The climate trend in three arid regions showed dynamic and spatial differences. Since 1941, the precipitation in the PCA and NAm increases at rates of 1.84 mm (10a)−1 and 1.10 mm (10a)−1, respectively, while that in the NAf decreases at a rate of 0.97 mm (10a)−1. The anomaly variation of temperature has a relatively high consistency. In the past 80 years, the temperature in the three regions displays an increasing trend. Specifically, the warming is most noticeable in the PCA, followed by the NAf, and slowest in the NAm.
The climate in the PCA has a continuous wetting trend, with an obviously increased annual average NPD and rainfall amount from the 1990s, indicating the extremes and spatial heterogeneity of the precipitation variability in arid regions. Under the joint influence of the increased precipitation and PET, the AI trend is relatively stable, and the warming-wetting trend slows down. Since 21st century, the NPD in the NAm increases slightly, while the precipitation decreases slightly, but PET increase vastly. The climate in this region shows a wetting trend in the early period and a drying trend in the later period. The NAf is relatively the driest, with the smallest AI amplitude and a relatively stable climate state.
The climates in the three arid regions shift between cold-dry and cold-wet types from the 1940s to the 1980s. After the 1980s, the global climate warms rapidly with accelerated industrialization, and the climate in the PCA shows a warm-wet type that continues to the present. The climate in the NAm is briefly in the warm-wet type, and it turns to a warm-dry type after the 21st century. The NAf climate remains the warm-dry type since the 1990s.
The precipitation variability is dominated by interannual scale, with a quasi-3-year cycle in the three arid regions. The precipitation in the NAm has an anti-phase variability pattern compared with the precipitation in the NAf on both interdecadal and multi-decadal time scales. The PDO has a great influence on the PCA precipitation on the interannual scale, and it controls the precipitation variability in the NAm at different time scales. The NAO mainly affects the quasi-12-year cycle of the PCA precipitation and the quasi-3-year cycle of the NAf precipitation by regulating the strength of the westerly circulation, but it has little effect on the NAm precipitation. Although AO has little effect on precipitation variability, it is closely related to the long-term temperature trend that dominates the main characteristics of temperature variability in the three arid regions.
In the inland arid region, the contribution of strong warming effect during cold season to the whole year is much greater than that during warm season, while the contribution of the coastal arid regions in warm season is greater. The precipitation in the mid-latitude arid regions is dominated by cold-season precipitation regardless of whether these regions are near the sea or not. The precipitation in the low-latitude arid regions has little difference between cold and warm seasons, and the overall precipitation is slightly more in the warm season. However, the precipitation in the low-latitude arid region has little difference between warm and cold seasons, and the overall precipitation is slightly more in warm season than in cold season.
This study only presents a preliminary analysis of some of the characteristics of climate change and its relationship with large-scale oceanic oscillation indexes in the three typical arid regions statistical methods, and did not systematically analyze the role of different factors from multiple perspectives. The comprehensive impacts of elevated PET and variable precipitation on drought are still unknown. The steady rise in precipitation may result in highly non-uniform precipitation distribution, which means more extreme weather may occur. Considering the significant impact of climate change on ecosystems, attacking these problems should remain a focus of climate researching in the future. Furthermore, the reanalysis data contains a certain amount of uncertainty, especially in the arid regions. Reanalysis data and Observational data will be used in a comparative study in the future, and more reliable conclusions will be obtained regarding the mechanisms of the correlations and differences of climate among various arid regions.
Data availability statement
Publicly available datasets were analyzed in this study. This data can be found here: https://crudata.uea.ac.uk/cru/data/hrg/.
Author contributions
Conceptualization, QZ; methodology, XYY and WZ; validation, PC and XMY; formal analysis, XYY; data curation, XYY and XL; writing—original draft preparation, XYY and LW; writing—review and editing, XYY and JH. All authors have read and agreed to the published version of the manuscript.
Funding
This research was funded by the National Natural Science Foundation of China (42230611, 41630426, 42005038), and Drought Meteorological Science Research Fund of Key Laboratory of Arid Climatic Change and Reducing Disaster of Gansu Province (IAM201913).
Conflict of interest
The authors declare that the research was conducted in the absence of any commercial or financial relationships that could be construed as a potential conflict of interest.
Publisher’s note
All claims expressed in this article are solely those of the authors and do not necessarily represent those of their affiliated organizations, or those of the publisher, the editors and the reviewers. Any product that may be evaluated in this article, or claim that may be made by its manufacturer, is not guaranteed or endorsed by the publisher.
References
Allen, R. J., and Anderson, R. G. (2018). 21st century California drought risk linked to model fidelity of the El Niño teleconnection. NPJ Clim. Atmos. Sci. 1 (1), 21. doi:10.1038/s41612-018-0032-x
Bi, S., Sun, L., Li, X., Chen, C., and Lu, Y. (2018). Characteristics of drought and flood disasters in the middle and lower reaches of the Yellow River from 1470 to 1911 based on EEMD method. J. Nat. Disasters. 27 (1), 137–147. doi:10.13577/j.jnd.2018.0117
Cai, W., Wang, G. J., Dewitte, B., Wu, L. X., Santoso, A., Takahashi, K., et al. (2018). Increased variability of eastern Pacific El Niño under greenhouse warming. Nature 564 (7735), 201–206. doi:10.1038/s41586-018-0776-9
Chen, F. H., Huang, W., Jin, L. Y., Chen, J. H., and Wang, J. S. (2011). Spatiotemporal precipitation variations in the arid Central Asia in the context of global warming. Sci. China Earth Sci. 54 (12), 1812–1821. doi:10.1007/s11430-011-4333-8
Dai, A. (2012a). Increasing drought under global warming in observations and models. Nat. Clim. Chang. 3 (1), 52–58. doi:10.1038/nclimate1633
Dai, A. (2012b). The influence of the inter-decadal Pacific oscillation on US precipitation during 1923–2010. Clim. Dyn. 41 (3-4), 633–646. doi:10.1007/s00382-012-1446-5
Dai, A., Trenberth, K. E., and Karl, T. R. (1998). Global variations in droughts and wet spells: 1900-1995. Geophys. Res. Lett. 25 (17), 3367–3370. doi:10.1029/98gl52511
Dai, A., and Zhao, T. B. (2016). Uncertainties in historical changes and future projections of drought. Part I: Estimates of historical drought changes. Clim. Change 144, 519–533. doi:10.1007/s10584-016-1705-2
Feng, S., and Fu, Q. (2013). Expansion of global drylands under a warming climate. Atmos. Chem. Phys. 13 (19), 10081–10094. doi:10.5194/acp-13-10081-2013
Giannini, A., Saravanan, R., and Chang, P. (2003). Oceanic forcing of Sahel rainfall on interannual to interdecadal time scales. Science 302 (5647), 1027–1030. doi:10.1126/science.1089357
Greve, P., Orlowsky, B., Mueller, B., Sheffield, J., Reichstein, M., and Seneviratne, S. I. (2014). Global assessment of trends in wetting and drying over land. Nat. Geosci. 7 (10), 716–721. doi:10.1038/ngeo2247
Gu, G., and Adler, R. F. (2015). Spatial patterns of global precipitation change and variability during 1901–2010. J. Clim. 28 (11), 4431–4453. doi:10.1175/jcli-d-14-00201.1
Guan, X. D., Jieru, M. A., Huang, J. P., Huang, R. X., Zhang, L., and Ma, Z. G. (2019). Impact of oceans on climate change in drylands. Sci. China Earth Sci. 62, 891–908. doi:10.1007/s11430-018-9317-8
Harris, I., Osborn, T. J., Jones, P., and Lister, D. (2020). Version 4 of the CRU TS monthly high-resolution gridded multivariate climate dataset. Sci. Data 7 (1), 109. doi:10.1038/s41597-020-0453-3
Hu, Z. Y., Zhou, Q. M., Chen, X., Qian, C., Wang, S. S., and Li, J. F. (2017). Variations and changes of annual precipitation in Central Asia over the last century. Int. J. Climatol. 37, 157–170. doi:10.1002/joc.4988
Huang, J., Guan, X., and Ji, F. (2012). Enhanced cold-season warming in semi-arid regions. Atmos. Chem. Phys. 12 (2), 5391–5398. doi:10.5194/acp-12-5391-2012
Huang, J. P., Ji, M. X., Xie, Y. K., Wang, S. S., He, Y. L., and Ran, J. J. (2015). Global semi-arid climate change over last 60 years. Clim. Dyn. 46 (3-4), 1131–1150. doi:10.1007/s00382-015-2636-8
Hunt, B. G. (2000). Natural climatic variability and Sahelian rainfall trends. Glob. Planet. Change 24 (2), 107–131. doi:10.1016/S0921-8181(99)00064-8
Infanti, J. M., and Kirtman, B. P. (2016). North American rainfall and temperature prediction response to the diversity of ENSO. Clim. Dyn. 46 (9), 3007–3023. doi:10.1007/s00382-015-2749-0
Jiang, D. B., and Wang, H. J. (2005). Natural interdecadal weakening of East Asian summer monsoon in the late 20th century. Chin. Sci. Bull. 50 (17), 1923–1929. doi:10.1360/982005-36
Liu, Y. Y., Hu, Z. Z., Kumar, A., Peng, P. T., Collins, D. C., and Jha, B. (2015). Tropospheric biennial oscillation of summer monsoon rainfall over East Asia and its association with ENSO. Clim. Dyn. 45, 1747–1759. doi:10.1007/s00382-014-2429-5
Liu, Y. Z., Wu, C. Q., Jia, R., and Huang, J. P. (2018). An overview of the influence of atmospheric circulation on the climate in arid and semi-arid region of Central and East Asia. Sci. China Earth Sci. 61 (09), 1183–1194. doi:10.1007/s11430-017-9202-1
Ma, Z. G., Fu, C. B., and Dan, L. (2005). Decadal variations of arid and semi-arid boundary in China. Chin. J. Geophys. 48 (3), 574–581. doi:10.1002/cjg2.690
Mann, H. B. (1945). Non-parametric tests against trend. Econometrica 13 (3), 245–259. doi:10.2307/1907187
McCabe, G. J., Palecki, M. A., and Betancourt, J. L. (2004). Pacific and Atlantic Ocean influences on multidecadal drought frequency in the United States. Proc. Natl. Acad. Sci. U. S. A. 101 (12), 4136–4141. doi:10.1073/pnas.0306738101
Sheffield, J., Wood, E. F., and Roderick, M. L. (2012). Little change in global drought over the past 60 years. Nature 491 (7424), 435–438. doi:10.1038/nature11575
Trenberth, K. E., Branstator, G. W., and Arkin, P. A. (1988). Origins of the 1988 north American drought. Science 242 (4886), 1640–1645. doi:10.1126/science.242.4886.1640
Trenberth, K. E., Dai, A., van der Schrier, G., Jones, P. D., Barichivich, J., Briffa, K. R., et al. (2014). Global warming and changes in drought. Nat. Clim. Chang. 4 (1), 17–22. doi:10.1038/nclimate2067
Vicente-Serrano, S. M., Garcia-Herrera, R., Barriopedro, D., Azorin-Molina, C., Lopez-Moreno, J. I., Martin-Hernandez, N., et al. (2016). The Westerly Index as complementary indicator of the North Atlantic oscillation in explaining drought variability across Europe. Clim. Dyn. 47 (3-4), 845–863. doi:10.1007/s00382-015-2875-8
Wu, Z. H., and Huang, N. E. (2009). Ensemble empirical mode decomposition: A noise-assisted data analysis method. Adv. Adapt. Data Anal. 1, 1–41. doi:10.1142/S1793536909000047
Xu, B. L., Yang, Q., and Ma, Z. G. (2017). Decadal characteristics of global land annual precipitation variation on multiple spatial scales. Chin. J. Atmos. Sci. 41 (3), 593–602. doi:10.3878/j.issn.1006-9895.1608.16174
Yan, X. Y., Zhang, Q., Ren, X. Y., Wang, X. Y., Yan, X. M., Li, X. Q., et al. (2022). Climatic change characteristics towards the “warming-wetting” trend in the pan-central-asia arid region. Atmosphere 13 (3), 467. doi:10.3390/atmos13030467
Yan, X. Y., Zhang, Q., Yan, X. M., Wang, S., Ren, X. Y., and Zhao, F. N. (2019). An overview of distribution characteristics and formation mechanisms in global arid areas. Adv. Earth Sci. 34 (8), 826–841. doi:10.11867/j.issn.1001-8166.2019.08.0826
Yan, X. Y., Zhang, Q., Zhang, W. B., Ren, X. Y., Wang, S., and Zhao, F. N. (2021). Analysis of climate characteristics in the Pan-Central-Asia arid region. Arid. Zone Res. 38, 1–11. doi:10.13866/j.azr.2021.01.01
Yang, J. H., Zhang, Q., Lu, G. Y., Liu, X., Wang, Y., Wang, D. W., et al. (2021). Climate transition from warm-dry to warm-wet in eastern northwest China. Atmosphere 12, 548. doi:10.3390/atmos12050548
Zeng, N., and Yoon, J. (2009). Expansion of the world’s deserts due to vegetation-albedo feedback under global warming. Geophys. Res. Lett. 36 (17), L17401. doi:10.1029/2009gl039699
Zhang, H. L., Zhang, Q., Yue, P., Zhang, L., Liu, Q., Qiao, S. B., et al. (2016). Aridity over a semi-arid zone in northern China and responses to the East Asian summer monsoon. J. Geophys. Res. Atmos. 121, 13901–13918. doi:10.1002/2016JD025261
Zhang, J., Chen, H., and Zhang, Q. (2018). Extreme drought in the recent two decades in northern China resulting from Eurasian warming. Clim. Dyn. 52 (5-6), 2885–2902. doi:10.1007/s00382-018-4312-2
Zhang, Q., Han, L. Y., Jia, J. Y., Song, L. L., and Wang, J. S. (2015). Management of drought risk under global warming. Theor. Appl. Climatol. 125 (1-2), 187–196. doi:10.1007/s00704-015-1503-1
Zhang, Q., Lin, J. J., Liu, W. C., and Han, L. Y. (2019). Precipitation seesaw phenomenon and its formation mechanism in the eastern and Western parts of Northwest China during the flood season. Sci. China Earth Sci. 62, 2083–2098. doi:10.1007/s11430-018-9357-y
Zhang, Q., Wang, S., Yang, F. L., Yue, P., Yao, T., and Wang, W. Y. (2014). Characteristics of dew formation and distribution, and its contribution to the surface water budget in a semi-arid region in China. Bound. Layer. Meteorol. 154, 317–331. doi:10.1007/s10546-014-9971-x
Zhang, Q., Xu, C. Y., Zhang, Z., Chen, Y. D., and Liu, C. L. (2009). Spatial and temporal variability of precipitation over China, 1951–2005. Theor. Appl. Climatol. 95, 53–68. doi:10.1007/s00704-007-0375-4
Zhang, Q., Yang, J. H., Duan, X. Y., Ma, P. L., Lu, G. Y., Zhu, B., et al. (2022). The eastward expansion of the climate humidification trend in northwest China and the synergistic influences on the circulation mechanism. Clim. Dyn. 59, 2481–2497. doi:10.1007/s00382-022-06221-4
Keywords: arid regions, climate change, comparison, multiple time scales, ensemble empirical mode decomposition (EEMD)
Citation: Yan X, Cheng P, Zhang Q, Li X, He J, Yan X, Zhao W and Wang L (2022) Comparisons of climate change characteristics in typical arid regions of the Northern Hemisphere. Front. Environ. Sci. 10:1033326. doi: 10.3389/fenvs.2022.1033326
Received: 31 August 2022; Accepted: 21 October 2022;
Published: 01 November 2022.
Edited by:
Hongbo Ling, Xinjiang Institute of Ecology and Geography (CAS), ChinaReviewed by:
Jinjian Li, Chengdu University of Information Technology, ChinaHaijun Deng, Fujian Normal University, China
Copyright © 2022 Yan, Cheng, Zhang, Li, He, Yan, Zhao and Wang. This is an open-access article distributed under the terms of the Creative Commons Attribution License (CC BY). The use, distribution or reproduction in other forums is permitted, provided the original author(s) and the copyright owner(s) are credited and that the original publication in this journal is cited, in accordance with accepted academic practice. No use, distribution or reproduction is permitted which does not comply with these terms.
*Correspondence: Qiang Zhang, zhangqiang@cma.gov.cn