 Tao Shi1,2
 Yuanjian Yang
- 1Wuhu Meteorological Bureau, Wuhu, China
- 2School of Earth and Space Sciences, University of Science and Technology of China, Hefei, China
- 3Key Laboratory of Atmospheric Sciences and Satellite Remote Sensing of Anhui Province, Anhui Institute of Meteorological Sciences, Hefei, China
- 4Collaborative Innovation Centre on Forecast and Evaluation of Meteorological Disasters, School of Atmospheric Physics, Nanjing University of Information Science and Technology, Nanjing, China
The effect of urbanization on surface air temperature (SAT) is one of the most important systematic biases in SAT series of urban stations. Correcting this so-called urbanization bias has the potential to provide accurate basic data for long-term climate change monitoring and research. In the western region of the Yangtze River Delta, 42 meteorological stations with site-relocation history from 2009 to 2018 were selected to analyze the statistical characteristics of the differences in comparative site-relocation daily average SAT. The annual average differences in comparative site-relocation SAT series between the old and the new stations (SATDON) were used to characterize the impact of urbanization bias on the air temperature observation series. Using remote sensing technology, spatial datasets of land-use, landscape, and geometric parameters of the underlying surface in the 5-km buffer zone around the station were established as the observed environmental factors of the site, and the differences in these observed environmental factors (DOEFs) between the old and the new stations were calculated to indicate the change induced by urbanization. Next, multiple linear regression models of SATDON and DOEFs were constructed, showing that the error range of the model for simulated SATDON was 3.66–18.21%, and the average error was 10.09%. Finally, this new correction method (NCM) and conventional correction method (CCM) were applied to the correction of the urbanization bias of SAT series at Hefei station. After comparison, it is found that the NCM could reveal clear contributions of the rapid and slow stages of the urbanization process and resultant environmental changes around the stations to the observed SAT. In summary, the NCM based on remote sensing technology can more reasonably and effectively correct the urbanization bias caused by local human activities, as well as reduce the error caused by the selection of reference stations via the conventional correction method.
Introduction
Urbanization directly affects the types of land use/cover and anthropogenic heat emissions around meteorological stations, leading to major changes in the observation environment (Gallo et al., 1996; Peterson, 2006; Trusilova et al., 2008; Chen et al., 2020), which in turn has an important impact on the accuracy, representativeness, and homogeneity of meteorological observation data (Davey and Sr, 2005; Vose, 2005). The contribution of the so-called urbanization bias (the effect of urbanization on surface air temperature (SAT), the list of abbreviations used in this article and their expanded names can be found in Appendix A) to meteorological observation data usually stems from changes in the observation environment against the background of urbanized areas (Ren et al., 2017). The urbanization bias is the largest systematic bias in SAT observation records in China and correcting this bias has the potential to provide accurate basic data for large-scale climate change monitoring and research (Wen et al., 2019b).
Urbanization bias has received a great deal of attention in the literature (Hansen et al., 2001; Fujibe, 2009; Zhang, 2009; Zhang, 2014; Wen et al., 2019a). Zhang (2009) used the method of subtracting the warming trend of rural stations from the warming trend of urban stations to correct the regional average SAT series of urban stations and obtained the regional average SAT series after removing the urbanization bias. Fujibe (2009) divided the meteorological stations in Japan into six categories in terms of the population density within a certain radius around the city station and corrected the urbanization bias in the third–sixth-category sites using the first and second types of stations as reference stations. Hansen et al. (2001) corrected the urbanization bias of one typical station by utilizing the two-stage linear trend based on the assumption that the SAT increased linearly in two periods. Zhou et al. (2019) pointed occurrence probability of the heatwave events in summer over the Yangtze River Delta is closely related to the contribution of urbanization effect. These imply that the correction method of urbanization bias is very crucial to explore accurately the regional climate change.
However, the conventional correction method (CCM) of urbanization bias still has some shortcomings as follows: 1) many studies have utilized the population density or city size as the criteria for classifying meteorological stations. For example, Bai and Ren (2006) chose meteorological stations with a population of more than 100,000 as urban stations, but Liu (2006) divided the stations with a population of more than 40,000 and the stations that were not described as “rural” into urban stations. However, there have also been some studies that have utilized satellite remote sensing data to select reference stations, such as Zhang. (2014), who visually selected the stations outside the closed contour as reference stations in the temperature field retrieved from remote sensing data. Thus, it can be seen that there is no unified standard for the selection of reference stations, and it is difficult to find a pure reference station near the urban station as reference stations are inevitably affected by urbanization, so the urbanization bias in the SAT series is the minimum estimate (Zhang, 2014). 2) Previous studies corrected the SAT series based on the assumption that the urbanization bias presents a linear increase trend (Hansen et al., 2001; Zhang, 2009). However, in reality, the urbanization processes at different times and in different regions are variable, so it is impossible to subdivide the specific degree of contribution of the urbanization bias to the SAT series on temporal and spatial scales. In addition, there are considerable differences in the mechanisms and magnitudes of the impact of urbanization on different temperature elements (Li et al., 2014), despite the possibly limited contribution to regional warming (Chao et al., 2020), while its impact on extreme temperatures are huge (Li and Huang, 2013; Li et al., 2014; Zhou et al., 2019).
In order to improve the representativeness of the observation environment of meteorological stations, many stations with severely damaged observation environments have been relocated. Taking 2015 as an example, 92 meteorological observation stations across the country were relocated in this year alone (Meteorological Observation Centre of CMA, 2013; Comprehensive Observation Department of China Meteorological Administration, 2015). According to the requirements of “the criterion of surface meteorological observation,” “protection methods for meteorological exploration environment and facilities,” and other documents formulated and issued by China Meteorological Administration, site selection has a series of strict restrictions on factors such as altitude, distance, and obstacles. The area around the relocated station should be dominated by open vegetation, and the representativeness of the meteorological observation environment must have been greatly improved. Meteorological observation series can represent the climate background of the region (Yang et al., 2013; Yang et al., 2017), so relocated stations can be used as relatively pure reference stations. In addition, “the criterion of surface meteorological observation” stipulates that the relocation of meteorological stations must involve the carrying out of at least one year of comparative observations between the new site and the old site, and the difference in comparative site-relocation annual average SAT between the old and the new stations (SATDON) provides high-quality data for us to study the impact of urbanization bias on the SAT series. Therefore, SATDON can reduce the error caused by the selection of reference stations via the traditional urban–rural comparison method.
The meteorological observation environment refers to the environmental space constituted by the minimum distance necessary to avoid various interferences and ensures that the facilities of the meteorological observation station accurately obtain the meteorological observation information. With the rapid development of remote sensing technology, the use of satellite data to study changes in the meteorological environment has become an emerging method (Yang et al., 2013; Li et al., 2015; Shi et al., 2015). Yang et al. (2013) evaluated the observation environment by using land use/cover and normalized difference vegetation index (NDVI) in the buffer zone around the meteorological station. Li et al. (2015) quantitatively studied the relationship between land use/cover change (LUCC) and the thermal environment in the buffer zone and subdivided the stations into three types by the contribution index of the thermal environment. The above researches show that it is feasible to utilize satellite data to investigate and study the observation environment, and it has the advantages of visualization and remodeling. However, existing remote sensing research on the observation environment only uses indicators such as LUCC and NDVI and does not fully consider the impact of the spatial pattern and configuration of different land-use types on the observation environment. Consequently, this study uses remote sensing technology to establish land-use parameters, landscape parameters, geometric parameters, and other spatial datasets around meteorological stations to characterize the differences in observation environment factors (DOEFs) between the old and the new stations and analyzes and discusses the physical mechanisms by which urbanization bias influences the SAT series.
The Yangtze River Delta (YRD) urban agglomeration is one of the most highly urbanized areas in China for the past 30 years (National Bureau of Statistics, 2019). However, the development of Anhui in the western region of the YRD has been relatively slow, having not developed rapidly until the past 10 years. Therefore, the observation environments of national meteorological stations in Anhui Province have been seriously damaged in the past 10 years, and a large number of stations have been forced to relocate on a frequent basis (Meteorological Observation Centre of CMA, 2013; Comprehensive Observation Department of China Meteorological Administration, 2015), and this provides us with an opportunity to study the process of urbanization and station relocation. In summary, taking Anhui Province as the research area, meteorological stations with site-relocation history were selected in this study, and the SATDON results between the old and the new stations were used to characterize the impact of urbanization bias on the SAT series. Landscape parameters, geometric parameters, and other spatial datasets in the 5 km buffer zone around the stations were established to characterize the DOEFs between the old and the new stations, and statistical models of the SATDON and DOEFs were constructed. This paper corrected the urbanization bias of the SAT series at a typical station by the new method and the conventional method, respectively, and the advantages of the new method were discussed finally.
Data and Methods
Data
1) Ground observation data. The SAT data mainly include national reference climatological stations, which observe 8 times a day (once every 3 h); national basic meteorological station, which observes four times a day [02:00, 08:00, 14:00, and 20:00 BT (Beijing time)]; national general meteorological stations, which observe three times a day (08:00, 14:00, and 20:00 BT) and obtain the daily-averaged SAT by calculating the arithmetic mean of the temperature values observed for each time per day.
2) Satellite remote sensing data. The remote sensing data used in this study were Landsat data from the United States’ EOS (Earth Observation System) for the detection of earth resources and the environment. Specifically, this study uses the remote sensing images of the Landsat-7/ETM+ (Yao et al., 2010) and Landsat-8/OLI (Saputra et al., 2017) sensors to study the changes in the observation environment of the stations relocated before 2013 and after 2013, respectively. A comparison of the band information of the above two remote sensing images is given in Table 1.
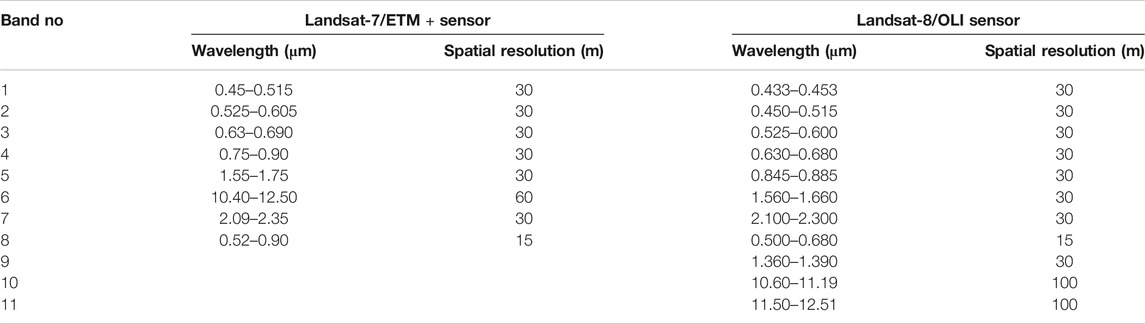
TABLE 1. Comparison of band information between the Landsat-7/ETM+ and Landsat-8/OLI sensors.
Methods
Selecting Samples for Relocated Stations
For this study, we selected meteorological stations with site-relocation history as the research samples from 2009 to 2018, according to the historical evolution data and comparative observation data of the relocated stations, surveys and evaluation reports of the observation environment of the national ground meteorological stations, and high-resolution satellite remote sensing images. The selection criteria were as follows: 1) the main reason for the relocation was that the observation environment of the station had been seriously damaged; 2) in order to minimize the influence of the difference of regional and local climate background, the difference in altitude between the sites (before and after relocation) was less than 50 m, and a horizontal distance between the sites of 20 km was selected according to previous studies (Wen et al., 2019; Shi et al., 2011); 3) there was no significant difference in topography; and 4) the type of observation instrument, the frequency of daily observations, and daily mean methods of temperature series did not change before and after station relocation. Based on the above criteria, 42 samples of relocated stations were selected, as shown in Figure 1. The relocated station samples include 25 urban stations and 17 reference stations, according to the meteorological station classification method of Ren et al. (Ren et al., 2010), and the samples were evenly distributed throughout northern Anhui, the Yangtze–Huaihe region, Yangtze River area, southern Anhui, and other regions. Therefore, the samples in this study can represent the impact of the urbanization development level of different regions in Anhui Province on different types of stations.
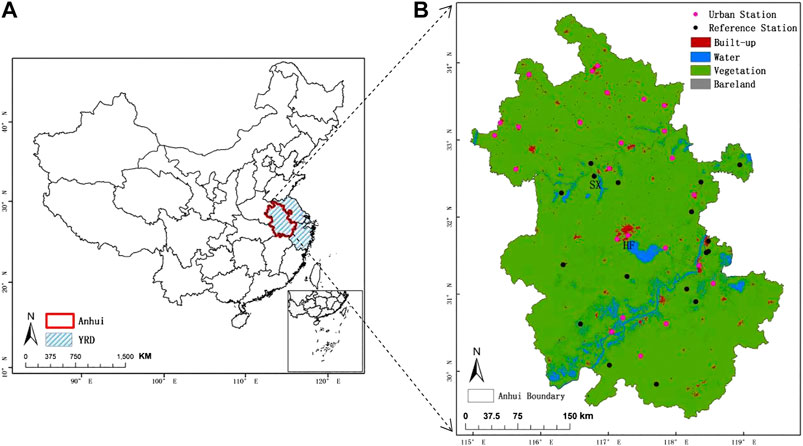
FIGURE 1. (A) Location of Anhui in the western region of the YRD in China. (B) Land use/cover maps and the spatial distribution of the relocated station samples in Anhui Province from 2009 to 2018.
Determining the Research Range of the Station Buffer Zone
Studies (Cai, 2008; Yang et al., 2013; Shi et al., 2015; Yang et al., 2020a) have shown that since the observation height of the thermometer shelter in the observation field is 1.5 m, the maximum impact of urbanization on the observation data usually does not exceed 5 km under advection and turbulence transport conditions. Therefore, for this study, we selected a station buffer zone with a center radius of 5 km to quantitatively study the impact of environmental changes on the SAT series.
Establishing a Dataset of Characterization Parameters of the Observation Environment in the Buffer Zone
Land-use parameters (Carolina et al., 2013) reflect the results of various land resource utilization activities produced by human beings, which are an important part of urban environmental change research. This study uses the supervised classification method to classify land use in ENVI software and establishes four parameter indicators: built-up area ratio (ARBT), water area ratio (ARW), vegetation area ratio (ARV), and bare land area ratio (ARB).
The landscape parameters mainly include the largest patch index (LPI) (Wu, 2000) and the mean fractal dimension (FRAC_MN) (Wu, 2000) of the land type. The LPI represents the dominant land type in the study area. The larger the LPI value, the more obvious the advantage of this type of patch in the overall landscape. The FRAC_MN represents the index of the patch shape. The larger the FRAC_MN, the more complex the shape of the patch and the more discrete the patch distribution. For this study, eight parameter indicators were calculated in the landscape index software Fragstats, including the built-up largest patch index (LPIBT), water largest patch index (LPIW), vegetation largest patch index (LPIV), bare land largest patch index (LPIB), built-up mean fractal dimension (FRAC_MNBT), water mean fractal dimension (FRAC_MNW), vegetation mean fractal dimension (FRAC_MNV), and bare land mean fractal dimension (FRAC_MNB).
The geometric parameters mainly include the distance between the stations and the gravity centers of different land types in the buffer zone, and the distance between the station and the city center (Liu et al., 2014). For this study, we used ArcGIS software to extract the land types of “built-up,” “water,” “vegetation,” and “bare land” in the station buffer zone, then used the “Calculate Geometry” function to obtain the gravity centers of the different land types, and finally, the “Point Distance” function could then be used to calculate four parameter indicators, including the distance between the station and the gravity center of built-up land (DISBT), water (DISW), vegetation (DISV), and bare land (DISB). In the same way, the parameter indicator of the distance between the station and the city center (DISC) could be obtained in the ArcGIS software.
The current urbanization bias correction scheme still has deficiencies, mainly due to the limited assessment indicators for local observation environment around meteorological stations. Landscape ecological morphology (Figure 2) can be used to explore the relationship between the spatial pattern of urban land use and urban local microclimate (Zhou et al., 2011; Estoque et al., 2017). Landscape composition can distinguish land-use types, and landscape configuration can fully consider the respective geographic characteristics of different land-use types. In addition to the conventional land-use assessment indicators, therefore, our present work employs landscape ecological indicators and geometric indicators to assess observation environment around station. Finally, based on correlation analysis, six indicators, that is, ARBT, ARW, LPIBT, LPIW, DISBT, and DISW, were finally selected.
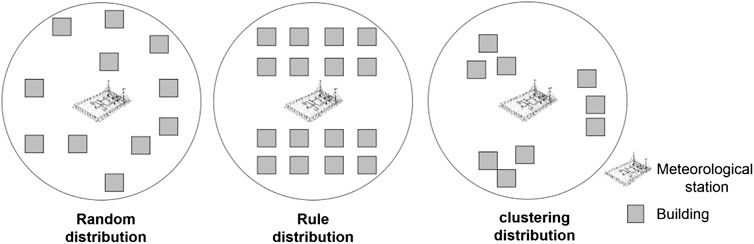
FIGURE 2. Schematic diagram of the landscape pattern around the station.
Simulation and Correction Method for the Urbanization Bias in the SAT Series
This article starts with the physical causes of the impact of urbanization bias on the observation environment and simulates the degree of impact of the urbanization bias on the SAT series by constructing statistical models of SATDON and DOEFs. Multiple linear regression is a statistical analysis method to determine the quantitative relationship between a dependent variable and multiple independent variables (Lynn, 2007; Li, 2020). Assuming there is a linear correlation between the dependent variable Y and the k independent variables X1, X2,..., Xk, then the functional relationship between Y and X can be expressed as:
where β is the regression constant; β1, β2, …, βk are the regression coefficients; and ε is the regression residual.
After substituting the land-use, landscape, and geometric parameters in the buffer zone around the station into Eq. 1, the simulated values of the changes in the SAT series could be obtained, and then the urbanization bias could be corrected by the simulated values:
Here, i is the year number from the earliest year of recording to the latest year of correcting, T′i is the annual average SAT after correction in the ith year (°C), and ΔTi is the change in the annual average SAT series caused by urbanization bias in the ith year compared with the earliest observation year (°C).
Results
Case Analysis of a Typical Station
Hefei National Meteorological Observation Station had been completely surrounded by built-up land before relocation because of the process of urbanization in recent years (Figure 3); the observational environment score of Hefei station was only 63.2. After relocation, Hefei station moved 30.2 km to the northwest of the old site, with an altitude difference of 6.0 m, and the observation environment of the station greatly improved, with the score increased to 99.3.
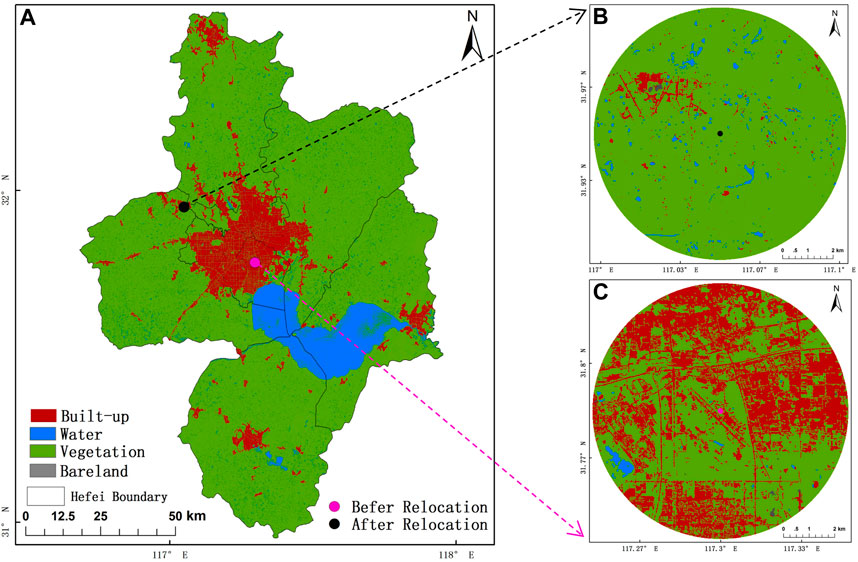
FIGURE 3. (A) Location of Hefei station relative to Hefei city before and after relocation. (B) LUCC in the 5-km buffer zone of Hefei station after relocation. (C) LUCC in the 5-km buffer zone of Hefei station before relocation.
Table 2 shows the DOEFs between the old and the new stations in the 5-km buffer zone. ARBT decreased from 42.17 to 4.23% after relocation, indicating that the area of built-up land around the station was greatly reduced; the FRAC_MNBT declined to a certain extent, indicating that the distribution of built-up patches around the station was more concentrated than before relocation; and DISBT increased from 0.53 to 3.13km, indicating that the built-up land type had weakened the urbanization impact of the station after relocation. The parameters of water, vegetation, and bare land also improved to varying degrees. In addition, the SATDON in 2018 showed that the annual average SAT of the new station (Figure 3B) was 0.83°C lower than the old station (Figure 3C) and the decline reached 4.8%. In summary, the representativeness of the observation environment at Hefei station improved after relocation, and the SATDON could represent the degree of the impact of the urbanization bias on the SAT series.
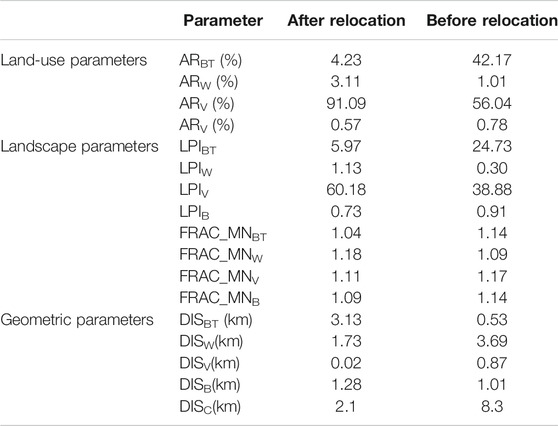
TABLE 2. DOEFs in the 5-km buffer zone of Hefei station after and before relocation.
Analyzing the Statistical Characteristics of the Samples’ Daily Average Differences
For this section, daily-averaged SATDON series were close to a normal distribution and fluctuated in the range of −2.3–4.4°C (Figure 4). The sample size, mean, and standard deviation were 15,347, 0.572, and 0.568°C (Table 3), respectively. The above statistics showed that the sample had a large variation range, but the data distribution was mainly concentrated near the mean value, and the overall sample volatility was relatively small. The kurtosis value of the sample was 2.057, the number of samples with a daily-averaged SATDON of 0.4°C was the largest, reaching 1,515, and the number of samples with a daily-averaged SATDON at 0.2–0.8°C reached 9,193, accounting for 59.6% of the total number of samples, indicating that the daily-averaged SATDON series was steeper than the normal distribution. The sample skewness value was 0.673, and the number of daily-averaged SATDON values greater than the mean was 8,226, accounting for 53.6% of the total sample and indicating that there were more points on the right-hand side of the data distribution, close to the mean.
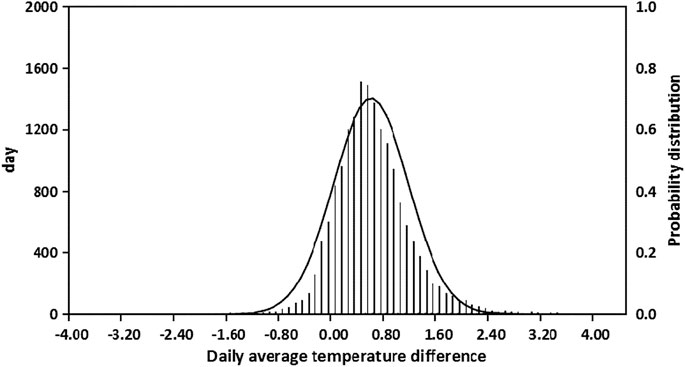
FIGURE 4. Probability density distribution of the DCSSATda of samples.

TABLE 3. Statistics of the DCSSATda of samples.
In addition, there were 828 negative values in the sample, accounting for 5.39% of the total number of samples, which means that the SAT series of the old stations were lower than the new sites (Figure 4). The influence of the meteorological station observation environment on the SAT series was more complicated. Buildings cause the wind speed to decay downwind and reduce air circulation in the observatory, thereby enhancing the locality of temperature observation. However, under unstable stratification conditions during the daytime, the shadowing effect of solar radiation caused by buildings and aerosol cooling effects might make the SAT observed by the stations surrounded by buildings lower than the stations with open terrain (Li et al., 2011; Zheng et al., 2018; Zheng et al., 2020; Yang et al., 2020b).
Correlation Analysis of SATDON and DOEFs
A total of 37 samples were selected from the relocation samples to analyze the correlation between SATDON and DOEFs, and existing buffer parameters were filtered in order to establish a revised model of urbanization deviation in the next step. Figure 5 presents the statistical significance test results and correlation coefficient histogram between the SATDON and DOEFs, in which the solid bars represent the significance level of the correlation reaching 0.05, while the hollow bars represent the opposite.
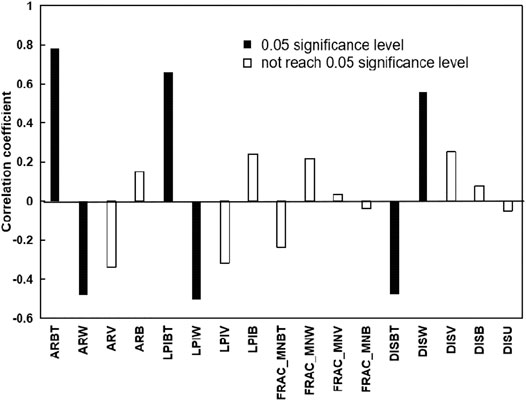
FIGURE 5. Statistical significance test results and correlation coefficient histogram between SATDON and DOEFs.
SATDON had a significant positive correlation with ARBT after relocation, and the correlation coefficient reached 0.7843, which passed the significance level of 0.05. SATDON and ARW showed a significant negative correlation, with a correlation coefficient of −0.4819, which also passed the significance level of 0.05. This showed that with the continuous increase in built-up land around the meteorological station, the decrease in heat capacity of the underlying surface and the increase in anthropogenic heat in the buffer zone led to warming in the SAT series. The heat capacity of water bodies is relatively large, meaning heat in the buffer zone of a station could be taken away as water evaporates, which would lead to a drop in the SAT series (Zeng et al., 2010). In addition, the SATDON also had a high correlation with LPIBT, LPIW, DISBT, and DISW after relocation, which showed that the more obvious the advantages in the buffer landscape and the closer the distance of the station to the built-up center of gravity, the greater the SATDON, while for water this was opposite. Accordingly, this article uses six indicators (ARBT, ARW, LPIBT, LPIW, DISBT, and DISW) to study the response SATDON to the change in the DOEF in the buffer zone.
Simulation and Accuracy Evaluation of Urbanization Bias in the Annual Average SAT Series
The parameter indicators in the buffer zone have undergone great changes after relocation. As shown in Figure 6, the change values in the proportion of built-up area (ΔARBT) of all the relocation samples were positive, which shows that the area of built-up land around the relocated stations was reduced and 92.18% of the ΔARBT values were concentrated in the range of 0–50%. The number of stations with a negative change value in water area ratio (ΔARw) reached 22, which showed that the water area of most stations increased after relocation. The change values of the built-up LPI (ΔLPIBT) of all the relocation samples were positive, and 92.18% of the ΔLPIBT values were concentrated in the range of 0–20. The number of stations with a negative change value of water LPI (ΔLPIW) also reached 22, which showed that the water advantage of most stations increased after relocation. All the change values of the distance between the station and the built-up center of gravity (ΔDISBT) were negative, which showed that all samples of relocated stations were far away from the center of gravity of built-up patches. The change value of the distance between the station and the built-up center of gravity (ΔDISBT) was negative, revealing that all samples of relocated stations were far away from the center of gravity of built-up patches. The number of stations with a positive change value of the distance between the station and the water center of gravity (ΔDISw) reached 24, which showed that most samples of relocated stations were close to the center of gravity of built-up patches.
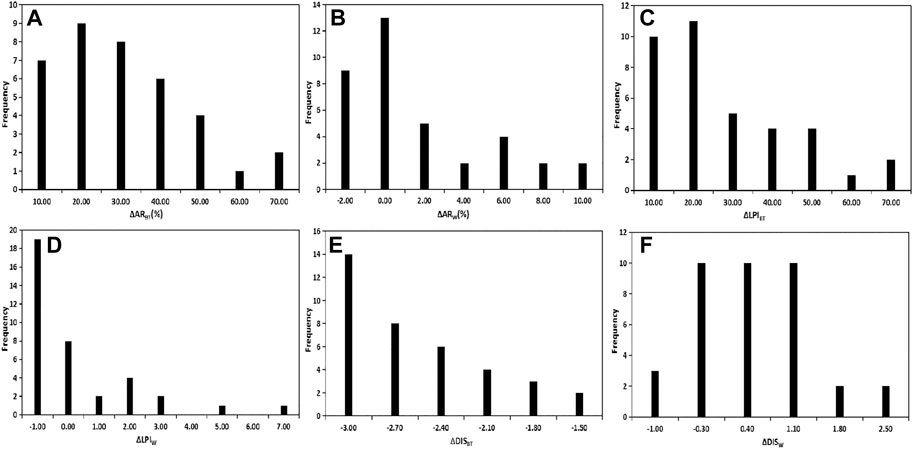
FIGURE 6. DOEFs between the old and the new stations in the 5-km buffer zone: (A) ΔARBT; (B) ΔARW; (C) ΔLPIBT; (D) ΔLPIW; (E) ΔDISBT; and (F) ΔDISW.
For this part of the study, we used statistics to analyze the response relationship between the SATDON and DOEFs and simulate the impact of the urbanization bias on the SAT series. The sample was subjected to colinearity diagnosis in SPSS; the statistical models of SATDON and DOEFs were constructed finally:
Here, ΔTavg is the annual averaged SATDON of meteorological stations. Table 4 shows coefficient of determination (R2) for stepwise regression of the fitted model. With the increase of independent variable, the R2 of the model increases. The R2 of the fitting model finally reached 0.953, which passed the 0.05 significance test, indicating that the above five influencing factors have a crucial impact on SATDON.
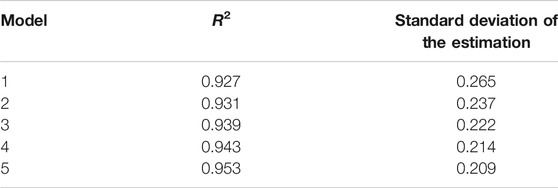
TABLE 4. Coefficient of determination (R2) for stepwise regression of the fitting model.
According to Eq. 3, the change values of the annual average SAT of the remaining five relocated stations in the sample were simulated to compare with the real change value of the sample. As shown in Table 5, the difference between the simulated and real value fluctuates in the range of 0.014–0.108°C. The simulation error range is 3.66–18.21%, and the average error is 10.09%.
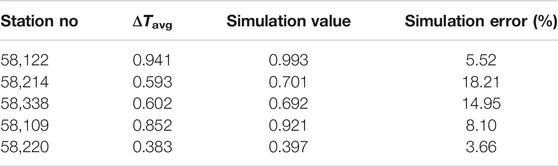
TABLE 5. Accuracy evaluation of urbanization bias in the average SAT series.
Discussion
The conventional correction method (Zhang, 2009; Zhang, 2014; Wen et al., 2019a) involves gradually decreasing the annual average urbanization impact from the earliest year of the target station series. The corrected series represents the regional annual average SAT series in which the urbanization bias has been removed:
Here, i is serial number from the earliest year of recording to the latest year of correcting, T′i is the annual average SAT after correction in the ith year (°C), Ti is the annual average SAT before correction in the ith year (°C), and ΔTu-r is the difference in the SAT warming rate between the urban and reference station (°Cdecade−1). It should be noted that Eq. 4 has an assumption that the urbanization bias shows a linear growth trend.
For this part of the study, we take the annual average SAT series of Hefei station from 1953 to 2018 (homogenization correction was carried out to remove discontinuities or jumping points caused by the relocation) as an example to discuss the correction of the urbanization bias. The ΔTu-r of Hefei station was 0.065°Cdecade−1 with Shouxian station selected as the reference station (see Figure 1).
Because remote sensing images before the 1950s are not easy to obtain, and the observation environments of meteorological stations were basically unaffected by urbanization, we set the initial value of the various parameters in the station buffer zone in the earliest record year to be 0.
We used the new correction method based on remote sensing to correct the urbanization bias of Hefei station. According to the development process of Hefei’s urbanization, the remote sensing image of six times (1979, 1987, 1998, 2004, 2009, and 2018) covering the Hefei area was selected (Figure 7). The five parameters of ARBT, ARW, LPIW, DISBT, and DISW were interpreted and substituted into Eq. 3 to obtain the change values of the annual average SAT series, and then the urbanization bias was corrected using Eq. 2. In addition, we also used the CCM to correct the urbanization bias of Hefei station in the above the remote sensing image of six times, and the results obtained by the CCM and NCM methods were compared and analyzed.
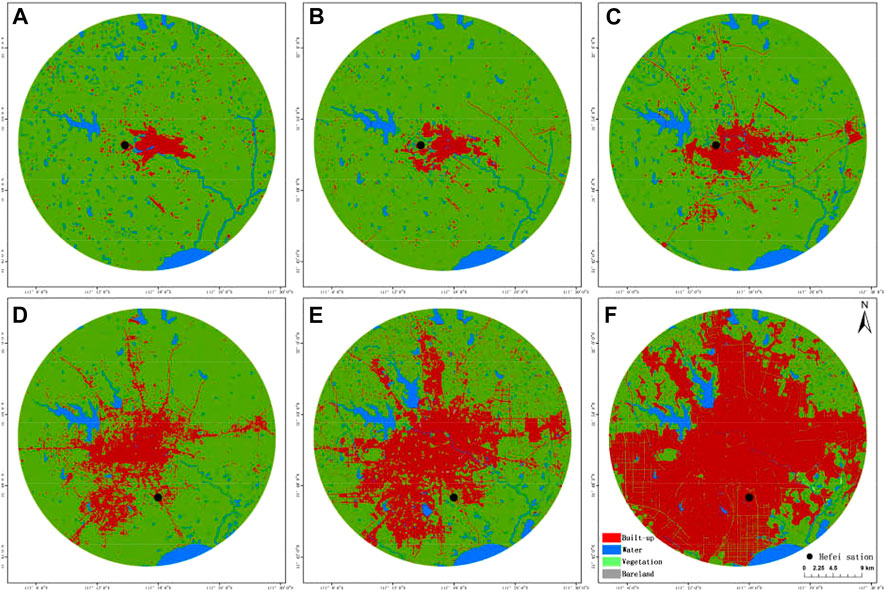
FIGURE 7. Land use of Hefei city in the 20-km buffer zone and the location of Hefei station: (A) 1979; (B) 1987; (C) 1998; (D) 2004; (E) 2009; and (F) 2018.
The correction results obtained by the CCM were higher than those of the NCM (Table 6). The CCM did not take into account the impact of the urbanization bias on the reference station, and therefore, the urbanization bias obtained from the reference station was the minimum estimate.
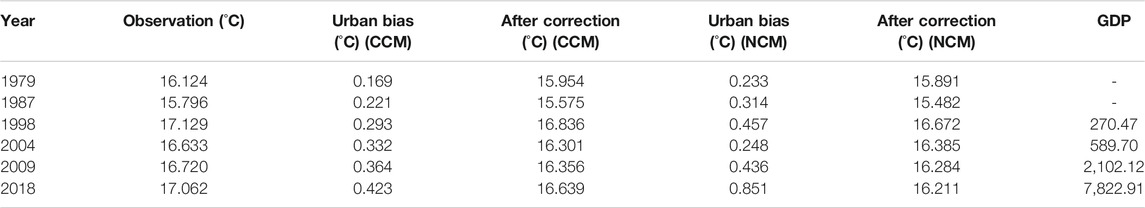
TABLE 6. Comparison of results between the CCM and NCW at Hefei station.
The rate of urban development in Hefei was relatively slow before 2004. From 2004 to 2018, the total GDP of Hefei increased by ¥723.321 billion, with an annual average growth rate of 81.77%, and its economic growth rate ranked first in the YRD region (National Bureau of Statistics, 2019). The warming rate in the SAT series caused by the urbanization bias should change with economic development, but the warming rate at Hefei station obtained by the CCM was a fixed value (0.065°Cdecade−1), and this assumption that the impact of urbanization increases linearly year by year over time is questionable (Zhang, 2009). The results of the NCM show that the urbanization bias of Hefei station increased gradually from 0.233 to 0.457°C from 1979 to 1998. Due to the relocation of Hefei station in 2004, the observation environment improved significantly, and the NCM-based urbanization bias between 2004 and 2009 did not increase much, but the CCM-based urbanization bias was increasing over time because station relocation was not taken into account. The urbanization bias of Hefei station increased quickly from 0.436 to 0.851°C as the city experienced rapid development from 2009 to 2018. The NCM constructed in this study produces results that are dynamically consistent with the observation environment of the station and the development of the city. In summary, the present work study mainly focused on the sample application exploration of our new urbanization bias correction method, which can make up for the shortcomings of the conventional linear method. We will find more relocation stations in the whole Yangtze River Delta region to extend our new method application in the future.
Based on the R2 of the fitted results (Table 4), it is clear that all the selected parameters can explain more than 90% of the urbanization bias. In addition, urbanization is not only reflected by the two-dimensional horizontal urban expansion but also by the vertical morphology of the three-dimensional urban spatial structure. Previous studies suggested that the vertical geometry of urban canopy building also had an impact on local microclimate (Oke, 2004; Bonacquisti et al., 2006; Chen et al., 2020). In the future, we will expand three-dimensional indicators to supply the indicators of urbanization bias correction.
Conclusion
In this study, we selected 42 meteorological stations with site-relocation history in the western region of the YRD from 2009 to 2018 as research example samples and then utilized annual SATDON series between the old and the new stations to characterize the impact of the urbanization bias on SAT series. We proposed a new method for correcting urbanization-induced bias in surface air temperature observations based on comparative site-relocation data. The main conclusions are as follows.
Spatial land-use, landscape, and geometric parameters of the underlying surface in the 5-km buffer zone around the station were good to be as the DOEFs of the site. The comparative analysis revealed that parameters such as ARBT, ARW, LPIBT, LPIW, DISBT, and DISW in DOEFs had the highest correlation with SATDON, with absolute values of correlation coefficients exceeding 0.4, passing the 0.05 significance test. After colinearity diagnosis, a new linear regression model between five parameters (ARBT, ARW, LPIW, DISBT, and DISW) and SATDON was finally constructed to correct urbanization bias, which clearly reflected the effects of rapid and slow phases of urbanization and environmental changes around the site on the observed SAT. The CCM did not take into account that the reference station was affected by the urbanization, which may underestimate urbanization bias. In addition, CCM cannot consider the station relocation situation, which may overestimate urban bias when the station relocated. In contrast, the NCM constructed in this study can make up these shortcomings to correct the urbanization bias caused by local human activities more reasonably and effectively and can also reduce the error caused by the selection of reference stations in the traditional urban–rural comparison method.
Data Availability Statement
The original contributions presented in the study are included in the article/Supplementary Material, and further inquiries can be directed to the corresponding author.
Author Contributions
TS: methodology, formal analysis, results and discussion, and writing—original draft preparation; DS, discussion, and writing reviewing and editing; YH, discussion, and writing reviewing and editing; GL, discussion, and writing reviewing and editing; YY: conceptualization, data curation, methodology, results and discussion, and writing—reviewing and editing.
Conflict of Interest
The authors declare that the research was conducted in the absence of any commercial or financial relationships that could be construed as a potential conflict of interest.
Acknowledgments
This study was supported by the National Key R and D Program of China (Fund No: 2018YFC1506502), NSFC-DFG (42061134009) and the Beijing Natural Science Foundation (8202022 and 8171002). The data that support the findings of this study are openly available. The Meteorological Information Center of the China Meteorological Administration provided the meteorological data (http://data.cma.cn/site/index.html); and the remote sensing data used in this study were Landsat data from the United States’ EOS (Earth Observation System) refined by Department of Earth System Science/Institute for Global Change Studies Tsinghua University (http://data.ess.tsinghua.edu.cn/).
Abbreviations
AR, area ratio; CCM, conventional correction method of urbanization bias correction; DIS, distance between the station and the gravity center of various lands; DOEFs, differences in these observed environmental factors; FRAC_MN, mean fractal dimension; LPI, largest patch index; LUCC, land use/cover change; NCM, new correction method of urbanization bias correction; NDVI, normalized difference vegetation index; SAT, surface air temperature; SATDON, differences in comparative site-relocation SAT series between the old and the new stations; YRD, Yangtze River Delta.
References
Bai, Z. H., and Ren, G. Y. (2006). The effect urban heat island on change of regional mean temperature in Gansu Province, China. Plateau Meteorol. 25 (1), 91–94. doi:10.1016/S1003-6326(06)60040-X
Bonacquisti, V., Casale, G. R., Palmieri, S., and Siani, A. M. (2006). A canopy layer model and its application to Rome. Sci. Total Environ. 364 (4), 1–13. doi:10.1016/j.scitotenv.2005.09.097 |
Cai, X. H. (2008). Footprint analysis in micrometeorology and its extended applications. Chin. J. Atmos. Sci. 32, 123–132. doi:10.3878/j.issn.1006-9895.2008.01.11
Carolina, A., Tatiana, P., and Ferreira, R. (2013). The conservation success over time: evaluating the land use and cover change in a protected area under a long re-categorization process. Land Use Policy 30 (1), 177–185. doi:10.1016/j.landusepol.2012.03.004
Chao, L., Huang, B., Yuanjian, Y., Jones, P., Cheng, J., Yang, Y., et al. (2020). A new evaluation of the role of urbanization to warming at various spatial scales: evidence from the Guangdong‐Hong Kong‐Macau region, China. Geophys. Res. Lett. 47 (20), e2020GL089152. doi:10.1029/2020GL089152
Chen, G., Wang, D., Wang, Q., Li, Y., Wang, X., Hang, J., et al. (2020). Scaled outdoor experimental studies of urban thermal environment in street canyon models with various aspect ratios and thermal storage. Sci. Total Environ. 726, 138147. doi:10.1016/j.scitotenv.2020.138147 |
Comprehensive Observation Department of China Meteorological Administration (2015). Basic information change table of national surface meteorological observation station. Beijing, China: China Meterological Administration.
Davey, C. A., and Sr, A. P. (2005). Microclimate exposures of surface-based weather stations: implication for the assessment of long-term temperature trends. Bull Amer. Meteorol. Soc. 86 (4), 497–504. doi:10.1175/BAMS-86-4-497
Estoque, R. C., Murayama, Y., and Myint, S. W. (2017). Effects of landscape composition and pattern on land surface temperature: an urban heat island study in the megacities of Southeast Asia. Sci. Total Environ. 577, 349–359. doi:10.1016/j.scitotenv.2016.10.195 |
Fujibe, F. (2009). Detection of urban warming in recent temperature trends in Japan. Int. J. Climatol. 29 (12), 1811–1822. doi:10.1002/joc.1822
Gallo, K. P., Easterling, D. R., and Peterson, T. C. (1996). The influence of land use/land cover on climatological values of the diurnal temperature range. J. Clim. 9 (11), 2941–2944. doi:10.1175/1520-0442(1996)009<2941:tioluc>2.0.co;2
Hansen, J., Ruedy, R., Sato, M., Imhoff, M., Lawrence, W., Easterling, D., et al. (2001). A closer look at United States and global surface temperature change. J. Geophys. Res. 106 (D20), 23947–23963. doi:10.1029/2001JD000354
Li, Q., and Huang, J. (2013). Effects of urbanization on extreme warmest night temperatures during summer near Bohai. Acta Meteorol. Sin 27 (6), 808–818. doi:10.1007/s13351-013-0602-0
Li, Q., Huang, J., Jiang, Z., Zhou, L., Chu, P., and Hu, K. (2014). Detection of urbanization signals in extreme winter minimum temperature changes over northern China. Clim. Change 122, 595–608. doi:10.1007/s10584-013-1013-z
Li, Q. (2020). Statistical modeling experiment of land precipitation variations since the start of the 20th century with external forcing factors. Chin. Sci. Bull. 65 (21), 2266–2278. doi:10.1360/TB-2020-0305
Li, X., Guo, J. X., and Jin, L. J. (2011). The effect of meso-scale environment on temperature in Huang-Huai-Hai plain area. J. Appl. Meteorol. Sci. 22 (6), 740–746. doi:10.1016/B978-0-444-53599-3.10005-8
Li, Y.-B., Shi, T., Yang, Y.-J., Wu, B.-W., Wang, L.-B., Shi, C.-E., et al. (2015). Satellite-based investigation and evaluation of the observational environment of meteorological stations in Anhui Province, China. Pure Appl. Geophys. 172 (6), 1735–1749. doi:10.1007/s00024-014-1011-8
Liu, J., Kuang, W., Zhang, Z., Xu, X., Qin, Y., Ning, J., et al. (2014). Spatiotemporal characteristics, patterns, and causes of land-use changes in China since the late 1980s. J. Geogr. Sci. 24 (1), 195–210. doi:10.1007/s11442-014-1082-6
Liu, Y. L. (2006). A preliminary analysis of the influence of urbanization on precipitation change trend in north China. Lanzhou, China: Lanzhou University.
Liu, Y. L., Ren, G. Y., Zhang, G. Y., and Yu, H. (2018). Response of surface air temperature to micro-environmental change: results from mohe parallel observation experiment. Meteorol. Sci. Tech. 46 (2), 215–223. doi:10.19517/j.1671-6345.20170200
Lynn, E. E. (2007). Multiple linear regression. Methods Mol. Biol. 404, 165–187. doi:10.1007/978-1-59745-530-5_9 |
Meteorological Observation Centre of CMA (2013). Investigation and evaluation report on detection environment of national surface meteorological observation station and aerological station. Beijing, China: China Meterological Administration.
National Bureau of Statistic (2019). China statistical yearbook. Beijing, China: China Statistics Press, 107–153.
Oke, T. R. (2004). Initial guidance to 0btain representative meteorological observations at urban sites. Geneva, Switzerland: World Meteorological Organization.
Peterson, T. C. (2006). Examination of potential biases in air temperature caused by poor station locations. Bull. Amer. Meteorol. Soc. 87, 1073–1080. doi:10.1175/BAMS-87-8-1073
Ren, G., Ding, Y., and Tang, G. (2017). An overview of mainland China temperature change research. J. Meteorol. Res. 31 (1), 3–16. doi:10.1007/s13351-017-6195-2
Ren, G., Li, J., Ren, Y., Chu, Z., Zhang, A., Zhou, Y., et al. (2015). An integrated procedure to determine a reference station network for evaluating and adjusting urban bias in surface air temperature data. J. Appl. Meteorol. Climatol. 54 (6), 1248–1266. doi:10.1175/JAMC-D-14-0295.1
Ren, G. Y., Zhang, A. Y., Chu, Z. Y., et al. (2010). Principles and procedures for selecting reference surface air temperature stations in China. Meteorol. Sci. Tech. 38 (1), 78–85. doi:10.3969/j.issn.1671-6345.2010.01.015
Saputra, A. N., Danoedoro, P., and Kamal, M. (2017). Application of Landsat 8 OLI image and empirical model for water trophic status identification of riam kanan reservoir, banjar, south kalimantan. IOP Conf. Ser. Earth Environ. Sci. 98 (1), 012020. doi:10.1088/1755-1315/98/1/012020
Shi, T., Huang, Y., Wang, H., Shi, C.-E., and Yang, Y.-J. (2015). Influence of urbanization on the thermal environment of meteorological station: satellite-observed evidence. Adv. Clim. Change Res. 6, 7–15. doi:10.1016/j.accre.2015.07.001
Shi, T., Yang, Y. J., and Jiang, Y. L. (2011). Impact of the variation of urban heat island intensity on temperature series in Anhui Province. Climatic Environ. Res. 16 (6), 779–788. doi:10.3878/j.issn.1006-9585.2011.06.13
Trusilova, K., Jung, M., Churkina, G., Karstens, U., Heimann, M., and Claussen, M. (2008). Urbanization impacts on the climate in europe: numerical experiments by the PSU-NCAR mesoscale model (MM5). J. Appl. Meteorol. Climatol. 47 (5), 1442–1455. doi:10.1175/2007JAMC1624.1
Vose, R. S. (2005). Reference station networks for monitoring climatic change in the conterminous United States. J. Clim. 18 (24), 5390–5395. doi:10.1175/JCLI3600.1
Wen, K. M., Ren, G.-Y., Li, J., and Ren, Y. (2019a). Adjustment of urbanization bias in surface air temperature over the mainland of China. Prog. Geogr. 38 (4), 600–611. doi:10.18306/dlkxjz.2019.04.012
Wen, K., Ren, G., Li, J., Zhang, A., Ren, Y., Sun, X., et al. (2019b). Recent surface air temperature change over mainland China based on an urbanization-bias adjusted dataset. J. Clim. 32 (10), 2691–2705. doi:10.1175/JCLI-D-18-0395.1
Wu, J. G. (2000). Landscape ecology, pattern, process, scale and grade. Beijing, China: Higher Education Press, 107–115.
Yang, Y., Zhang, M., Li, Q., Chen, B., Gao, Z., Ning, G., et al. (2020a). Modulations of surface thermal environment and agricultural activity on intraseasonal variations of summer diurnal temperature range in the Yangtze River Delta of China. Sci. Total Environ. 736, 139445. doi:10.1016/j.scitotenv.2020.139445 |
Yang, Y., Zheng, Z., Yim, S. H. L., Roth, M., Ren, G., Gao, Z., et al. (2020b). PM2.5 Pollution Modulates Wintertime Urban-Heat-Island Intensity in the Beijing-Tianjin-Hebei Megalopolis, China. Geophys. Res. Lett. 47 (1). doi:10.1029/2019gl084288 |
Yang, Y.-J., Wu, B.-W., Shi, C.-E., Zhang, J.-H., Li, Y.-B., Tang, W.-A., et al. (2013). Impacts of urbanization and station-relocation on surface air temperature series in Anhui Province, China. Pure Appl. Geophys. 170 (11), 1969–1983. doi:10.1007/s00024-012-0619-9
Yang, Y. j., Wang, L. B., and Huang, Y. (2017). Impact of urbanization on meteorological observation and its environment representativeness: a case study of shouxian national climate station. Meteorol. Sci. Tech. 45 (1), 7–13. doi:10.19517/j.1671-6345.20160062
Yao, W., Han, M., and Xu, S. (2010). Estimating the regional evapotranspiration in zhalong wetland with the two-source energy balance (TSEB) model and Landsat7/ETM+ images. Ecol. Inform. 5 (5), 348–358. doi:10.1016/j.ecoinf.2010.06.002
Zeng, Y. N., Zhang, S. J., and Zhang, H. H. (2010). Study on urban heat island effects and its associated surface indicators. Remote Sensing Tech. Appl. 25 (1), 1–7. doi:10.3724/SP.J.1087.2010.02819
Zhang, A. Y. (2009). Identifying and correcting urban bias for surface air temperature series. Beijing, China: China Academy of Meteorological Sciences.
Zhang, Y. (2014). Assessment and correction of urban bias in surface air temperature series of eastern China over time period 1913-2012. Beijing, China: China Academy of Meteorological Sciences.
Zheng, Z. F., Ren, G. Y., Wang, H., Dou, J. X., Gao, Z. Q., Duan, C. F., et al. (2018). Relationship between Fine Particle Pollution and the Urban Heat Island in Beijing, China: Observational Evidence. Bound. Layer Meteorol. 169 (1), 93–113. doi:10.1007/s10546-018-0362-6
Zheng, Z., Zhao, C., Lolli, S., Wang, X., Wang, Y., Ma, X., et al. (2020). Diurnal Variation of Summer Precipitation Modulated by Air Pollution: Observational Evidences in the Beijing Metropolitan Area. Environ. Res. Lett. 15 (9). doi:10.1088/1748-9326/ab99fc
Zhou, C., Wang, K., Qi, D., and Tan, J. (2019). Attribution of a record-breaking heatwave event in summer 2017 over the Yangtze River Delta. Bull. Am. Meteorol. Soc. 100, S97–S103. doi:10.1175/bams-d-18-0134.1
Keywords: surface air temperature series, urbanization bias, remote sensing technology, relocation, correction method
Citation: Shi T, Huang Y, Sun D, Lu G and Yang Y (2021) A New Method for Correcting Urbanization-Induced Bias in Surface Air Temperature Observations: Insights From Comparative Site-Relocation Data. Front. Environ. Sci. 9:625418. doi: 10.3389/fenvs.2021.625418
Received: 03 November 2020; Accepted: 09 February 2021;
Published: 30 April 2021.
Edited by:
Qingxiang Li, Sun Yat-Sen University, ChinaReviewed by:
Xuchao Yang, Zhejiang University, ChinaChunlüe Zhou, University at Albany, United States
Copyright © 2021 Shi, Huang, Sun, Lu and Yang. This is an open-access article distributed under the terms of the Creative Commons Attribution License (CC BY). The use, distribution or reproduction in other forums is permitted, provided the original author(s) and the copyright owner(s) are credited and that the original publication in this journal is cited, in accordance with accepted academic practice. No use, distribution or reproduction is permitted which does not comply with these terms.
*Correspondence: Yuanjian Yang, yyj1985@mail.ustc.edu.cn