- 1Guizhou Power Grid Co., Ltd., Guiyang, China
- 2China Southern Power Grid Electric Power Research Institute, Guangzhou, China
As the global environmental pollution problem intensifies, the carbon reduction transformation of the power system is urgent. In order to solve the problem of unclear carbon flow and distribution in the operation of the power grid, as well as the mismatch between static time-of-use electricity prices and peak and valley periods in the scheduling of electric vehicle charging loads, a multiperiod dynamic electricity price guidance strategy based on carbon emission flow theory is proposed. First, based on the accurate power flow results of the power system, a complex power distribution matrix of the power system is constructed to obtain the distribution of the power generated by the generator units in each node of the network. Then, the Monte Carlo random sampling method is used to simulate the load situation of electric vehicles in a disordered charging state. A mathematical model based on the carbon trading model is established to minimize the load difference at the grid end and maximize the cost of charging on the user side. Finally, the proposed ordered charging method with a multiperiod dynamic electricity pricing strategy is compared with unordered charging, and considering the participation of electric vehicles in carbon trading, this strategy effectively reduces the peak valley difference between the power grid and user charging costs.
1 Introduction
In recent years, industrial development has led to an increase in carbon emissions, energy shortages, and increasingly serious environmental problems (Chen et al., 2021). The massive emissions of greenhouse gases and continuous climate change have become severe challenges facing the world. According to statistics, the total carbon dioxide emissions of the whole world in 2023 will reach 40.6 billion tons. The carbon emissions of China’s power industry account for approximately 40% of all energy carbon emissions (Yang et al., 2023; Pan et al., 2022). The power industry faces great challenges. There is an urgent need to develop clean energy and construct a new type of power system to reduce environmental pollution (Zhang et al., 2022a).
Electric vehicles (EVs), as a low-carbon and environmentally friendly means of transportation, have developed rapidly in terms of scale and technology in recent years. The integration technology of electric vehicles into the grid is becoming more and more mature. The penetration rate of electric vehicles is constantly increasing (Rahbari et al., 2016; Baharin and Abdullah, 2013). Its spatiotemporal distribution characteristics and the randomness and uncertainty of EV user charging behavior will also increase the scheduling pressure on the power grid. Subsequently, it will lead to the phenomenon of “peak on peak” (Ma et al., 2013). In response to this phenomenon, it is necessary to adopt appropriate incentive measures and policies to guide the orderly charging of electric vehicles. This can achieve demand-side management of the power grid and reduce user charging costs. Among them, incentive policies based on electricity prices are common demand-side management methods. Currently, such policies mainly include time-of-use electricity prices and real-time electricity price policies. However, using time-of-use electricity prices as an incentive can lead to overresponse of electric vehicles, resulting in new peak valley differences (Wang et al., 2018); Under the guidance of real-time electricity prices, electric vehicles may experience fatigue in response, resulting in new peak load ratios (Shi et al., 2019). Based on the above phenomenon, a dynamic time-of-use electricity price incentive method is proposed. The method divides the electricity price into multiple levels according to the net load size and implements different incentive forces for different net load sizes.
Chinese scholars first proposed using a virtual network flow to depict the carbon emission flow of various nodes and branches in the power system. Zhou Tianrui et al.’s “Theoretical exploration of carbon emission flow analysis in power systems” summarized the calculation methods of carbon emission flow in power systems (Zhou et al., 2012a; Zhou et al., 2012b; Zhou et al., 2012c). They analyzed the relationship between carbon emissions flow and power flow calculation. The distribution characteristics in the power grid were also determined. Their work established a theoretical foundation for carbon flow tracking methods in power systems. Based on the theory of carbon emission flow, Yuan Shulin et al.’s “Research on carbon emission allocation model based on carbon emission flow theory of power system” considered three aspects: plant electricity consumption, network loss, and electricity load (Yuan and Ma, 2014). A carbon emission property allocation model was established. Through this model, we can analyze the carbon emission allocation of the system in a simple, clear, and fair manner. Based on the power flow tracking theory, Li Weiwei et al.’s “Principles and models for regional allocation of carbon emissions from electricity” established a regional electricity carbon emission allocation model (Weiwei et al., 2012). They proposed a reasonable regional carbon emission allocation strategy and achieved an optimized allocation of regional carbon emission rights. Kang Chongqing et al.’s “Recursive algorithm for carbon emissions in power systems” proposed the concept of node carbon potential (Kang et al., 2017). They proposed a recursive algorithm for carbon emission flow in power systems based on the theory of system node carbon potential balance. The method improved the accuracy and reliability of carbon flow calculation. Wang et al. (2022) introduced a power flow distribution matrix to improve the accuracy of carbon emission tracking in the power system.
The above studies are all based on the active power flow situation of the system for carbon emission calculation. However, they do not consider the impact of reactive power. In actual networks, reactive power can impact system voltage network losses and indirectly affect the distribution of active power in the system. Ultimately, it will affect the carbon flow distribution in the power system. Yu et al. (2014) established a complex power flow tracking model that considers the indirect carbon emissions caused by reactive power. However, the model cannot intuitively reflect the degree of impact of reactive power on carbon emissions.
Scholars have conducted extensive research on the participation of electric vehicles in power grid optimization scheduling (Fathabadi, 2017; Seungwook et al., 2017; Ayman and Salaman, 2014; Haoming et al., 2023). Pantos (2012) fully considers the characteristics of EV charging and discharging and optimizes the time-of-use charging pricing model. It can effectively improve the new energy consumption capacity. Li et al. (2017) point out that carbon emissions are a key issue of concern in today’s power grid. Introducing carbon trading into cogeneration systems and constructing a trading model can help reduce carbon emissions. Clement et al. (2010), Yin et al. (2023), and Zhang et al. (2022b) use the electricity price mechanism as the sole incentive to guide the response of electric vehicles. Cui et al. (2021) introduced carbon trading into the optimization scheduling of electric vehicles. Simulation verified that electric vehicles with carbon quotas participating in the optimization scheduling both reduce user costs and achieve the goal of carbon reduction. Zheng et al. (2020) apply the idea of game theory. They established a master-slave game model between agents and car owners in intelligent communities, achieving a balance of interests among multiple agents. However, there are few literature studies on incentivizing and guiding the charging behavior of electric vehicles through dynamic electricity prices and scheduling the spatiotemporal distribution of EV charging loads based on node carbon potential of carbon emission flow to achieve economic and carbon emission optimization.
The main issues are as follows. The carbon flow and distribution during the operation of the power grid is unclear. The impact of carbon flow distribution on the carbon emissions of scheduled EV charging has not been thoroughly researched. The static time-of-use electricity prices and peak and valley periods are mismatched. The focus is on studying the trend-tracking model based on carbon emission flow theory. We can adjust the incentive policies of dynamic time-of-use electricity prices and carbon emission quotas. The moderate response of EV charging behavior is guided and optimized. In this way, we can reduce the charging cost and carbon emissions of electric vehicles.
The introduction of this article first analyzes the current development status of electric vehicles, the policies of time-of-use electricity prices, and the existing problems. It also includes the research status of carbon emission flow theory and its practical application in the power system. This article is proposed as a response to the above issues. The first part proposes a carbon flow tracking method based on the complex power distribution matrix. It clarifies the carbon flow accompanying the unit output and the source of electricity used by the load through carbon flow tracking. The second part proposes a method for formulating dynamic time-of-use electricity prices for electric vehicles. By using dynamic electricity prices, the electricity prices can be more reasonably matched with actual load peaks and valleys, guiding EV charging. The third part establishes a low-carbon scheduling model for electric vehicles. This part considers carbon quotas and dynamic electricity prices and analyzes the solving process, objective function, and constraint conditions of this model. The fourth part conducts a simulation analysis through four examples, comparing the charging costs and carbon reduction effects of electric vehicles under different strategies. The fifth part summarizes the entire text and draws conclusions.
2 Carbon flow tracking method based on a complex power distribution matrix
2.1 Carbon flow tracking
The flow of carbon emissions in the power grid is transmitted along the lines of power flow. We first analyze the power flow of the system and then calculate the carbon emissions of the nodes.
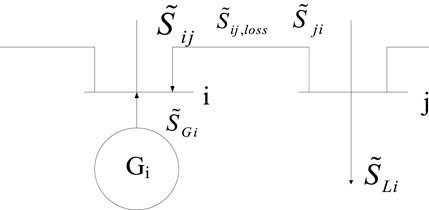
The complex power flow of branch
When the active power on branch
The total power of the incoming node is equal to the total power of the outgoing node, so the complex power of node
In the equation,
By transforming Equation 2, we can obtain:
In the equation,
The above equation can be rewritten into matrix form, which can be expressed as
In the equation: for the n-node system,
The elements in matrix A are as follows:
When i = j,
Decomposing the complex power
In the equation:
For branch
By tracking the flow of the branch, the carbon flow rate in branch
In the equation:
According to the load flow tracking method, the carbon flow rate of load k can be obtained as
In the equation,
Because the objects of the power generation and consumption links in the power system are represented by nodes, exploring the carbon emissions on nodes is of great significance for evaluating the carbon emissions of the entire power system and formulating emission reduction policies. The carbon potential of a node is the ratio of the total carbon flow rate flowing into the node to the active power flowing through the node, representing the carbon emissions generated by the consumption of a unit of electricity by the node. When each section is calculated, the carbon potential of each node in the power system helps obtain the carbon emission levels of each node. Limiting and reducing the carbon potential of nodes with higher carbon potential can effectively reduce the carbon emissions of the power system. The calculation method is as follows:
In the equation:
2.2 Analysis of the carbon flow tracking process
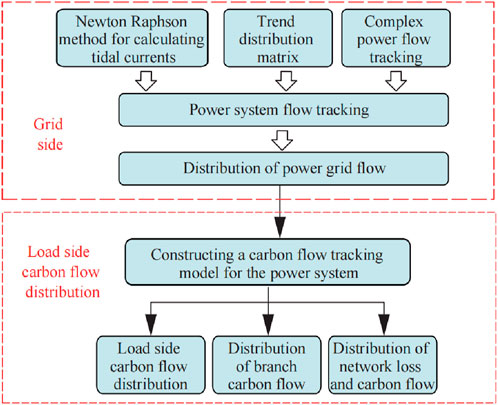
The previous text analyzed the electricity–carbon relationship in the power system. It is of great significance to reasonably share the carbon emissions generated on the power generation side with the load side. The framework for joint tracking of electricity and carbon in the power system is shown in Figure 2. The carbon emissions flow in the power system depends on the system power flow; therefore, the prerequisite for tracking the carbon flow in the power system is to accurately calculate the power flow distribution of the system. First, the Newton–Raphson method is used to calculate the power flow distribution of each node and branch in the system. Based on the complex power flow tracking method, a complex power distribution matrix is established to accurately track the power flow situation in the power system and obtain the power flow distribution in the power grid. Second, historical power generation data of the generator set are collected to construct a carbon emission model for the generator set. Finally, based on the distribution of system power flow and the carbon emissions of generator units, a carbon flow tracking model for the power system is constructed to analyze the total carbon flow of each load and branch in the system, as well as the carbon emission components of each generator unit. The carbon emissions of the power system can be tracked using the methods delineated in this study, laying the foundation for low-carbon scheduling and carbon emission data collection in the power system.
Carbon emission flow is associated with active power flow. The carbon emissions and carbon intensity in the power system can be calculated from the power generation process. They can also be counted and calculated based on electricity consumption in the electricity consumption process. The two are linked through the carbon emission flow of the power grid.
3 Method for formulating dynamic time-of-use electricity prices for electric vehicles
3.1 Establishing an EV charging load model
Based on the charging characteristics of EV power batteries and the distribution pattern of EV user behavior characteristics, Monte Carlo sampling is used to simulate the travel distance, state of charge (SOC) state, and required charging amount of electric vehicles, laying a foundation for subsequent scheduling of EV charging at different times and nodes.
3.1.1 Charging characteristics of power batteries
At present, the main type of automotive power batteries in China is ternary lithium batteries. The charging process is a two-stage mode of “constant current constant voltage.” In the early charging stage, the current remains unchanged, and the voltage continuously increases, reaches a predetermined value, remains constant, and then the charging current continuously decays to a fixed value. The starting and ending stages are relatively brief, and the entire charging process can be considered as a constant power characteristic charging process.
The state of charge (SOC) of a battery can be calculated using Equation 11:
In the equation,
According to the report on new energy vehicles, various types of new energy vehicles in China still mainly rely on slow charging, accounting for 80% of the total charging frequency. Therefore, this article mainly considers the charging load of EVs under slow charging conditions. The calculation of charging time for electric vehicles is shown in Equation 12:
In the equation:
3.1.2 User behavior characteristics
Electric vehicles replace fuel-powered vehicles. Therefore, traditional fuel-powered vehicle user travel methods can be used to consider user travel characteristics (Wang and Infield, 2018). This article assumes that the usage habits of EV users are consistent with those of ordinary fuel vehicle users. The data on household car usage behavior patterns were processed by referring to the 2017 national car travel data analysis in the United States. The daily driving mileage of EV users was approximately processed to satisfy a log-normal distribution. The probability density function is shown in Equation 13:
In the equation,
The travel and return times of private cars also follow a normal distribution, and the probability density function of travel time is shown in Equation 14:
In this equation,
The probability density function of the return time can be expressed as Equation 15:
In this equation,
3.1.3 Monte Carlo simulation
Usually, the charging behavior of an isolated EV is uncertain and difficult to predict and cannot be combined with any probability distribution. However, as the number of electric vehicles increases and the range gradually scales, the charging behavior will follow a certain probability distribution that can be randomly simulated. Monte Carlo simulation (MCS) combines probability theory to perform statistical analysis on variables in an event, fit the probability distribution function, and then sample to generate approximate data that satisfy the distribution. Further analysis is then performed on these approximate data to make judgments about the event.
Assuming that the user charges the electric vehicle from the moment they return home, the Monte Carlo sampling steps are as follows.
1) Based on the statistical data referenced earlier, set the factors that will affect the charging behavior.
2) Random sampling is performed using the MCS method to initialize the parameters.
3) Input the relevant parameters into the calculation to determine the charging duration.
4) Add up the number of electric vehicles currently charging during each time period and multiply it by the charging power.
5) Obtain the charging load demand for electric vehicles.
The random sampling parameters for Monte Carlo simulation in this article are the same as those in Section 4.1.2. The mean and variance of daily mileage sampling for EV users are 3.2 and 0.88, respectively. The mean and variance of private car travel time sampling are 7.63 and 1.9, respectively. The mean and variance of return time sampling are 17.63 and 2.41, respectively.
3.2 Dynamic time-of-use electricity pricing model
Time-of-use peak valley electricity pricing is an effective way for the power grid to regulate user-side demand. The power grid operator divides the peak valley electricity price based on the local basic load curve. Changes in electricity price will affect electricity demand, thereby guiding changes in charging load. The purpose is to reduce the peak valley difference of the load and achieve the effect of peak shaving and valley filling.
In response to the bimodal pattern of electricity demand in China, a typical principle for dividing time-of-use electricity prices is to divide the peak periods of basic electricity consumption at noon and evening into peak periods of electricity prices, divide the valley periods of electricity consumption at night into valley periods of electricity prices, and the rest of the time into flat periods of electricity prices.
However, because static electricity prices do not change after being divided into different intervals, and the basic load of residents is not constant, new changes may occur due to differences in geographical and climatic conditions, which can easily conflict with the original range of intervals. Considering the above factors, a multiperiod dynamic electricity price regulation strategy based on daily load forecasting is proposed to address the mismatch between prices at peak and loads at valley or flat levels.
Based on the results of the current basic load forecasting, the load is divided into multiple segments, and then the current price for each time period is calculated based on the actual load. A multiperiod dynamic electricity pricing strategy is proposed, with the aim of accurately and effectively guiding load transfer and improving efficiency by combining different actual basic load situations.
In Equation 16,
In Equation 17, before the membership degree of each load period is calculated through the membership function
Then, the mapping of each load period in the price range is obtained. In Equation 18,
The multiperiod dynamic electricity pricing strategy can be adjusted according to different basic load conditions, making the guidance more realistic. The more detailed the division of load intervals, the more accurate the guidance, but a more detailed division of intervals will bring a larger computational load.
For electric vehicles, the technology of guiding EV charging through dynamic electricity prices can avoid peak electricity consumption periods and reduce users' charging costs. At the same time, it reduces the power supply pressure on the power grid and minimizes the load peak valley difference.
4 A low-carbon scheduling model for electric vehicles considering carbon quotas and dynamic electricity prices
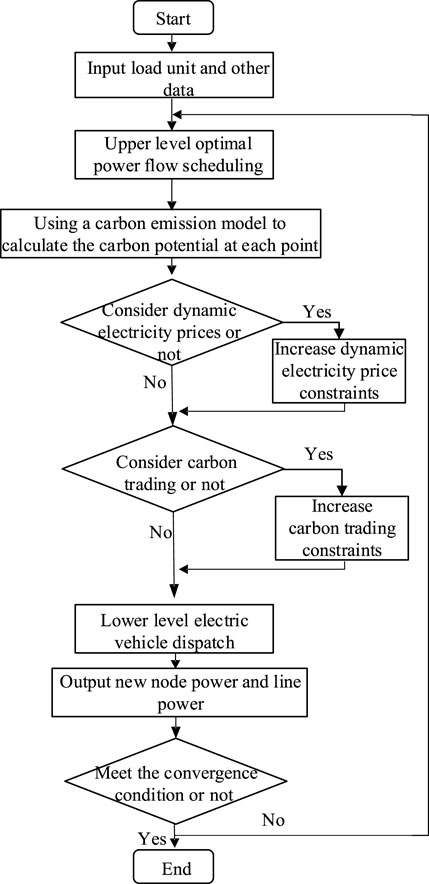
This article uses a two-layer scheduling model to study the economics and low-carbon performance of the system. The upper-level model is directly solved using the complex linear programming expert (CPLEX) solver. The lower-level EV scheduling uses the particle swarm optimization algorithm to optimize the distribution of EV charging power. The upper-layer model transfers the preliminary scheduling parameters to the lower layer. The charging power of the electric vehicle in the lower layer is optimized to obtain new node power and return to the upper layer. The upper layer recalculates the optimal power flow after the node power changes to obtain the new line power. The question is iteratively solved.
4.1 Upper-level scheduling model
4.1.1 Upper-level goals
A function 1 is established on the power grid side to minimize load variance to smooth load fluctuations in the distribution network and reduce load peak valley differences.
In Equations 20–23,
4.1.2 Power grid flow constraints
In DC power flow calculation, the basic form of line power flow is shown in Equation 24
In Equation 25,
In the equation:
4.1.3 Carbon emission flow calculation
According to Section 2, the calculation of carbon emission flow can be obtained from Equations 1–9, and the carbon potential of each node can be calculated to obtain the carbon emissions at the load end, which are then transmitted to the lower layer.
4.2 Lower-level scheduling model
4.2.1 Lower-level goals
On the user side, in order to ensure the highest user revenue, the objective function 2 is to minimize the charging cost of electric vehicles, shown in Equation 26.
In Equation 26,
4.2.2 Constraints for electric vehicles
The charging load of electric vehicles in each time period should be less than the schedulable charging load of electric vehicles in that time period, with the following constraints:
In Equation 27,
In order to ensure battery life and prevent deep charging, the battery capacity of each electric vehicle should be less than its upper limit during each time period. Because this article considers the participation of electric vehicles as a whole in scheduling within a region with a large number of electric vehicles, a macro-level average output is adopted to constrain the overall electricity consumption as follows:
In Equation 28,
In addition, the total amount of EV charging capacity during the inspection period should meet the demand for EV charging capacity during the inspection period, with the following constraints:
In Equation 29,
4.2.3 Unit constraints
The output of the power unit cannot exceed its upper limit or be lower than its minimum output, with the following constraints:
In Equation 30,
The rate of increase or decrease in output of thermal power units has its limit value, and the constraints are as follows:
In Equation 31,
The clean energy output constraints are expressed by Equation 32:
4.2.4 Carbon quotas and carbon trading constraints for electric vehicles
This article adopts the baseline method to study the carbon quota of electric vehicles. Based on the current situation in China, we adopt a free allocation method and provide carbon emission quotas for the system based on the baseline method. Then, according to the different carbon potentials of the charging nodes where different electric vehicles are located, we calculate the actual carbon emissions of electric vehicles using the corresponding carbon emission intensity at different times and nodes and obtain the carbon quotas that electric vehicles can trade.
In Equation 33,
4.3 Model solving
The steps for solving the model are as follows:
1) Input line parameters, node parameters, device parameters, etc., for initialization.
2) Conduct preliminary scheduling to obtain the initialized power of the grid interconnection line.
3) Perform optimal power flow scheduling for the upper-level power grid, calculating the carbon emission flow of the power grid and the tradable carbon quotas for different electric vehicles in different time periods, and transmit them to the lower level.
4) Conduct lower-level EV scheduling to obtain new contact line power.
5) Determine whether the discriminant expressed by Equation 34
is valid, where
6) Output scheduling results for analysis.
The specific flowchart is shown in Figure 3.
5 Example analysis
5.1 Basic data
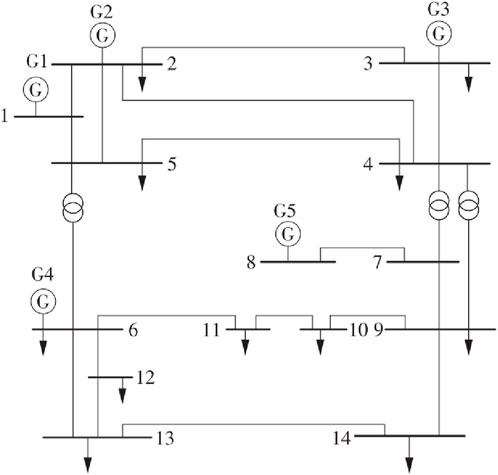
This article uses the IEEE14 node system for testing, which does not include the auxiliary power part of each power source. The system wiring diagram is referenced in by Zhou et al. (2012b), as shown in Figure 4. In the system, G1 is a coal-fired unit, G3 and G4 are gas units, G2 and G5 are situational energy units, and the parameters of the units are shown in Table 1.
This study is based on typical daily loads and typical equipment parameters. The scheduling period used in the study is 24 h, with a step size of 1 h. The price of carbon trading is 50 yuan/t. The capacity of an electric vehicle is 35
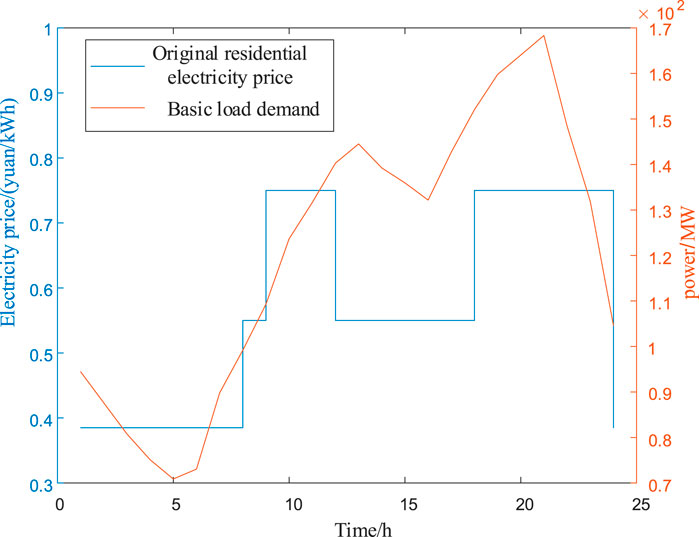
The basic load demand and original residential electricity price are shown in Figure 4.
In Figure 5, the electricity price from 00:00 to 08:00 is relatively low, at 0.38 yuan/kWh. From 08:00 to 09:00 and from 12:00 to 18:00, the electricity price is 0.55 yuan/kWh. The electricity price from 09:00 to 12:00 and 18:00 to 23:00 is 0.75 yuan/kWh. The basic load data are during the valley period from 00:00 to 08:00. The peak period is from 18:00 to 22:00. The static electricity price has the problem of low accuracy. It cannot match peak and valley values with changes in residential load.
To compare the impact of dynamic charging electricity prices and carbon quota trading on EV charging load scheduling and user charging costs, this study sets the following calculation examples:
Case 1: Uncontrolled charging without considering dynamic electricity prices and carbon trading;
Case 2: Consider orderly charging with static time-of-use electricity prices;
Case 3: Ordered charging considering the dynamic time-of-use electricity prices;
Case 4: Consider orderly charging of dynamic electricity prices and carbon trading.
5.2 Analysis of scheduling results
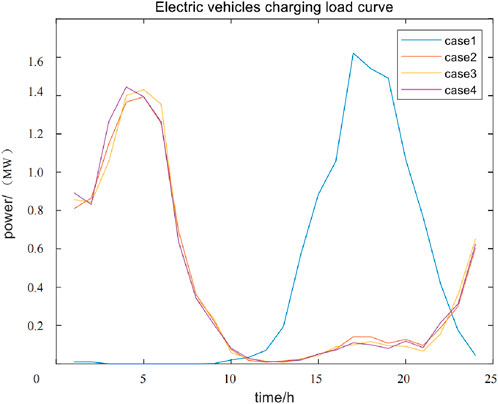
The simulation results of the EV charging load curves for the four cases set are shown in Figure 6.
We can compare Case 1 and Case 2 in Figure 6 when the objective function does not consider the emission reduction benefits of electric vehicles. Due to the guidance of time-of-use electricity prices, EV charging is concentrated during periods with lower electricity costs. Compared with disorderly charging, the charging load of electric vehicles shifts towards valley periods of 21:00–24:00 and 00:00–06:00. This avoids charging peaks of 13:00–21:00 and charging with lower charging prices. To some extent, this allows electric vehicles to fill the valley. The method avoids the phenomenon of “adding peaks on the peak,” reduces the peak valley difference, and reduces the pressure of unit scheduling.
When considering the guiding effect of dynamic electricity prices on EV charging, comparing Case 2 and Case 3, dynamic time-of-use electricity prices are higher during peak periods of basic load electricity consumption, guiding users to charge more during peak periods. When dynamic electricity prices are not considered, there is still a higher charging load during the peak electricity consumption period of 17:00–19:00 than when dynamic electricity prices are considered, which will bring greater power supply pressure to the power grid. Considering dynamic electricity prices during periods 02:00–06:00 can guide more electric vehicles to charge during peak hours, reflecting a significant charging guidance effect of dynamic electricity prices compared to static time-of-use prices.
When considering the emission reduction benefits of electric vehicles in the objective function, we can compare Case 3 and Case 4. It is found that the peak charging load during the valley period after considering carbon trading for electric vehicles shifted from 5 o'clock to 4 o'clock is more dense, while the distribution during peak periods is less. This reduces carbon emissions while avoiding peak charging loads.
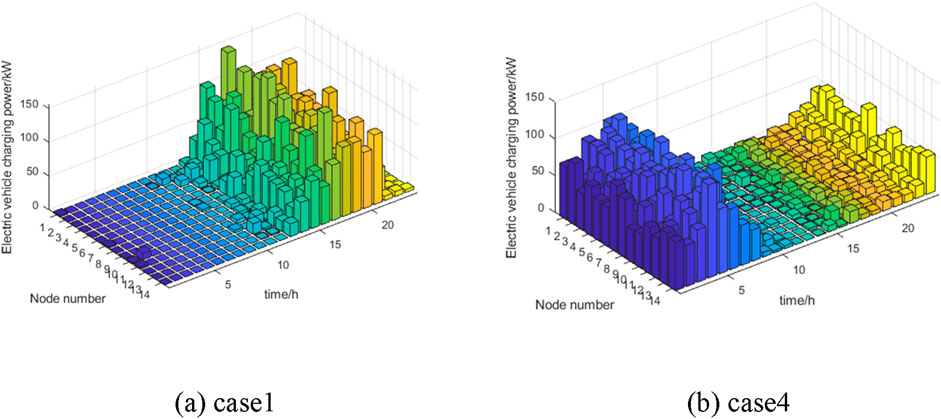
Figure 7 compares the distribution of EV charging power between Case 1 and Case 4 at different time nodes. In addition to reflecting the difference in the time dimension of EV charging load, the figure also reflects the distribution of EV load at each node in space.
In Figure 7, it can be observed that the load distribution of electric vehicles under disordered charging occurs during the peak period of electricity consumption from 15:00 to 20:00. Through the scheduling of the proposed dynamic electricity price and carbon flow guided charging strategy, the charging load of electric vehicles has been transferred to the low valley period with lower electricity consumption, effectively reducing the power supply pressure on the grid.
The system standard deviation, system carbon emissions, charging cost of EV clusters, and the cost or benefit of considering EV carbon quota trading for four scenarios are shown in Table 2.
The results show that considering orderly charging reduces the standard deviation of the system from 30,552.56 to 29,761.76, which can effectively reduce the standard deviation of the system, maintain stable operation of the system, and reduce the charging cost of EV users from 6,587.49 yuan to 5,108.53 yuan; Considering the dynamic charging electricity price, it reduces the charging cost by 227.28 yuan compared to the static electricity price, better matching the electricity price with the peak valley distribution, and reducing the charging cost for users; Considering carbon quota trading for electric vehicles, compared with dynamic electricity pricing charging without considering carbon trading, the system’s carbon emission reduction reaches 10.13 tons, which is 10.41 tons less than disorderly charging. The EV cluster can earn a profit of 431.84 yuan by selling additional carbon quotas through carbon trading, while disorderly charging requires an additional carbon cost of 139.40 yuan due to carbon emissions exceeding the carbon quota. Overall, considering dynamic electricity prices and carbon trading, there is a significant reduction in charging costs and system carbon emissions for EV users.
5.3 Analysis of dynamic electricity prices and carbon trading charging scenarios
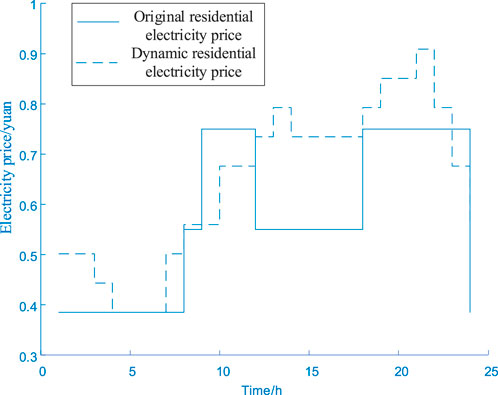
In case 4, the comparison between the final balanced charging price after considering dynamic electricity prices and the original time-of-use price is shown in Figure 8.
The low dynamic electricity prices during the valley period are more concentrated at 4–6 h, while the price during the normal period of 12–17 h does not decrease. Because the power grid load during this period is still high. The electricity price is correspondingly adjusted and increased. In Figure 8, the adjusted electricity price during the valley period is more concentrated and better corresponds to the load’s valley period. The electricity price during the secondary peak period has decreased, and the price during the normal period has increased. The electricity price during the peak period also shows some peaks that match the charging peak period.
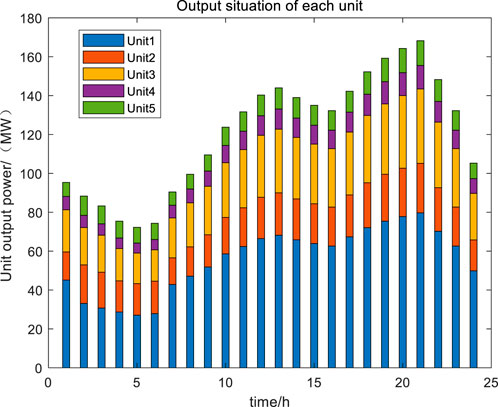
The output situation of each unit is shown in Figure 9.
Unit 1 is set as a coal-fired unit, with the highest power output and the highest proportion of output in each period, especially during the peak period of 16:00–23:00, when the output proportion exceeds 50% of the total output of each unit. Unit 2 and Unit 5 are set as clean energy units, and Unit 2 also has a higher output during peak hours. The proportion of output in Unit 2 and Unit 5 increases significantly during peak hours because the increase in clean energy output during peak hours is conducive to guiding electric vehicles to charge and consume clean energy during peak hours. Under the carbon trading mechanism, a higher proportion of green electricity allows the EV cluster to obtain more carbon trading benefits.
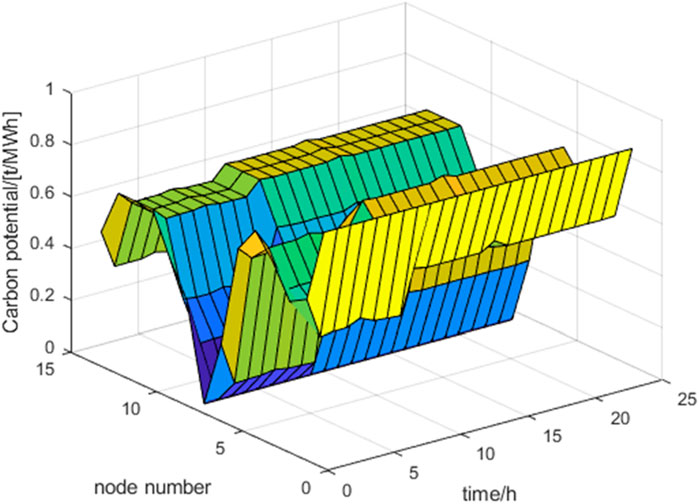
The carbon potential distribution of nodes at different times is shown in Figure 10.
Node carbon potential can reflect the carbon emission levels of each node in the power system. Node 1 has a carbon potential of 0.875 t/MWh, which is consistent with the carbon emission intensity of this node. The carbon potential of nodes 2 and 6 is higher than the carbon emission factor of the generator at that node because the unit at node 1 injects power into nodes 2 and 6 through the line; Node 8 is a clean energy unit with no other units injected, and the carbon potential is 0. Electric vehicles charge at different nodes and use electricity corresponding to different carbon emission intensities, resulting in different equivalent carbon emissions. The higher the carbon potential of the node, the more electricity flows from coal-fired units, and the less electricity flows from clean energy units. Therefore, guiding electric vehicles to charge at nodes with lower carbon potential is conducive to achieving carbon reduction in the system.
Figure 11 shows the distribution of carbon emissions generated by the basic load of each node. The emissions are mainly concentrated in nodes 2–4. The reason is that these nodes are relatively close to Unit 1, which has the highest power generation and carbon emission factor. Therefore, the carbon emissions generated by Unit 1 account for a large proportion. The closer the node is to Unit 1, the higher the branch carbon flow rate and carbon potential and the higher the carbon emissions.
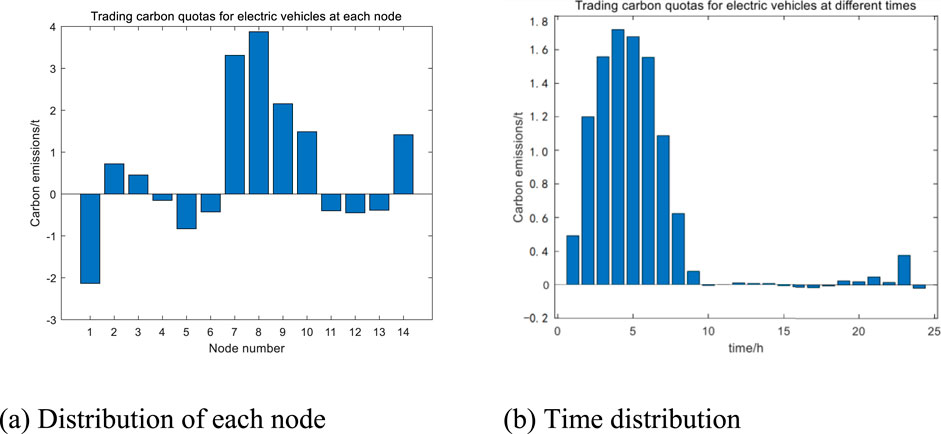
Figure 12 shows the tradable carbon quotas for electric vehicles at each node after considering carbon quota trading, as well as the tradable carbon quotas at different times. In terms of space, tradable carbon quotas are mainly distributed in nodes 7–10 because these nodes have lower carbon potential and a higher proportion of clean energy sources in electricity. Electric vehicles gathering at these nodes for charging can consume more clean energy and have smaller equivalent carbon emissions, thus obtaining more carbon quota trading quotas. In terms of time, tradable carbon quotas are mainly distributed between 0:00 and 8:00. The reason is that electric vehicles are mainly charged during peak periods, and high electricity consumption during peak periods can lead to an increase in the potential of each node. Charging during peak periods corresponds to lower node potentials, obtaining more tradable carbon quotas.
Overall, in terms of time and space, the transfer of EV charging load to low-load periods and low-carbon potential nodes has resulted in higher carbon trading quotas for the transferred EV clusters.
5.4 Prospects for electric vehicles and low-carbon development
With the rapid growth of the EV penetration rate and China’s promotion of the “dual carbon” target, it is urgent to explore and solve the problem of how electric vehicles can effectively participate in the electric carbon coupling market. At present, China’s electricity and carbon markets operate relatively independently, lacking research on the coupling mechanism between electricity and carbon and the synergistic mechanism of market connection, which hinders the full utilization of the carbon reduction value of electric vehicles. The optimization scheduling strategy for electric vehicles considering carbon emissions and dynamic electricity prices proposed in this article has a significant impact on urban sustainable development and transformation.
The key issue in achieving mutual synergy between diverse markets is to find a coupled quantitative model between the electricity and carbon markets. This article proposes the concept of carbon trading that considers carbon emissions flow to link the carbon market with the electricity market, transferring the carbon emission responsibility of power plants to electricity consumers in the form of electricity prices through the calculation of carbon emission intensity. The EV load is based on the carbon emission cost corresponding to the carbon emission intensity and the dynamic electricity price adjustment charging and discharging strategy to reduce electricity costs. Based on the EV load charging and discharging load curve, the electric carbon coupling market operation system calculates the main body’s electricity carbon emission intensity, calculates the carbon emission intensity of the region where the load is located, and the electricity market obtains the carbon emission cost or benefit and charging electricity price through the regional carbon emission intensity. The optimization scheduling strategy for electric vehicles considering carbon emissions flow and dynamic electricity prices proposed in this article can enable EV loads to participate in a diversified electric carbon market that includes medium - and long-term electricity energy markets, spot trading markets, ancillary service markets, and demand response markets.
The coupling effect between the green electricity market, green certificate market, and carbon market occurs through price transmission, clarifying the price relationship between green electricity, green certificates, and carbon, and facilitating the transmission of price signals between multiple markets, which can better promote the connection between the green electricity, green certificate market, and carbon market. On the one hand, we should further promote the reform of the power system, deepen the openness of the power market, and improve the price formation mechanism in various markets. On the other hand, it is necessary to improve the price transmission mechanism between markets and production links and promote the transmission of carbon emission reduction costs from the power supply side to the user side while opening up the price transmission channels between the green certificate market and the carbon market. By clarifying the price relationships between markets and transmitting prices with environmental value signals to the user side, the cost of carbon emission reduction can be shared by the whole society, promoting the comprehensive green and low-carbon transformation of the power generation and consumption sides.
The findings of this study can be applied to both the Chinese electricity market and to markets in other different countries. Based on the concept of regional carbon intensity, the impact of the carbon market on the electricity market is quantified through carbon quotas, and on this basis, an operational system for the electricity carbon coupled market and a model architecture for electric vehicles to participate in the diversified electricity carbon market are proposed. The proposed operation system of the electric carbon coupling market can enable EV load aggregators to participate in the diversified electric carbon market. At the same time, a carbon trading model that considers carbon emissions can effectively quantify the economic responsibility that electricity users need to bear for carbon emissions, shifting the responsibility for carbon emissions from the production side of electricity to the consumption side, thereby effectively promoting the operation of the electricity carbon market business model.
6 Conclusion
This article proposes an optimization scheduling strategy for electric vehicles that considers carbon emission flow and dynamic electricity prices. Fully utilize the scheduling role of dynamic time-of-use electricity pricing and carbon quota trading in the operation of electric vehicles. Unleash the economic and low-carbon potential of electric vehicles. The scheduling method proposed in this study can promote the consumption of renewable energy. Simultaneously balancing economic and low-carbon aspects during the operation of electric vehicles. By establishing simulation examples to verify the effectiveness of the proposed model, the following conclusions can be drawn:
1) Compared with disordered charging, using static time-of-use electricity price for orderly charging reduces the system standard deviation, reduces the charging cost for EV users by 22.45%, reaching 1,478.96 yuan, and disordered charging will pay 139.40 yuan in carbon cost due to the equivalent carbon emissions exceeding the carbon quota. Therefore, orderliness has a good grain-filling effect and charging economy.
2) Compared with the static time-of-use electricity price, adopting the dynamic time-of-use electricity price reduces the system’s carbon emissions by 0.15 t. At the same time, adopting the dynamic time-of-use electricity price reduces the total charging cost of electric vehicles by 2.49%, reaching 127.28 yuan. The use of dynamic time-of-use electricity prices not only reduces carbon emissions to a small extent but also adjusts the degree of matching between time-of-use electricity prices and peak and valley electricity consumption, reducing the economic burden on the system. Therefore, dynamic time-of-use electricity pricing charging has good economic benefits.
3) After considering the carbon quota trading of electric vehicles, the system’s carbon emissions will decrease by 10.13 tons, which is 10.41 tons less than disorderly charging. The total cost of EV charging will be reduced by 451.11 yuan. At the same time, considering the carbon quota trading of electric vehicles, the EV cluster can obtain tradable carbon quota profits of 431.84 yuan, which stimulates the enthusiasm of EV users to participate in charging time and location guidance. Therefore, considering that carbon quota trading for electric vehicles has good economic and low-carbon benefits.
Data availability statement
The original contributions presented in the study are included in the article/Supplementary Material; further inquiries can be directed to the corresponding author.
Author contributions
HH: data curation, formal analysis, software, and writing–original draft. BQ: methodology, supervision, validation, and writing–review and editing. YX: writing–review and editing. JT: conceptualization, funding acquisition, project administration, visualization, and writing–review and editing. JO: writing–review and editing. XL: writing–review and editing. PH: writing–review and editing. FZ: writing–review and editing.
Funding
The author(s) declare that financial support was received for the research, authorship, and/or publication of this article. This work was supported in part by the China Southern Power Grid Corporation Technology Project (GZKJXM20222151). The funder was not involved in the study design, collection, analysis, interpretation of data, the writing of this article, or the decision to submit it for publication.
Conflict of interest
Authors HH, YX, JO, and PH were employed by Guizhou Power Grid Co., Ltd.
The remaining authors declare that the research was conducted in the absence of any commercial or financial relationships that could be construed as a potential conflict of interest.
Generative AI statement
The author(s) declare that no generative AI was used in the creation of this manuscript.
Publisher’s note
All claims expressed in this article are solely those of the authors and do not necessarily represent those of their affiliated organizations, or those of the publisher, the editors, and the reviewers. Any product that may be evaluated in this article, or claim that may be made by its manufacturer, is not guaranteed or endorsed by the publisher.
References
Ayman, B., and Salama, M. M. A. (2014). Management scheme for increasing the connectivity of small-scale renewable DG. IEEE Trans. Sustain. Energy, 27 (1), 1–8. doi:10.1109/TSTE.2014.2329647
Baharin, N., and Abdullah, T. A. (2013). Challenges of phev penetration to the residential network in Malaysia. Procedia Technolo-gy 11 (1), 359–365. doi:10.1016/j.protcy.2013.12.203
Chen, H., Mao, W., Zhang, R., and Yu, W. (2021). Low-carbon optimal scheduling of a power system source-load considering coordination based on carbon emission flow theory. Power Syst. Prot. Control 49, 1–11. doi:10.19783/j.cnki.pspc.200932
Clement, N. K., Haessen, E., and Deiesen, J. (2010). The impact of charging plug-in hybrid electric vehicles on a residential distribution grid. IEEE Trans. Power Syst. 25 (1), 371–380. doi:10.1109/tpwrs.2009.2036481
Cui, Y., Deng, G., Wang, Z., Wang, M., and Zhao, Y. (2021). Low-carbon economic scheduling strategy for power system with concentrated solar power plant and wind power considering carbon trading. Electr. Power Autom. Equip. 41, 232–239. doi:10.13334/j.0258-8013.pcsee.210697
Fathabadi, H. (2017). Novel grid-connected solar/wind powered electric vehicle charging station with vehicle-to-grid technology. Energy 132, 1–11. doi:10.1016/j.energy.2017.04.161
Haoming, Y, Xinwei, M., Liu, J., Zhiming, J., Haohao, A., Zhuoxin, S., et al. (2023). Optimization strategy of electric taxi charging load based on real-time electric price response. Power Syst. Big Data 26 (07), 1–9. doi:10.19317/j.cnki.1008-083x.2023.07.001
Kang, C., Cheng, Y., Sun, Y., Zhang, N., Meng, J., Yan, H., et al. (2017). Recursive algorithm for carbon emissions in power systems. Automation power Syst., 41 (18), 10–16.
Li, H., Liu, R., and Gao, T. (2017). Research on orderly charging strategy of electric vehicle considering wind power con-sumption. J. Electr. Power Sci. Technol., 32 (1), 16–22.
Ma, Z. J., Callaway, D. S., and Hiskens, I. A. (2013). Decentralized charging control of large populations of plug-in electric vehicles. IEEE Trans. Control Syst. Technol. 21 (1), 67–78. doi:10.1109/tcst.2011.2174059
Pan, X., Zhang, M., Han, Z., Hu, J., Liu, J., and Ge, L. (2022). Energy internet-oriented optimization planning method for intelligent sensing equipment of zero-carbon park. Electr. Power Constr. 43, 47–55.
Pantos, M. (2012). Exploitation of electric-drive vehicles in electricity markets. IEEE Trans. Power Syst. 27 (2), 682–694. doi:10.1109/tpwrs.2011.2172005
Rahbari, A. N., Chow, M. Y., Chen, J., and Deng, R. (2016). Distributed real-time pricing control for large scale unidirectional V2G with multiple energy suppliers. IEEE Trans. Industrial Inf. 12 (5), 1953–1962. doi:10.1109/tii.2016.2569584
Seungwook, Y., Park, K., and Hwang, E. (2017). Connected electric vehicles for flexible vehicle-to-grid(V2G)ser vices[C]//International Conference on Information Networking. Vietnam: Da Nang, 411–413.
Shi, W. H., Wen, X. M., Han, X., Lu, Z., Sun, C., and Li, Y. (2019). Research on strategy about time-of-use pricing and economic operation of power supplier based on stackelberg game. IET Cyber-Physical Systems:Theory&Applications 4 (1), 46–49. doi:10.1049/iet-cps.2017.0125
Wang, C., Yi, C., Changyun, C., Yuan, T., Xiaobo, L., Dongxue, J., et al. (2022). Carbon emission flow calculation method for power systems based on power flow distribution matrix. Sci. Technol. Eng., 22 (12), 4835–4842.
Wang, S., Dong, Z., Luo, F., Meng, K., and Zhang, Y. (2018). Stochastic collaborative planning of electric vehicle charging stations and power distribution system. IEEE Trans Industrial Inf. 14 (1), 321–331. doi:10.1109/tii.2017.2662711
Wang, Y., and Infield, D. (2018). Markov chain Monte Carlo simulation of electric vehicle use for network integration studies. Int. J. Electr. Power Energy Syst. 99, 85–94. doi:10.1016/j.ijepes.2018.01.008
Weiwei, L., Zechun, H., and Song, Y. (2012). Principles and models for regional allocation of carbon emissions from electricity. Grid Technol., 36 (7), 12–18.
Yang, M., Hu, Y., Qian, H., Liu, F., Wang, X., Dong, X., et al. (2023). Optimization of day-ahead and intra-day multi-time scale scheduling for integrated power-gas energy system considering carbon emission. Power Syst. Prot. Control 51, 96–106.
Yin, W., Wen, T., and Zhang, C. (2023). Cooperative optimal scheduling strategy of electric vehicles based on dynamic electricity price mechanism. Energy 263, 125627. doi:10.1016/j.energy.2022.125627
Yu, G., Chuanwen, J., Mingwei, L, Xu, W., and Lei, L. (2014). Carbon emission measurement on the power user side based on complex power flow tracking. Power Syst. autom., 38 (17), 113–117.
Yuan, S., and Ma, R. (2014). Research on carbon emission allocation model based on carbon emission flow theory of power system. Mod. Electr., 31 (6), 70–75.
Zhang, L., Sun, C., Cai, G., Huang, N., and Lv, L. (2022b). Two-stage optimization strategy for coordinated charging and discharging of EVs based on PSO algorithm. Proc. CSEE 42, 1837–1852.
Zhang, P., Xie, L., Ma, R., Lu, P., Song, X., Yang, J., et al. (2022a). Multi-player two-stage low carbon optimal operation strategy considering electric vehicle cluster schedulability. Power Syst. Technol. 46, 4809–4825.
Zheng, Y., Luo, J., Yang, X., and Yang, Y. (2020). Intelligent regulation on demand response for electric vehicle charging: a dynamic game method. IEEE Access 8, 66105–66115. doi:10.1109/access.2020.2985578
Zhou, T., Kang, C., Qianyao, X., and Qixing, C. (2012a). Theoretical exploration of carbon emission flow analysis in power systems. Automation power Syst., 36 (7), 38–43.
Zhou, T., Kang, C., Qianyao, X., and Qixing, C. (2012b). Preliminary exploration of calculation methods for carbon emissions in power systems. Automation power Syst., 36 (11), 44–49.
Keywords: electric vehicles, dynamic electricity price, carbon emission flow, carbon trading, orderly charging
Citation: Hu H, Qian B, Xiao Y, Tang J, Ou J, Lin X, He P and Zhang F (2024) Low-carbon scheduling strategy for electric vehicles considering carbon emission flow and dynamic electricity prices. Front. Energy Res. 12:1519963. doi: 10.3389/fenrg.2024.1519963
Received: 30 October 2024; Accepted: 15 November 2024;
Published: 11 December 2024.
Edited by:
Yue Xiang, Sichuan University, ChinaCopyright © 2024 Hu, Qian, Xiao, Tang, Ou, Lin, He and Zhang. This is an open-access article distributed under the terms of the Creative Commons Attribution License (CC BY). The use, distribution or reproduction in other forums is permitted, provided the original author(s) and the copyright owner(s) are credited and that the original publication in this journal is cited, in accordance with accepted academic practice. No use, distribution or reproduction is permitted which does not comply with these terms.
*Correspondence: HouPeng Hu, NDA5MzI5ODMxQHFxLmNvbQ==
 HouPeng Hu1*
 JianLin Tang
 Fan Zhang