- Science and Technology Information Network Branch, Nanjing Suyi Industrial Co., Ltd., Nanjing, China
With the development of renewable energy, energy storage has become one of the key technologies to solve the uncertainty of power generation and the disorder of power consumption and shared energy storage has become the focus of attention for its cost-effective characteristics. However, it is always difficult to quantify the coupling relationship between charge and discharge strategy and life expectancy in energy storage configuration. Based on this, this paper proposes an industrial user-side shared energy storage optimal configuration model, which takes into account the coupling characteristics of life and charge and discharge strategy. Firstly, the life loss model of lithium iron phosphate battery is constructed by using the rain-flow counting method. In order to further optimize the user-side shared energy storage configuration in the multi-user scenario, a two-layer model of energy storage configuration is built, and the Big M method and the Karush-Kuhn-Tucker (KKT) conditions are used to equivalently transform the constraints. Based on the predicted life of energy storage and the dichotomy method, the optimal energy storage configuration results are obtained. Comparing the energy cost of users under the three scenarios of no storage configuration, storage configuration according to fixed storage life, and storage configuration according to the model proposed in this paper, the results show that the proposed method can help accurately describe the energy storage model, increase the utilization rate of the power station, and improve the electricity economy of users.
1 Introduction
Since the 21st century, establishing low-carbon or even zero-carbon energy systems has become a global focus. Consequently, the application and proportion of renewable energy sources like wind, solar, and hydropower in the grid have gradually expanded. However, renewable energy production inherently exhibits intermittency, volatility, and randomness. When integrated on a large scale with power systems, these characteristics exacerbate the imbalance between supply and demand in generation and load, posing a threat to the safe and stable operation of power systems (Azhgaliyeva, 2019).
Energy storage, as a device capable of altering the spatial and temporal distribution of energy, is a key technology supporting the large-scale integration of renewable energy into the grid and promoting the green transition of energy. It can effectively mitigate the instability of renewable energy generation. With the development and application of energy storage, effective demand-side management can be realized, promoting the application of renewable energy and enhancing system operational stability, which will bring significant changes to power system planning, scheduling, and control (Deguenon et al., 2023). The application of energy storage technology will permeate all aspects of power generation, transmission, distribution, and consumption, alleviating peak load power supply demands and improving the utilization rate of existing grid equipment and the operational efficiency of the grid. Zeng et al. (2024) considering shared energy storage and demand response, a power system interval optimization model based on shared energy storage and refined demand response is proposed. This model effectively enhances the utilization of energy storage and the economic operation of the system, achieving coordinated interaction among “source-grid-load-storage.” As a flexible resource, energy storage can be applied on the generation side (Wang et al., 2023; Song et al., 2023), grid side (Xie et al., 2022a), and user side (Qian et al., 2023), thereby achieving a coordinated unity of “source-grid-load-storage.”
As significant energy consumers, commercial and industrial (C&I) consumers can play a crucial role by enhancing their flexibility and participating in demand response initiatives. On-site renewable energy generation can reduce grid consumption, while energy storage systems (ESS) can store energy for later use, supporting variable generation and shifting demand. Both technologies, when integrated with demand response, can enhance flexibility and benefits (Yasmin et al., 2024). Installing energy storage systems effectively addresses uncertainties in renewable energy sources (RES) and load demands, ensuring the stable and efficient operation of industrial power systems (Jianwei et al., 2022). Kwon et al. (2017) proposed a demand-side electricity procurement approach to minimize energy costs for consumers. Krishnamurthy et al. (2018) introduced a stochastic optimization model to maximize user energy arbitrage, considering uncertainties in day-ahead loads and real-time prices. However, these models focus on optimizing standalone energy storage for single users.
The low cost and inefficiency of standalone systems hinder the development of energy storage (Tahir et al., 2022). This has led to the emergence of shared energy storage solutions (Zhu and Ouahada, 2021). Wang et al. (2024a) developed a new business model that allows multiple users within an industrial park to share leased energy storage, proposing a robust optimization framework. Their results show that shared leasing is significantly more economical than self-built storage. Aminlou et al. (2022) established a peer-to-peer (P2P) energy trading model in the context of shared battery energy storage systems (SBESS), which can save substantial costs for industrial towns.
Regarding the business models and pricing mechanisms of shared energy storage, Zhu et al. (2022) proposed a peer-to-peer (P2P) energy trading system, which integrates energy trading with energy management, enabling each prosumer to jointly manage its energy consumption, storage scheduling, and energy trading in a dynamic manner for smart communities consisting of a group of grid-connected prosumers with controllable loads, renewable generations and energy storage systems. Xu et al. (2023) designed a business model for shared energy storage operators providing deviation insurance services from the perspective of commercial insurance; Yang et al. (2023) considered the regulation demands from the power side and grid side, proposing a distributed shared energy storage operational model; Lai et al. (2022) presented a two-stage pricing mechanism between the coordinator operating the shared energy storage and the prosumers borrowing the shared capacity from the coordinator; Zhang et al. (2022) studied the equilibrium state of supply-demand flow in a peer-to-peer market model for residential shared energy storage units and proposes a method for service pricing and load dispatching. Zhang et al. (2024) addressed the interests of different entities in the operation of Energy Storage Systems and Integrated Energy Multi-Microgrid Alliances by proposing an optimization method based on Stackelberg game theory.
For the configuration and optimization of shared energy storage, Wang C. et al. (2022) categorized residential flexible loads based on different demand response patterns and establishes demand response models for various load types. Xie et al. (2022c) first proposed a community energy storage collaborative sharing model that includes multiple transaction types, then established a community shared energy storage scale and configuration model based on the cooperative game between community users and energy storage operators; based on this, the bilateral Shapley method (Yang et al., 2021) is applied, allocating the annual total cost based on the marginal expected costs brought by each user. For the profit distribution using the Shapley value method, Cremers et al. (2023) conducted a systematic review of the use of Shapley values in energy-related applications, as well as the literature on calculating or approximating them. They developed a new method for accurately calculating Shapley values by clustering producers and consumers into fewer demand profiles, making it applicable to communities with hundreds of agents. Wu et al. (2023) proposed a new profit distribution method based on Shapley values, focusing on cooperative fairness and encouraging alliance improvements. Pedrero et al. (2024) introduced Nested Shapley values as a new sharing mechanism that fairly allocates profits among members of large alliances, addressing the trade-off between fairness and scalability. In the area of energy storage scheduling, Yang et al. (2024) proposed a scheduling method based on multi-stage robust optimization to address the scheduling problems of energy storage systems and uncertain energy. Qian et al. (2024) considered the demand response of electric magnesium loads, an improved scenario-based typically distributed robust energy and reserve renewable energy system that significantly reduces the costs of day-ahead scheduling and rescheduling while enhancing operational economy without compromising the high reliability and safety of the Renewable Portfolio Standard (RPS). Wang K. Y. et al. (2022) presented a dual-layer optimization model for the configuration and scheduling of integrated energy systems in multi-microgrids, considering energy storage and demand response, to enhance renewable energy consumption and reduce carbon emissions.
However, the aforementioned literature focuses on using game theory to achieve the configuration of user/park shared energy storage, neglecting the impact of energy storage losses on configuration results (Xie et al., 2022b). In integrated configuration and scheduling models, the lifespan of energy storage and optimized charge/discharge strategies are highly coupled, significantly affecting the economic evaluation of energy storage over its entire lifecycle. Scholars have conducted relevant research on these issues. In literature (Wang et al., 2024b), the Rain-flow counting method (Pan et al., 2021) and iterative methods are used to quantify the impact of capacity loss on configuration. By offline calculating the health status of energy storage during each iteration, it is concluded that when the initial health status value reaches consistency at the beginning of each year, the iteration converges, resulting in optimal configuration outcomes. Although the above methods address some issues and make the economic configuration model of shared energy storage more precise, the physical significance of the iterative process is unclear, and the impact of charge/discharge strategies on expected lifespan and corresponding optimal configuration results is overlooked.
Therefore, this paper proposes an optimal configuration model for industrial user-side shared energy storage that considers the coupling characteristics of lifespan and charge/discharge strategies, based on cooperative game theory (Mao et al., 2022) and a business model for users to jointly configure energy storage. First, the Rain-flow counting method is used to solve the equivalent cycle count of the energy storage battery, obtaining a relevant model for calculating battery lifespan loss. Second, a bi-level model is constructed, with the upper-level objective of minimizing the total cost for the user group and the lower-level objective of minimizing the cost of purchasing electricity from the grid for the user group. Finally, the KKT conditions and Big-M method are used to transform the bi-level model, combined with a bisection method to iterate the expected lifespan of energy storage. Shapley value allocation model is applied to allocate the cost of multi-user alliance.
2 Equivalent life model of ESS
2.1 Rain-flow counting method
The Rain-flow counting method was proposed by two British engineers in the 1950s. Its core idea is to decompose complex load curves into multiple load cycles, which are then used for fatigue life estimation. The Rain-flow counting method is a dual-parameter cycle memory model with clear physical significance. Therefore, it can also be used to predict the equivalent cycle life of batteries. The cycle life of a battery varies with different depths of discharge. By using the Rain-flow counting method, the number of charge-discharge cycles and their depths within a typical day for an energy storage battery can be calculated, which is then used for battery life estimation.
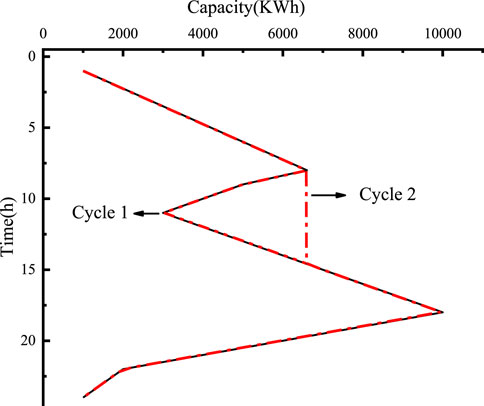
The rain-flow counting method is widely used in fatigue life analysis across various fields, such as materials science, and in recent years, it has also been applied to assess battery life (Xu et al., 2021). Figure 1 shows the SOC image after rotation, and the process for obtaining this image is as follows. First, the capacity change data is collected and plotted to create a curve. This curve is then rotated 90 degrees counterclockwise to fit the requirements of the Rain-flow counting method. The starting point on the curve is marked as the origin for simulating “raindrops.” As the simulation progresses, “raindrops” flow along the curve, and each time they reach a peak (or “eave”), it is checked whether they can fall. If a “raindrop” falls and is intercepted by another part of the curve, it continues to fall until it reaches either the maximum or minimum value of the curve, at which point it reverses direction. If the value at the endpoint differs from the starting point when the raindrop reaches the endpoint, it is considered that the cycle is divided into two half-cycles, with the division point at the maximum or minimum value of the complete curve. Figure 1 provides an example of calculating the number of cycles using the Rain-flow counting method.
Figure 1 shows the capacity change curve of a battery within 24 h. The State of Charge (SOC) of the battery refers to the ratio of the remaining charge in the battery to the nominal capacity of the battery, usually expressed as a percentage. The Depth of Discharge (DOD) of period one is 0.3366, and period two is 0.8415.
2.2 Battery life loss model
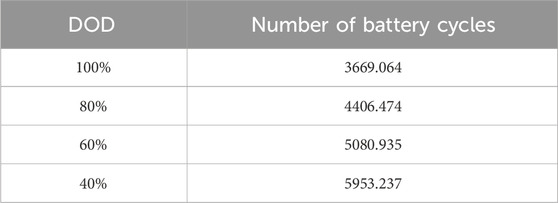
It is generally considered that energy storage batteries are scrapped when their capacity drops below 80% of the initial capacity. The relationship between the cycle life of lithium iron phosphate batteries and the DOD is fitted based on the number of cycles Nctf at different DOD levels.
In Formula 1 (Gao et al., 2013), A, B, and C are parameters related to the discharge depth DOD of the Shared Energy Station (SES); nk represents the number of cycles of the SES at a certain discharge depth DOD,i.
If the DOD for the i-th charge-discharge cycle is DOD,i, the equivalent cycle life can be expressed by Equation 2 as:
Tlife of the battery in the working cycle of the energy storage power station is:
In the Equation 3, Tlife represents the equivalent cycle life.
Therefore, it is considered that the life loss of the energy storage battery is:
In the Equation 4, when T = 1, the battery is considered to be exhausted and needs to be scrapped.
When the calculation period is year, the equivalent cycle life of shared energy storage in 1 year is the sum of days d:
In Equation 5, Tlife, year represents the equivalent cycle life of shared energy storage in 1 year.
The estimated service life of shared energy storage is:
In the Equation 6, Tbase represents the cycle life of the energy storage battery under the typical day (in years).
3 User-side SES configuration model
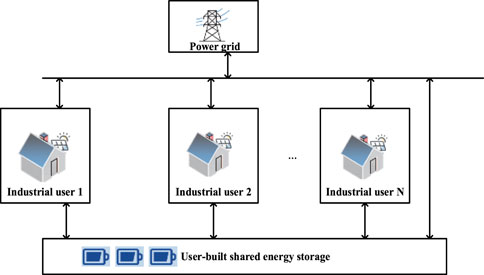
When users build their own energy storage stations under this business model, the system structure is shown in Figure 2 (Yan and Chen, 2022) The objective function of the user-side shared energy storage model focuses on the cost of electricity purchase and the construction and operation costs of the energy storage station. The model aims to minimize the total cost of user investment in the station and electricity purchase while achieving the lowest electricity purchase cost for the user.
Therefore, a Bi-level model is established. The upper level aims to minimize the sum of user investment and electricity purchase costs, while the lower level aims to minimize the user’s cost of purchasing electricity from the grid. Based on this, this section will establish a cost conversion model for the energy storage station using the Net Present Value (NPV) method and a bilevel model with the objective of minimizing user costs.
3.1 Upper layer model
3.1.1 Upper objective function
In the upper-level model, users need to consider the costs of constructing and operating the energy storage station. Since the construction investment cost of the energy storage station is a one-time investment, the time value of money must be taken into account.
In Equation 7,
The daily average investment cost of the energy storage station is given by Equation 8:
where
The present value annuity factor is given by:
In Equation 9,
Daily maintenance cost of energy storage power station:
In Equation 10,
The electricity cost for users purchasing electricity from the grid is given by:
In Equation 11,
The demand charge for users purchasing electricity from the grid is given by Equation 12:
where
According to the demand charge payment rules, users only need to pay the demand charge based on the maximum load from the grid in that month, in addition to the basic electricity cost. The demand charge rate in China varies depending on the user type and typically ranges from 30 to 50 ¥/kW.
3.1.2 Upper constraint
In configuring the energy storage station, constraints on user electricity purchases, station charge/discharge operations, and grid power flow need to be imposed to achieve a rational planning of the user-owned energy storage station business model.
Constraints on the charging and discharging power of the energy storage battery:
In the above equations,
Constraints on the upper and lower limits of energy storage battery capacity:
In Formula 19,
The energy storage state constraint for t ESS is shown in Equation 20.
In the above equation,
The constraint on the electricity flow between each user and SES:
where
The energy storage power balance constraint is shown in Equation 26.
This constraint signifies that the total sum of the difference in energy exchange values between each user and the energy storage station must equal the change in energy stored in the battery during that time period.
The unidirectional power transmission constraint within the power grid:
In Formula 27, the power transmitted through the power grid should be a positive value and less than the maximum transmission capacity.
3.2 Lower layer model
3.2.1 Upper objective function
The lower objective considers the lowest cost of electricity for users and is expressed by Equation 28 as:
3.2.2 Lower constraint
User power balance constraints:
In Equation 29,
The user’s power purchasing constraint:
In Equation 30,
The peak shaving load constraint:
In Equation 31,
3.3 The cost allocation model based on the Shapley value method
The revenue distribution model uses the Shapley value method to fairly consider each member’s contributions. This helps allocate assets appropriately. Specifically, this model utilizes the Shapley value method to distribute revenues among a coalition composed of n industrial users.
In the calculation process, the marginal contributions made by each member are taken into account, and the revenues are allocated to each member in a reasonable manner, allowing each member to receive corresponding benefits. For a coalition of n industrial users, the allocated revenue for user i, denoted as Xi, is given by:
In Equation 32: Xi represents the allocated revenue for user i; Q is any sub-coalition formed by the total coalition excluding user i;
4 The solution process of the configuration model
4.1 Upper layer model processing
In the upper-level model, the non-linear constraints arising from the multiplication of binary (0–1) variables and linear variables are handled using the Big-M method for Equations 13–17 and Equations 21–25 (Ding et al., 2020). The processed equations are shown in Equations 34–41.
4.2 Lower layer model processing
Due to the dual-level structure of the model under study, it is necessary to appropriately handle the lower-level model to ensure it serves as a constraint for the upper-level model. In this process, we employ the KKT conditions, which are crucial for obtaining the optimal solution in nonlinear programming. By introducing the KKT conditions, even in the face of optimization problems with inequality constraints, we can still utilize the Lagrange multiplier method to continue the solution process, thereby ensuring the accuracy and effectiveness of the model.
The specific steps are as follows:
The lower-level objective function and constraints, along with their Lagrange multipliers, are multiplied to form the Lagrange function, as shown in Equation 42:
The variables present in the lower-level objective function are differentiated to create new equality constraint conditions, which is shown in Equation 43:
The modified inequality constraint conditions from the original lower-level model are retained and become the new constraint conditions of the transformed single-level model, as shown in Equations 44–46:
The rewritten inequality constraint conditions from the previous step need to be processed using the Big-M method,
4.3 The solution process for SES configuration considering the coupling of lifespan and charge-discharge
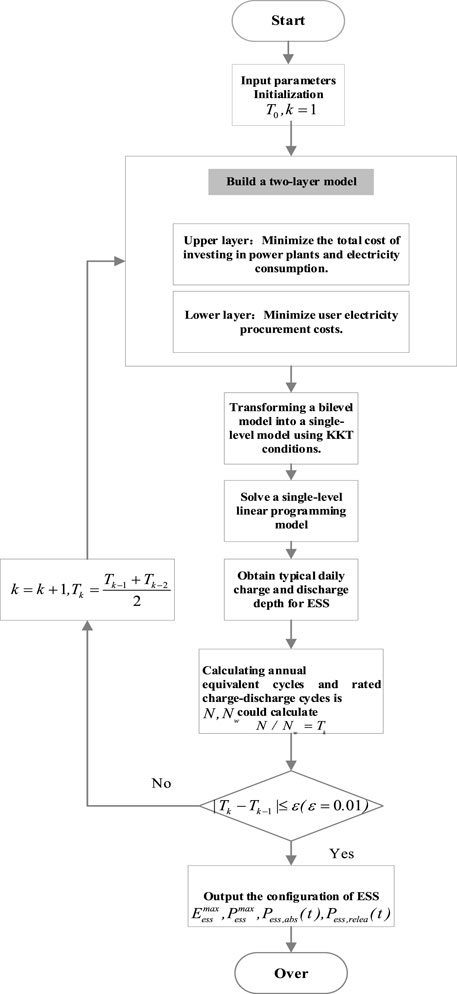
In MATLAB simulation software, a dual-layer model for shared energy storage configuration, composed of minimizing total user cost and minimizing user electricity cost, is constructed. The CPLEX 12.10.0 solver is employed for optimization. To determine the optimal battery life, binary search can be used to repeatedly test midpoints within a known range. This approach allows for quick identification of the best lifespan. The ultimate goal of this method is to reduce the number of tests and increase efficiency (Ding et al., 2023). The solution process, as illustrated in Figure 3, is detailed as follows:
Step 1: Users intending to participate in the shared energy storage project are identified. Historical load data for each user is analyzed, and the load profiles for typical days within a year are extracted.
Step 2: A dual-layer model for energy storage optimization is established to optimize the capacity and maximum charge-discharge power of the energy storage system. The total annual operational cost for all users throughout the lifespan of the energy storage system is calculated.
Step 3: Using the energy storage data configured in Step 2, the equivalent cycle life of the battery in the energy storage station is calculated by applying the Rain-flow counting method. The calculated results are compared with the expected battery life under the configuration model in Step 2, and if the condition for iterative convergence is met and the configuration is accepted by all users, the shared energy storage is configured accordingly. Otherwise, proceed to Step 4.
Step 4: Due to the irrationality of the configuration model, the configured result is not feasible. Employing the bisection method, the expected battery life is adjusted towards the result obtained from the Rain-flow counting method in Step 3 to obtain a new expected lifespan. Based on this new expected lifespan, Step 2 is repeated to obtain a new optimal configuration result. The comparative process is repeated until the final configuration result is obtained.
The specific solution flow chart is shown in Figure 3.
5 Case studies
5.1 Parameters Setting
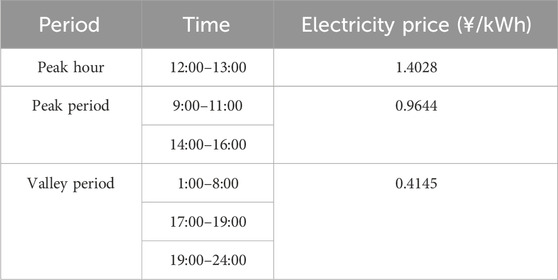
The case study is oriented towards a multi-user energy storage project consisting of three users. The industrial time-of-use electricity prices, as shown in Table 1, are based on the price list for commercial users represented by State Grid Zhejiang Electric Power Company. The demand charge is 48 ¥/kWh, collected on a monthly basis. The number of battery cycles at different DODs is referenced in Table 1. The energy storage battery selected is a lithium iron phosphate battery, and the number of battery cycles at different DODs is referenced in Table 1 (Gao et al., 2013). Time-of-Use (Tou) Prices for industrial and commercial users is referenced in Table 2. The unit cost for user investment in energy storage station construction and unit capacity cost are referenced from the literature (Liu et al., 2021), with values of 1,000 ¥/kW and 1,200 ¥/kWh, respectively. Considering the time value of money, the annual interest rate is 4%. Users are responsible for the operation and maintenance costs of their self-built power stations, calculated as follows: each time there is an electricity flow between a user and the station, the user is required to pay an operational fee of 0.05 ¥/kWh. The expected lifespan of the station is initialized to 5 years. The lower limit for the state of charge of the energy storage is 0.1, and the upper limit is 0.9. The initial state of charge and the state of charge at the final time period satisfy the continuity constraint of the energy storage device state. The number of typical days is 1.
5.2 Configuration result analysis
5.2.1 Initial configuration result
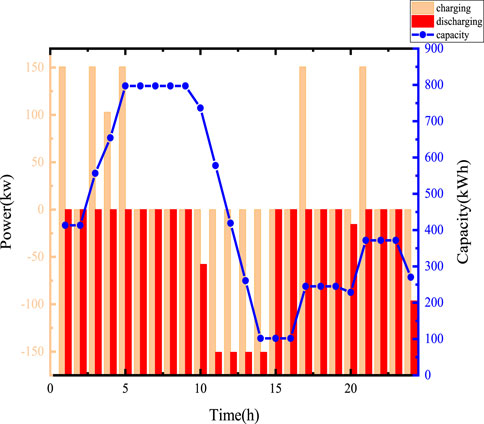
When the expected service life of the battery is initialized to 5 years, the model yields the following results: The optimal capacity of the energy storage station is 1018.2328 kWh, with a maximum charge and discharge power of 150.71 kW. The total cost for the user group is ¥66209617.2443, and the total cost for electricity purchase by the user group is ¥65916347.7008.
The charge and discharge status of the energy storage station at this time is shown in Figure 4. Energy storage tends to charge during off-peak hours, such as from midnight to 8 a.m., and then discharge during peak demand periods to reduce user load and engage in peak-valley arbitrage. However, it has also been observed that users are not very willing to participate in peak shaving with energy storage. This is due to the relatively short lifespan of energy storage systems and the significant daily investment required.
5.2.2 Life iteration process
Based on the preset battery life, the battery charge and discharge status are shown in Figure 4, and it is input into the battery life degradation model for calculation. The battery cycling within a typical day consists of two full cycles and one-half cycle, with the battery’s charge and discharge depth being:
The calculated equivalent cycle life of the battery is 6.362 years. Using the bisection method, the preset battery life is updated to obtain the new battery life:
The optimization model configuration process for the energy storage system is repeated. The total number of iterations is 13, and the iteration data for the battery life is shown in Figure 5.
5.2.3 Analysis and comparison of optimal configuration results
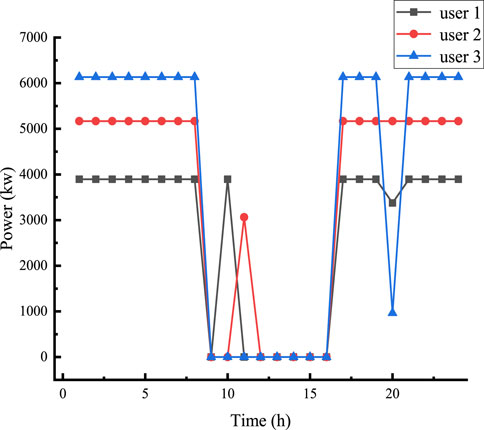
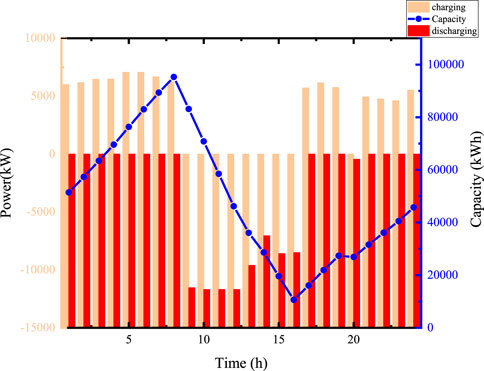
When the battery service life is 12.72 years, the operational results of the multi-user shared energy storage dual-layer model are as follows: The optimal capacity for the energy storage station for this year is 106507.5029 kWh, and the optimal maximum charge and discharge power for the energy storage station is 11694.06 kW. The total cost for the user group’s annual grid electricity purchases is ¥47134790.454, and the total annual electricity cost for the user group is ¥60772021.6139. Figure 6 depict the grid electricity purchases by the typical daily users after updating the battery service life.
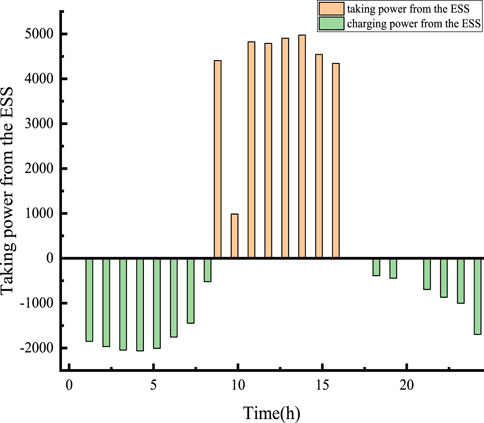
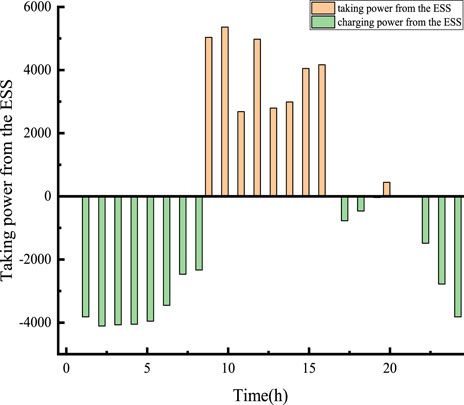
Figures 7–9 illustrate the charge and discharge status of electricity between the user group and ESS.
Compared with the initial configuration results, it is evident that there has been no change in the overall electricity purchasing strategy within the user group. In contrast, the capacity and power of the energy storage system have increased significantly. This is due to the extended lifespan, which has been raised from 5 years to 12.72 years after iteration, resulting in a substantial reduction in the daily investment for the energy storage system. Consequently, users are more inclined to deploy larger capacity and power storage devices. Furthermore, thanks to the increased capacity and power, the current monthly demand charges are lower compared to the initial configuration results. The most notable changes are as follows:
In the optimal configuration results, User 1 purchases less electricity during the 9:00–16:00 period, with a purchase of 3375.4 kW at 11:00, compared to 3896.1 kW at other times. In the initial configuration, User 2 does not purchase electricity at 10:00, buying 5362 kW from 11:00 to 12:00, while in the optimal configuration, User 2 purchases 810.1 kW at 10:00 and nothing at 11:00. Additionally, User 2 does not purchase electricity from 11:00 to 16:00, but increases purchases during off-peak hours to 5169.14kW, except for a purchase of 443.62 kW at 20:00, storing the excess electricity in the station from 1:00 to 8:00 and 17:00 to 24:00. User 3 purchases less electricity during the 9:00–16:00 period and at 20:00, with all other periods at 6133.53 kW.
Under a reasonable electricity management strategy among users, User 2’s cost reduction measure of not purchasing electricity during peak and high-demand periods has been more thoroughly implemented. This strategy not only ensures that User 2 does not incur high electricity purchase costs during peak demand periods but also optimizes the overall electricity usage pattern, further reducing the collective electricity costs for the entire user community. The charge and discharge situation of the station after updating the battery life is shown in Figure 10 Overall, compared to the initial configuration, the energy storage station shows a stronger desire to participate in load regulation. It has greater capacity and power, significantly enhancing its ability to shave peaks and fill valleys, as well as its capability for demand reduction, resulting in more noticeable benefits.
Compared to the configuration results with the preset 5-year battery life, the updated battery exhibits a reduced number of charge and discharge cycles, with the cycling period consisting of two cycles.
Overall, the energy storage station’s charging activity from 1:00 to 8:00 and 17:00 to 24:00 prepares for load reduction from 9:00 to 16:00.
Table 3 provides a comparison between the initial configuration results and the optimal configuration results.
From the data in the table, it is evident that both before and after updating the battery life in the configuration of the shared energy storage station, the electricity costs for users have decreased compared to when the system was not configured.
Considering the energy losses in the station’s batteries, the required station capacity should increase. With the station’s service life updated to 12.72 years, the annual construction cost per year decreases. The increase in the station’s charge and discharge power signifies an improved utilization rate, leading to a further reduction in users’ electricity costs compared to the initial configuration results, resulting in a significant overall cost reduction for the users.
Based on Table 3, the total costs of cooperative energy storage configurations for the three industrial user types in different combinations all satisfy the Super additivity condition. This indicates that by forming a cooperative alliance, the three industrial user types achieve cost reductions, resulting in cooperative surplus and consequently, excess profits.
According to Table 4, it is evident that the total costs for the three industrial user types through cooperative energy storage configuration are lower than the total costs without energy storage and those of individual energy storage configurations. Compared to not having energy storage, the total cost for Industrial User 1 decreases by approximately 2.39 million yuan, for Flat User 2 by approximately 2.13 million yuan, and for Industrial User 3 by approximately 1.12 million yuan, indicating a significant reduction in total costs for each user. It is apparent that this distribution result satisfies both collective rationality and individual rationality.
Based on the above, it can be concluded that the possibility and stability of forming a cooperative alliance among the three industrial user types are ensured.
6 Conclusion
The configuration of shared energy storage needs to be adjusted according to the actual situation of the construction project in the region. Therefore, there is a necessity to discuss the issue of energy storage station configuration considering the capacity loss of the energy storage system. This paper optimizes the configuration of shared energy storage for multiple users, taking into account the factor of battery capacity loss during the configuration process. The calculation of battery degradation can iteratively update the device’s life cycle for energy storage projects, thereby obtaining the most economical, environmentally friendly, reasonable, and practical optimal energy storage station configuration.
1) The Rain-flow counting method is utilized to decompose the battery capacity change curve, and the decomposed important parameters are used for life cycle calculation. A battery life degradation calculation model is established using specified parameters of lithium iron phosphate batteries.
2) The objective is to minimize the total cost of energy storage project construction and electricity usage for all users within a year, considering both the optimal electricity cost for all users and the overall optimal cost of energy storage project construction and electricity usage. A bi-level model is established to achieve the lowest total cost under the condition of optimal electricity cost. In the solution process, the Big-M method and KKT conditions are used to handle the model, ultimately transforming the nonlinear programming problem into a mixed-integer linear programming problem.
3) The results of the bi-level model configuration are updated with the battery life degradation model. Through multiple iterations of optimizing the shared energy storage configuration, the charging and discharging of the shared energy storage device becomes more reasonable. The extension of the shared energy storage device’s lifespan not only reduces the waste of power resources and construction materials but also creates more collective economic benefits for multiple users.
4) For the alliance cost of multiple users, a Shapley value allocation model is established for fair distribution. By analyzing and comparing the costs of different users without energy storage configuration and with independent energy storage configuration, the superiority of multiple-user cooperative configuration of shared energy storage is verified, providing assurance for the maintenance and long-term stability of the cooperative alliance.
Data availability statement
The original contributions presented in the study are included in the article/supplementary material, further inquiries can be directed to the corresponding author.
Author contributions
WW: Conceptualization, Methodology, Writing–review and editing, Writing–original draft. HW: Writing–review and editing. SS: Writing–review and editing. GC: Writing–original draft. SW: Writing–original draft. YJ: Writing–original draft.
Funding
The author(s) declare that financial support was received for the research, authorship, and/or publication of this article. Financially supported by the Science and Technology Project of Provincial Management Industry Unit of State Grid Jiangsu Electric Power Co., Ltd. (Project No. JC2024003). The funder was not involved in the study design, collection, analysis, interpretation of data, the writing of this article, or the decision to submit it for publication.
Conflict of interest
Authors WW, HW, SS, GC, SW, and YJ were employed by Nanjing Suyi Industrial Co., Ltd.
Generative AI statement
The author(s) declare that no Generative AI was used in the creation of this manuscript.
Publisher’s note
All claims expressed in this article are solely those of the authors and do not necessarily represent those of their affiliated organizations, or those of the publisher, the editors and the reviewers. Any product that may be evaluated in this article, or claim that may be made by its manufacturer, is not guaranteed or endorsed by the publisher.
References
Aminlou, A., Mohammadi-Ivatloo, B., Zare, K., Razzaghi, R., and Anvari-Moghaddam, A. (2022). Peer-to-peer decentralized energy trading in industrial town considering central shared energy storage using alternating direction method of multipliers algorithm. IET Renew. Power Gener. 16, 2579–2589. doi:10.1049/rpg2.12490
Azhgaliyeva, D. (2019). Energy storage and renewable energy deployment: empirical evidence from OECD countries. Innov. Solutions Energy Transitions 158, 3647–3651. doi:10.1016/j.egypro.2019.01.897
Cremers, S., Robu, V., Zhang, P., Andoni, M., Norbu, S., and Flynn, D. (2023). Efficient methods for approximating the Shapley value for asset sharing in energy communities. Appl. Energy 331, 120328. doi:10.1016/j.apenergy.2022.120328
Deguenon, L., Yamegueu, D., Kadri, S. M., and Gomna, A. (2023). Overcoming the challenges of integrating variable renewable energy to the grid: a comprehensive review of electrochemical battery storage systems. J. Power Sources 580, 233343. doi:10.1016/j.jpowsour.2023.233343
Ding, Y., Xu, Q., Hao, L., and Xia, Y. (2023). A Stackelberg Game-based robust optimization for user-side energy storage configuration and power pricing. Energy 283, 128429. doi:10.1016/j.energy.2023.128429
Ding, Y., Xu, Q., and Yang, B. (2020). Optimal configuration of hybrid energy storage in integrated energy system. Energy Rep. 6, 739–744. doi:10.1016/j.egyr.2020.11.137
Gao, F., Yang, K., Hui, D., and Li, D. (2013). Energy analysis of cycle life for lithium iron phosphate batteries used in energy storage. China Electr. Power Eng. J. 33, 41–45. doi:10.13334/j.0258-8013.pcsee.2013.05.016
Jianwei, G., Fangjie, G., Yu, Y., Haoyu, W., Yi, Z., and Pengcheng, L. (2022). Configuration optimization and benefit allocation model of multi-park integrated energy systems considering electric vehicle charging station to assist services of shared energy storage power station. J. Clean. Prod. 336, 130381. doi:10.1016/j.jclepro.2022.130381
Krishnamurthy, D., Uckun, C., Zhou, Z., Thimmapuram, P., and Botterud, A. (2018). Energy storage arbitrage under day-ahead and real-time price uncertainty. IEEE Trans. Power Syst. 33, 84–93. doi:10.1109/TPWRS.2017.2685347
Kwon, S., Ntaimo, L., and Gautam, N. (2017). Optimal day-ahead power procurement with renewable energy and demand response. IEEE Trans. Power Syst. 32, 3924–3933. doi:10.1109/TPWRS.2016.2643624
Lai, S. Y., Qiu, J., and Tao, Y. C. (2022). Individualized pricing of energy storage sharing based on discount sensitivity. IEEE Trans. Industrial Inf. 18, 4642–4653. doi:10.1109/TII.2021.3119953
Liu, Y., Dai, H., and Liu, Z. (2021). Configuration and investment benefit analysis of decentralized shared energy storage for multiple types of industrial users. Electr. Power Autom. Equip. 21, 256–264. doi:10.16081/j.epae.202110004
Mao, J., Xiaotong, Z., Chunyun, Y., Aihua, W., and Xudong, Z. (2022). Multivariable coordinated nonlinear gain droop control for PV-battery hybrid DC microgrid access system via a T-S fuzzy decision approach. IEEE Access 10, 89414–89427. doi:10.1109/ACCESS.2022.3201149
Pan, C. Y., Tao, S. Y., Fan, H. T., Shu, M. Y., Zhang, Y., and Sun, Y. J. (2021). Multi-objective optimization of a battery-supercapacitor hybrid energy storage system based on the concept of cyber-physical system. Electronics 10, 1801. doi:10.3390/electronics10151801
Pedrero, R., Pisciella, P., and Granado, P. (2024). Fair investment strategies in large energy communities: a scalable Shapley value approach. Energy 295, 131033. doi:10.1016/j.energy.2024.131033
Qian, J., Cai, J., Hao, L., and Meng, Z. (2024). Improved typical scenario-based distributionally robust co-dispatch of energy and reserve for renewable power systems considering the demand response of fused magnesium load. Front. Energy Res. 12. doi:10.3389/fenrg.2024.1401080
Qian, W., Chen, C., Gong, L., and Zhang, W. (2023). Research on nash game model for user side shared energy storage pricing. Sci. Rep. 13, 16099. doi:10.1038/s41598-023-43254-z
Song, X. L., Zhang, H. Q., Fan, L. R., Zhang, Z., and Peña-Mora, F. (2023). Planning shared energy storage systems for the spatio-temporal coordination of multi-site renewable energy sources on the power generation side. Energy 282, 128976. doi:10.1016/j.energy.2023.128976
Tahir, H., Park, D.-H., Park, S.-S., and Kim, R.-Y. (2022). Optimal ESS size calculation for ramp rate control of grid-connected microgrid based on the selection of accurate representative days. Int. J. Electr. Power and Energy Syst. 139, 108000. doi:10.1016/j.ijepes.2022.108000
Wang, C., Ge, P., Sun, L., and Wang, F. (2022). Research on user-side flexible load scheduling method based on greedy algorithm. Energy Rep. 8, 192–201. doi:10.1016/j.egyr.2022.10.352
Wang, C., Zhang, X., Xiong, H., and Guo, C. (2023). Distributed shared energy storage scheduling based on optimal operating interval in generation-side. Sustain. Energy Grids and Netw. 34, 101026. doi:10.1016/j.segan.2023.101026
Wang, K. Y., Liang, Y., Jia, R., Wang, X. Y., Du, H. D., and Ma, X. P. (2022). Configuration-dispatch dual-layer optimization of multi-microgrid-integrated energy systems considering energy storage and demand response. Front. Energy Res. 10. doi:10.3389/fenrg.2022.953602
Wang, Y., Chen, J., Zhao, Y., and Xu, B. (2024a). Incorporate robust optimization and demand defense for optimal planning of shared rental energy storage in multi-user industrial park. Energy 301, 131721. doi:10.1016/j.energy.2024.131721
Wang, Y., Huang, C., Wang, C., Li, K., Fang, X., and Yan, G. (2024b). Optimal configuration of shared energy storage in industrial park considering full-cycle economic benefits in electricity market environment. Automation Electr. Power Syst. 48, 129–138. doi:10.7500/AEPS20230717009
Wu, W., Zhu, J., Chen, Y., Luo, T., Shi, P., Guo, W., et al. (2023). Modified Shapley value-based profit allocation method for wind power accommodation and deep peak regulation of thermal power. IEEE Trans. Industry Appl. 59, 276–288. doi:10.1109/TIA.2022.3208866
Xie, Y., Chang, X., Yin, X., and Zheng, H. (2022a). Research on the transaction mode and mechanism of grid-side shared energy storage market based on blockchain. Energy Rep. 8, 224–229. doi:10.1016/j.egyr.2021.11.044
Xie, Y., Yao, Y., Wang, Y., Cha, W., Zhou, S., Wu, Y., et al. (2022c). A cooperative game-based sizing and configuration of community-shared energy storage. Energies 15, 8626. doi:10.3390/en15228626
Xie, Y. L., Li, L., and Yang, K. (2022b). Research on shared energy storage configuration considering energy storage battery capacity attenuation. Guangdong Electr. Power 35, 25–32. doi:10.3969/j.issn.1007-290X.2022.005.003
Xu, X., Hu, W., Liu, W., Wang, D., Huang, Q., and Chen, Z. (2021). Study on the economic benefits of retired electric vehicle batteries participating in the electricity markets. J. Clean. Prod. 286, 125414. doi:10.1016/j.jclepro.2020.125414
Xu, X., Li, G., Yang, H., Liu, D., Wang, J., and Zhang, Z. (2023). Pricing method of shared energy storage bias insurance service based on large number theorem. J. Energy Storage 69, 107726. doi:10.1016/j.est.2023.107726
Yan, D., and Chen, Y. (2022). Review on business mode and pricing mechanism for shared energy storage. Autom. Electr. Power Syst. 46, 178–191. doi:10.7500/AEPS20220219003
Yang, M., Zhang, Y. H., Liu, J. H., Yin, S., Chen, X., She, L. H., et al. (2023). Distributed shared energy storage double-layer optimal configuration for source-grid Co-optimization. PROCESSES 11, 2194. doi:10.3390/pr11072194
Yang, Y., Hu, G. Q., and Spanos, C. J. (2021). Optimal sharing and fair cost allocation of community energy storage. IEEE Trans. Smart Grid 12, 4185–4194. doi:10.1109/TSG.2021.3083882
Yang, Z., Wang, S., Zhu, R., Cui, J., Su, J., and Chen, L. (2024). Research on regulation method of energy storage system based on multi-stage robust optimization. Energy 121, 807–820. doi:10.32604/ee.2023.028167
Yasmin, R., Amin, B., Shah, R., and Barton, A. (2024). A survey of commercial and industrial demand response flexibility with energy storage systems and renewable energy. Sustain. 16, 731. doi:10.3390/su16020731
Zeng, L., Gong, Y., Xiao, H., Chen, T., Gao, W., Liang, J., et al. (2024). Research on interval optimization of power system considering shared energy storage and demand response. J. Energy Storage 86, 111273. doi:10.1016/j.est.2024.111273
Zhang, W. Y., Zheng, B. S., Wei, W., Chen, L. J., and Mei, S. W. (2022). Peer-to-peer transactive mechanism for residential shared energy storage. Energy 246, 123204. doi:10.1016/j.energy.2022.123204
Zhang, Y., Li, L., Liu, Z., and Wu, Y. (2024). Research on operation optimization of energy storage power station and integrated energy microgrid alliance based on Stackelberg game. Energy 121, 1209–1221. doi:10.32604/ee.2024.046141
Zhu, H., and Ouahada, K. (2021). A distributed real-time control algorithm for energy storage sharing. Energy Build. 230, 110478. doi:10.1016/j.enbuild.2020.110478
Keywords: shared energy storage configuration, rain-flow counting, life expectancy of energy storage, Shapley value method, bi-layer model
Citation: Wang W, Wang H, Sun S, Cao G, Wang S and Ji Y (2024) Optimal configuration of shared energy storage for industrial users considering lifetime and charge-discharge strategy coupling. Front. Energy Res. 12:1510259. doi: 10.3389/fenrg.2024.1510259
Received: 12 October 2024; Accepted: 26 November 2024;
Published: 17 December 2024.
Edited by:
Zixuan Wang, North China Electric Power University, ChinaReviewed by:
Chutong Wang, North China Electric Power University, ChinaYue Zhou, Cardiff University, United Kingdom
Copyright © 2024 Wang, Wang, Sun, Cao, Wang and Ji. This is an open-access article distributed under the terms of the Creative Commons Attribution License (CC BY). The use, distribution or reproduction in other forums is permitted, provided the original author(s) and the copyright owner(s) are credited and that the original publication in this journal is cited, in accordance with accepted academic practice. No use, distribution or reproduction is permitted which does not comply with these terms.
*Correspondence: Wendi Wang, c3k1ODQyNzg4NzRAMTYzLmNvbQ==
 Wendi Wang
 Hongyan Wang