 Kommoju Naga Durga Veera Sai Eswar
 M. Arun Noyal Doss
 Mohammad Shorfuzzaman
 Ali Elrashidi3*
95% of researchers rate our articles as excellent or good
Learn more about the work of our research integrity team to safeguard the quality of each article we publish.
Find out more
ORIGINAL RESEARCH article
Front. Energy Res. , 07 January 2025
Sec. Process and Energy Systems Engineering
Volume 12 - 2024 | https://doi.org/10.3389/fenrg.2024.1492243
This article is part of the Research Topic Urban Multi-energy System Networks with High Proportion of Renewable Energy View all 7 articles
Microgrid-equipped electric vehicle charging stations offer economical and sustainable power sources. In addition to supporting eco-friendly mobility, the technology lowers grid dependency and improves energy reliability. The manuscript introduces a hybrid technique for efficient electric vehicle (EV) charging integrating the Dollmaker Optimization algorithm (DOA) and spatial Bayesian neural network (SBNN). This method optimizes the joint operation of photovoltaic (PV), wind turbines (WTs), supercapacitors (SCs), and battery energy storage systems (BESSs) in microgrids to enhance EV charging station efficiency, reliability, and power quality while reducing grid outages. The SBNN predicts EV load demand for improved efficiency and reliability, while DOA manages microgrid (MG) fluctuations to ensure seamless EV charging. The MG system features a four-phase inductor coupled interleaved boost converter (FP-ICIBC) and a fractional-order proportional-integral-derivative (FOPID) controller for optimal power management. An evaluation in MATLAB compares DOA–SBNN with existing approaches, demonstrating its effectiveness in enhancing EV charging performance. The proposed method outperforms all current techniques, including the Multi swarm Optimization (MSO), the Multi-Objective Gray Wolf Optimizer (MOGWO), and the Modified Multi-objective Salp Swarm Optimization algorithm (MMOSSA). The results show that the energy efficiency of the recommended approach is 19.19%, 26.15%, and 32.57% higher than the three current techniques, respectively, and that of total harmonic distortion (THD) is 19.09%, 25.85%, and 31.17% lower than those three techniques, respectively.
In the past 20 years, electric vehicles (EVs) have grown in popularity worldwide and have drawn much attention as among the best ways to reduce greenhouse gas emissions in the transport sector (Zhang et al., 2023). New financial research indicates that electric cars will soon completely replace internal combustion engine vehicles (Schoenberg et al., 2022). This makes it necessary to build charging stations (CSs) that can handle the demand for the substantial amount of electricity required to charge these EVs (Ur Rehman et al., 2021). The integration of renewable energy sources (RES) with electric vehicle infrastructure is becoming increasingly important as the world moves toward cleaner energy and sustainable transportation. This study focuses on the design of a microgrid (MG) specifically tailored for an EVCS, utilizing RES such as solar, wind, and battery swapping stations (BSSs).
MGs are compact energy systems that may work independently of the main power grid or in concert with it (Chattopadhyay and Kar, 2024). They offer enhanced reliability, resilience, and efficiency, making them ideal for supporting the growing demand for electric vehicle charging infrastructure. By leveraging renewable energy, these microgrids can significantly reduce the carbon footprint associated with EV charging and contribute to a more sustainable energy ecosystem (Kumar et al., 2024). Current research endeavors underscore the need for additional efforts to tackle the obstacles associated with the most efficient assimilation of EVCSs, battery energy storage systems and virtual synchronous generators (BESS–VSGs), and RES into energy systems (Puech et al., 2024). RES do not have the damping or inertia of typical power plants, whose synchronous generators (SGs) use intrinsic rotational mass to maintain grid frequency even in the face of disturbances (Hussain et al., 2023). The study responds to the urgent demand for sustainable energy solutions in the transportation industry, supporting international initiatives to lower carbon emissions and encourage the use of RES. Through the demonstration of the viability and efficacy of combining renewable energy sources with sophisticated control algorithms, the research endeavors to establish a model for the construction of environmentally conscious, resilient, and efficient EV charging infrastructure.
Problems with intermittency and unpredictability make it difficult to provide a consistent and dependable power supply when microgrids are linked to renewable sources. Several research studies on the topic of MG systems for electric car charging stations that use RES and a variety of methods and factors are available in the literature. A few of those reviewed by Ali et al. (2022) develop evaluations of VSGs, EVCs, and RES from a techno-economic and environmental perspective in MGs. Ju, Y. et al. (2022) analyze the possibilities of VSGs to enhance microgrid stability and synchronization, particularly in conjunction with electric vehicle charging facilities when renewable power sources are connected. Optimum planning of inverter-based renewable energy sources in autonomous microgrids for EV charging stations guaranteeing power distribution stability. Meng et al. (2024a) cover synchronization concerns when PV systems and battery storage are linked for rapid charging. They explain how EV charging demand can be met while maintaining grid stability. Liang, J et al. (2024) integrate queuing theory and deep learning to organize electric vehicle charging stations. Synchronizing microgrid charging stations to improve service efficiency and reduce EV wait times and pricing factors are discussed. Energy storage devices can help to prevent this by maintaining grid stability, and prices can be problematic with these MGs when variable power output is produced from RES. To properly balance supply and demand, sophisticated control systems, advanced algorithms, and micromanagement are required for these intricate integrations. It underlines the importance of advanced control mechanisms and time monitoring for optimum synchronization and microgrid system efficiency and sustainability.
Mbasso Wulfran et al. (2023) set out to accomplish two goals by evaluating a standalone hybrid energy system. Its primary objective was to meet the need for electrical power. Secondly, they wanted to determine how much oxygen to produce at the best rate for fish farming. HOMER Pro software was used for both ideation and execution by reducing CO2 emissions and maintaining system stability.
A desired power flow control system is designed by Fendzi Mbasso et al. (2023) using an intelligent energy handling strategy. The goal is to make the system more stable during blackouts and load fluctuations by making the most of the storage capacity that is available. The work offers a novel MMOSSA-based approach for the optimal distribution of solar PV, WT, BESS–VSG, and EVCS on MGs. An objective function was created to minimize carbon emissions, loss of energy, frequency shift, voltage stability indicator, and levelized cost of electricity. Nafeh et al. (2024) developed an optimum arrangement of RES based on inverters for self-sufficient MGs that house EVCSs. MGs that were linked to EVCSs were recently equipped with RES. Due to unpredictable cohorts and random charging/discharging EV methods, MG optimization proved difficult (Ma, K et al., 2020). Various regulated and unregulated charging techniques, arrival and departure hours, and starting and predefined SOC structures were considered as potential EV needs. A method based on bi-level metaheuristics was devised to tackle this intricate planning model.
Pourvaziri et al. (2024) developed an approach for the best possible size of a proposed grid-connected PV battery system for electric vehicle fast-charging stations in Cairo, Egypt. The proposed study is an adaptation of the SO algorithm. An analysis was carried out to verify the feasibility of the proposed MSO method in accomplishing the intended end goals of the sizing process, comparing it with four other popular meta-heuristic optimization techniques. In addition, a techno-economic analysis was conducted to evaluate the recommended system’s economic feasibility for each of the two chosen pricing schemes over the projects. Kazemtarghi et al. (2024) developed a hybrid approach to the capacity–location issue with charging stations. The suggested method allocates charging stations to electric vehicles according to their state of charge while also determining the capacity and position of charging stations or the quantity of charging stations. The suggested method estimates the average waiting time by combining mathematical modeling and queuing theory. Next, a deep learning system was created to improve waiting time estimation accuracy; using a DNN approach to enhance the NSGA-II algorithm was another addition. Sharida et al. (2024) developed a dynamic pricing approach that regulates CSs’ charging costs at different periods in order to direct EVs from crowded to uncongested CSs. To determine the distances between EVs and CSs, a realistic model for EV routes and CS sites was created using QGIS software. Three scenarios were created to assess the effectiveness of the suggested framework and evaluate the outcomes considering the set price strategy.
Abid et al. (2024) developed a group of creative ideas intended to improve the scalability of AC–DC side operations in fast EVCSs. The suggested fixes concentrate on optimizing and controlling the procedure of connecting a new active front-end rectifier to the previous one at the side of the high-voltage DC link. Disregarding these requirements may have negative consequences, especially for the grid currents in the charging station’s AC–DC side. On the other hand, the DC–DC side was barely affected by these parameters. kumar Saha and Biswas (2023) developed an evaluation of RES, VSGs, and EVCs in MGs from a techno-economic and environmental perspective. A novel solution to this problem was the BESS–VSG, which uses the idea of inverter regulation to simulate a traditional synchronous generator (Shirkhani, M et al., 2023). Furthermore, the operational, financial, and technological components of the microgrid were impacted by the charging habits of EV owners, given the recent surge in EV sales. Consequently, the suggested study provides a unique MMOSSA-based method for the best possible allocation of PV, WT, BESS–VSG, and EVCS on MGs (Zhang, J et al., 2024). Behera S et al. (2024) state that by maximizing system inertia through FiT incentives, the suggested model successfully reduces overall system cost and CO2 emissions. Not only that, the GTEP model outperformed competing soft-computing optimization methods while using significantly less computation time.
Previous literature has described a variety of control methods, such as designing a microgrid for electric vehicle charging stations incorporating the MOO technique, which has significant complexity. These approaches, specifically in the context of optimal allocation BESS–VSG units in microgrids, have not been thoroughly studied. Existing research often addresses individual objectives, but the simultaneous consideration of multiple objectives remains an underexplored area. When used in microgrid systems, EV charging stations, and the MMOSSA, MOGWO, and MSO each address different challenges. Their difficulty in computation is a major drawback that can result in longer processing times (Guo, X et al. (2023)), particularly in dynamic contexts where making decisions in real time is essential. In addition, these algorithms may have problems converging, especially in highly nonlinear conditions typical of microgrid operations, making it hard to effectively reach optimal solutions. They also mainly depend on appropriate parameter tuning, which is a laborious procedure that can ask for specialized knowledge in order to prevent poor performance (Yaghoubi, E et al., 2024). The proposed method uses user-defined limitations and particle swarm optimization (PSO) to create a community-based residential energy management system for MGs. This approach, while innovative, does not fully address the comprehensive optimization needed for BESS–VSG allocation. Additionally, the use of the grasshopper optimization method, genetic algorithm, and PSO has enhanced the efficiency of the FOPID controller for autonomous generation control in multi-area systems. Four additional well-known meta-heuristic optimization techniques have been contrasted using an MSO methodology. Fuzzy logic (Meng et al., 2024b) and genetic algorithms were used to establish a real power regulation strategy for VSGs. By using this technique, frequency deviation is reduced, and BESS–VSG units are allocated using specially constructed fuzzy (Duan et al., 2023) rules. Although this technique shows promise, it does not encompass the broader spectrum of multi-objective optimization challenges in microgrids. These shortcomings provide a reason for our investigation.
A suggested DOA–SBNN for a viable electric vehicle charging station is presented in this study. The DOA is used to effectively control the fluctuations in a microgrid, ensuring seamless EV charging. The SBNN is used to predict the EV load demand. For optimal power management, the microgrid system includes the design of an FP-ICIBC and a FOPID controller. The following list summarizes the important contributions of this manuscript. (a) A microgrid system for EVCSs integrated with a renewable energy source with an FP-ICIBC converter and a FOPID controller is proposed for energy management. (b) Implementing the SBNN technique to predict load demand. (c) Implementing the DOA technique to effectively control the fluctuations in a microgrid, ensuring seamless EV charging. (d) The suggested method is carried out in the MATLAB platform, and its efficacy is evaluated by applying available methodologies. The proposed method shows better results than existing techniques.
The article is arranged as follows: The current research and context are described in segments. The arrangement of the microgrid system to charge electric vehicles is described in Segment 2. Segment 3 shows the proposed DOA–SBNN technique for electric vehicle charging. The findings are discussed in Segment 4. Segment 5 concludes the manuscript.
A structural diagram of an EVCS with a hybrid system is displayed in Figure 1, and the parameters are listed in Table 1. The proposed microgrid system produces power by combining several renewable energy sources, such as photovoltaic cells and wind turbines. After being converted into DC, the produced power is stored for later use in supercapacitors and batteries. The voltage levels between the bus and the EV batteries are intended to be maintained by a suitable interleaved DC converter. The system has power conversion components to control voltage levels and enable power transfer in both directions between the microgrid and the main grid. EV charging uses DC–DC converters and functions as a DC bus using a single DC–AC grid-tied converter. A filter ensures the AC voltage is steady, and a DC bus connects the system’s various parts. Two controllers have been suggested for controlling power flow and optimizing operation: a bidirectional, fractional-order proportional-integral-derivative controller and a neural network-based controller.
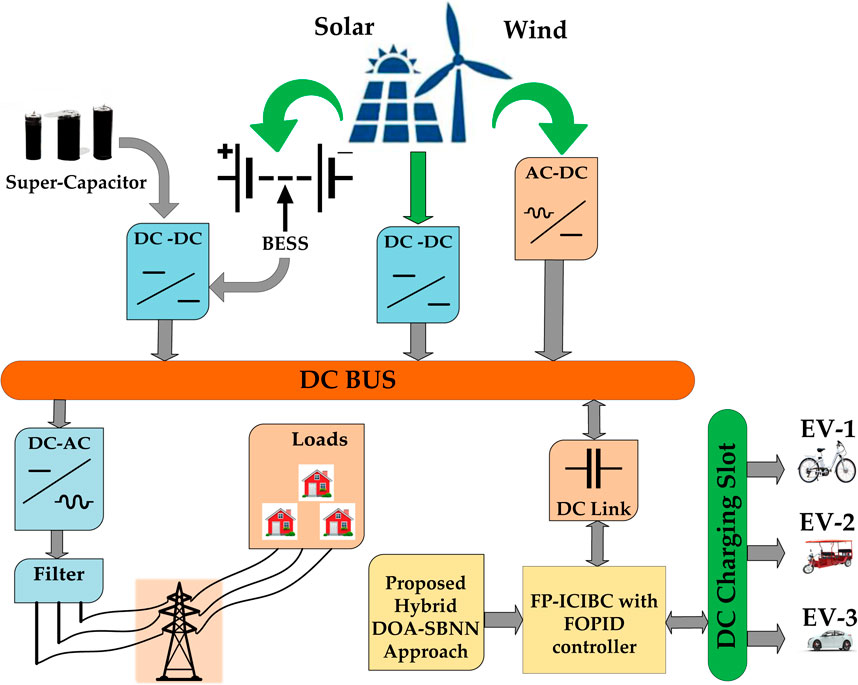
Figure 1. Structural diagram of an EV charging station with the hybrid system.
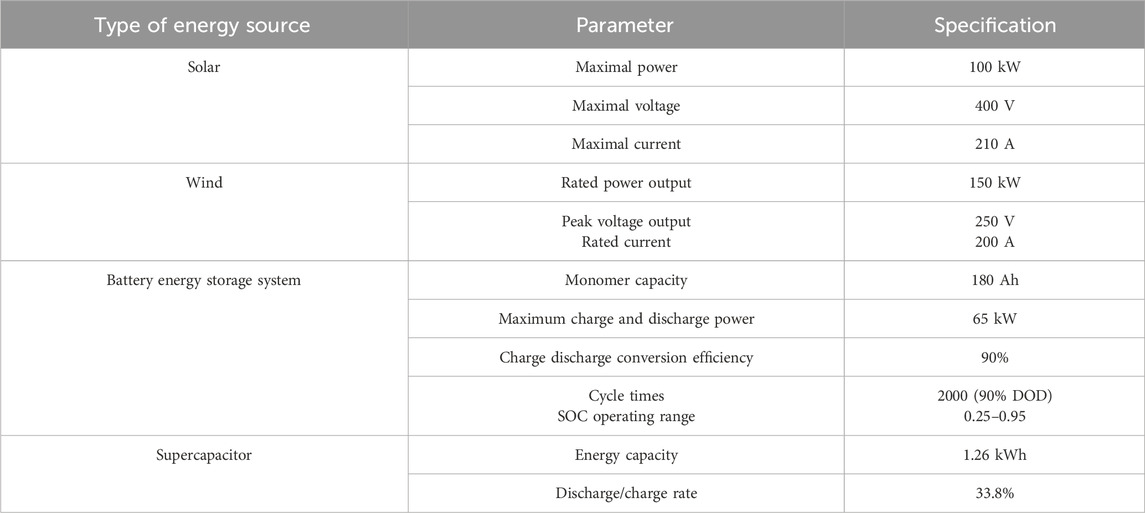
Table 1. List of energy sources used for building EVCSs.
In order to encourage energy independence and lessen dependency on the larger grid, the microgrid supports a range of AC loads and offers an electric vehicle DC charging slot. When designing a CS, a number of factors must be taken into consideration. These factors include (a) space allocated for battery-powered car parking, which dictates the largest number of vehicles that can be charged; (b) the need for fast-charging stations in a specific location; and (c) the nominal voltage and suitable power output at the common coupling point needed for the network. The proposed DOA–SBNN is combined with an FP-ICIBC to significantly reduce grid outages and enhance the efficiency, gain, and power quality of EV charging stations.
A schematic of the electric vehicle (Venkataraman, 2024) is shown in Figure 2. The essential parts employed in the design of EVs include geared systems made of metal, electric motors, driveshafts, transmissions, and storage gadgets such as central power electrical converters, battery packs, and chargers. It also features two converters: a DC bidirectional converter that controls the SOC of the battery system and a pulse-width modulation (PWM)-based converter that aids in regulating motor conditions.

Figure 2. Structure of an EV.
Photovoltaic modules (Singh S et al., 2022; Eswar and Doss, 2024), energy storage batteries, inverters, electric energy recording meters, and other equipment are the constituent components of the decentralized solar energy generating system. Factors like the relative humidity of the surrounding air, the amount of light present, and the power production in the PV panels under rated conditions affect their actual output power. Equation 1 is an expression of the power model.
Where
where
This section explains wind energy systems (Eswar et al., 2023; Ma et al., 2024). A key component of this energy system is a WT, which converts energy in two stages: first, depending on the wind’s availability, the wind speed is converted into mechanical force by the turbine blades; second, an electrical generator is utilized to create electricity (an induction or synchronous generator might be employed). An induction generator is preferred in this instance. Similarly, Stage 2’s gearbox arrangement converts into a high-speed shaft from a low-speed shaft. A pitch angle controller (PI/PID) was utilized to align the turbine blades with the WS, which functions with high reliability. The wind speed is measured with a wind vane. Equations 3, 4 provide numerical modeling of the WES for the cohort of torque and kinetic energy.
where
where
An energy storage system is an essential technological component in the deployment of decentralized green energy applications (Gopal and Reddy, 2023). Energy storage can help with several issues, namely, satisfying the need for substantial clean energy and grid access, sustaining and governing the output of green energy sources, and lowering the production of power variations. There are three states for a battery energy storage system: charge, discharge, and blackout. The most important condition is called SOC. Equations 5, 6 represent the mathematical modeling of the system.
Method of charging:
Method of discharging:
where
An SC operates in series with many cells to improve the amount of voltage in an electric vehicle charging station. A supercapacitor is made up of internal resistance and equivalent capacitance. Each cell is supplied with 2.7 V of energy, and a supercapacitor’s voltage is established by a fixed capacitor. The progression of the charge discharge action is illustrated through the electrical manner of the SC. The opposition of the SC is stated in Equation 7:
where
where
In a linear system, the fixed capacitor properties and specific voltage rating are defined by
. Equation 10 is used to compute the capacitance:
We vary the minimal voltage and initiating voltage according to the SC voltage. Inner series resistance and capacitance are characterized according to the SC’s efficiency, as shown in Equation 11:
where
Here, we will use an FP-ICIBC. Considering that the single-stage power converter lacks an energy buffer, the PV-wind hybrid system is linked in parallel with a large bank of electrolytic capacitors to mitigate the current ripple (Li, S et al., 2024) produced by the single-phase AC inverter. Standard methods for reducing the size of magnetic components in alternating current converters are closely coupled and loosely coupled inductors. In the interleaved circuit, the transformer and inductor principles are merged into a single core, resulting in inexpensive and magnetic losses within the design framework. An inductor is said to be strongly linked when one winding is positioned over the other. This work proposes an FP-ICIBC (Eswar et al., 2024) with some power control in both directions, considered exclusively for the continuous conduction mode. The architecture uses a four-stage interleaving technique and consists of a circuit with an input source, two linked inductors for energy storage, and four switching devices, four diodes, and two capacitors for the input and output. The amount of power that is regulated in DC/DC converters is determined by the duty cycle value; this is usually done to control the output current or the input/output voltage. Clearly, the optimal range for duty ratios is somewhere between 0.2 and 0.8, which is more than enough for most boost converter uses. The rise in the duty ratio corresponds to an increase in the current’s DC component, which is correlated with an increase in the AC component or ripple. Because there is a 90-degree electrical phase mismatch between the two circuits, the authors claim that the output current frequency increases by four. However, after superposition, the ripple goes down, as given in Equation 12:
where
where
where
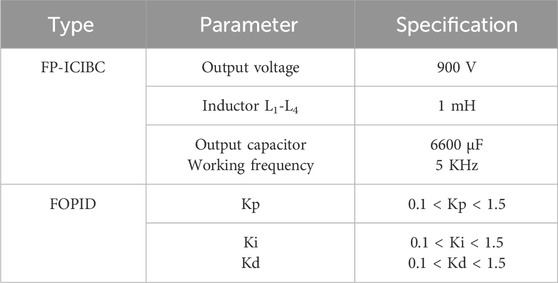
Table 2. FP-ICIBC and FOPID data.
The initial phase and gains of the controller are specified using a FOPID controller (Shalaby et al., 2023). To strike a balance between low oscillation and transient response, the values should be properly selected, as mentioned in Table 2. An increase in the fluctuations in the temporary state and a nearly linear response could result from a high value of the integral gain. FOPID is used to meet the voltage and current needs of the proposed FC-ICIBC, regardless of changes in the load and input voltages. This type of controller is more dependable and effective for use in high-power converters. Because there are no timing problems or computational lags because the device was constructed straight in the z-domain, system stability is increased. Employing the voltage control loop, we can generate the two variables—the output voltage and the inductor current to obtain the reference current for the inner current loop (also referred to as the outer loop). The current and voltage are obtained using the zero-order hold (ZOH) method. Making the digital controller Hz(s) in the z-domain is easy, following a process similar to the continuous-time frequency technique. Because the FC-ICIBC relies on voltage and current transfer functions, Equation 15 shows continuous-time transfer functions.
where
Electric vehicle charging with a microgrid system and renewable energy sources based on the proposed approach is described here. One possible strategy that merges DOA’s parallel performance with SBNN’s (Zammit-Mangion et al., 2024) is the DOA–SBNN method. Load demand prediction is another area where the SBNN finds relevance, whereas the DOA (Kaabneh et al., 2024) is adapted to control the fluctuations in a microgrid. SBNNs are essential for dynamic charging demands because they efficiently simulate changes in time and geographical dependencies in energy output and demand. This improves prediction accuracy and quantifies change. DOA enhances the optimization procedure by adeptly managing intricate solution domains, guaranteeing ideal positioning and functioning of charging stations while reducing charges and maximizing the use of renewable energy sources. These approaches work together to make microgrid environments more resilient, effective, and sustainable in terms of energy management. This eventually helps to integrate renewable energy sources and meet the increasing demand for EV systems. The details of the proposed technique are described as follows.
In this section, an SBNN is discussed to predict the EV load demand. The capacity of an SBNN to incorporate spatial dependencies and uncertainties into the forecasting model is an advantage when using it to predict EV load demand. In order to optimize infrastructure planning and energy management methods in electric car ecosystems, SBNNs can more correctly estimate demand and capture complicated spatial relationships among charging stations by integrating Bayesian inference. These models operate well in situations where spatial dependencies are important. They use neural networks to handle complicated, nonlinear interactions within data and Bayesian approaches to capture uncertainties. When predicting EV load demand, SBNNs can efficiently combine geographic data, meteorological trends, and past usage information to produce precise forecasts, as shown by Equation 16:
where
where
where
where
where
In this section, optimization using the DOA is discussed to control the fluctuations of a microgrid for ensuring seamless EV charging by optimizing several operating parameters. The Dollmaker Optimization algorithm may be used to successfully handle microgrid fluctuations and provide uninterrupted EV charging. To accomplish its goals in the context of an integrated microgrid with EV charging stations, the DOA would normally process the following steps: First, the algorithm initializes a population of solutions, each of which stands for a collection of control factors influencing the dynamics of EV charging and microgrid functioning.
Step 1:. Initialization
Initialize the input parameters of PV, wind, supercapacitor, battery energy storage systems, power maximum and minimum, boundary conditions, and iterations.
Step 2:. Random generation
The initialized populations are created by using random generation, which is described by Equation 21:
where
Step 3:. Fitness Function
The system’s fitness is determined by the objective function. Equation 22 can be used to determine the fitness function:
Step 4:. Phase1 for Pattern Fluctuation management
EV charging scheduling is the process of determining when it is best for EVs to charge in accordance with customer preferences, energy costs, and anticipated grid load. The goal of battery storage management is to regulate the cycles of charging and discharging energy storage devices, such as batteries, to mitigate oscillations brought on by sporadic renewable energy sources and fluctuating EV charging requirements. Optimizing the use of solar or wind energy generation within the microgrid while accounting for energy availability and weather forecasts is known as renewable energy integration. To reduce costs and keep the system stable, grid interaction strategies balance the import and export of electricity from the main grid and are given in Equation 23:
where
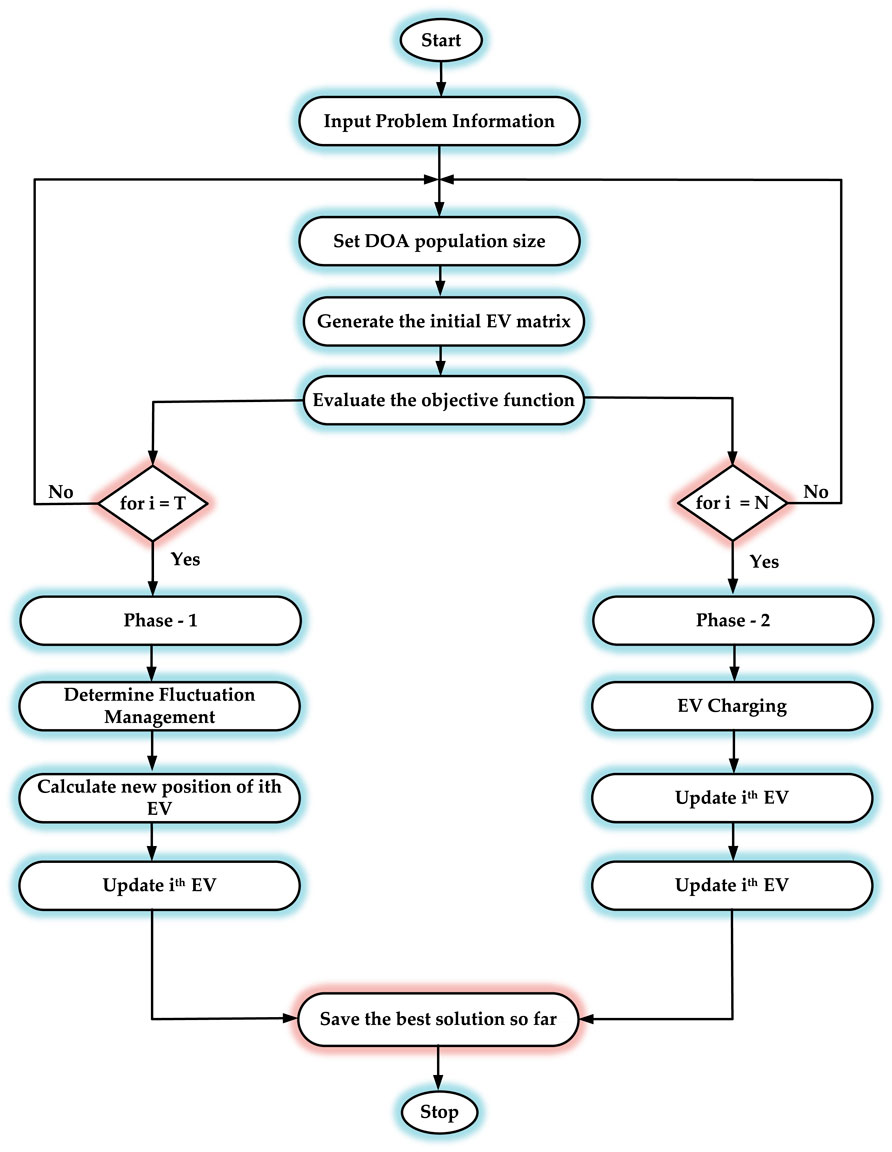
Figure 3. Flowchart of a DOA.
Step 5:. Phase2 for EV charging
The DMA uses its heuristic search mechanisms, which are modeled by Dollmaker behavior, to repeatedly refine solutions as it moves through the iterations. In order to ensure smooth operation while improving efficiency and reliability, this entails probabilistic adjustments and selection methods that seek to converge toward optimal or near-optimal configurations for microgrid management and EV charging. The DOA efficiently manages the many interdependencies in the microgrid environment through this iterative process, which helps to integrate EV charging into renewable energy microgrid systems in a sustainable and effective manner as given in Equation 24.
where
Step 6:. Termination Criteria
The termination requirements should be fulfilled, and the best possible outcome should be identified. If the criterion was met, proceed; otherwise, the process must be repeated.
Based on the results of the simulation, this section details how well the recommended technique performed. Using the DOA–SBNN approach, this article accelerated the charging of electric vehicles. The goal of the proposed technique is to help enhance the efficiency, gain, and power quality of the microgrid system and minimize the time of EV vehicle charging by utilizing a DOA–SBNN. Following being put into practice in MATLAB, the suggested approach’s performance is evaluated in comparison to the present approach. Various methods are used to examine the suggested strategy. The results indicate that current methods are inefficient compared to the suggested approach-based EV vehicle charging.
Figure 4 portrays the analysis of electricity exchange with current electricity pricing on the grid. The electricity price change simultaneously depends on the demand. It attains the highest price in the 20th hour.
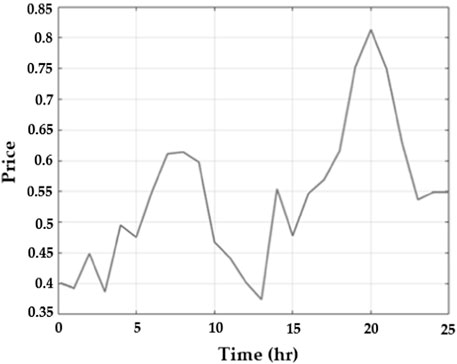
Figure 4. Demand of electricity pricing on the grid (y-axis) with reference to time (x-axis).
Figure 5 portrays the number of EVs and the power load. Figure 5A displays the number of electrical vehicles used per hour. The usage of EVs is low at the beginning. The usage of EVs reaches a peak of 13 EVs at the 20th hour, and then it suddenly drops at the 24th hour. Figure 5B displays the power load usage per hour. In the beginning, 200 power loads consume energy, and 400 power loads are used in the 3rd hour, which is the highest number of power loads in a given time.
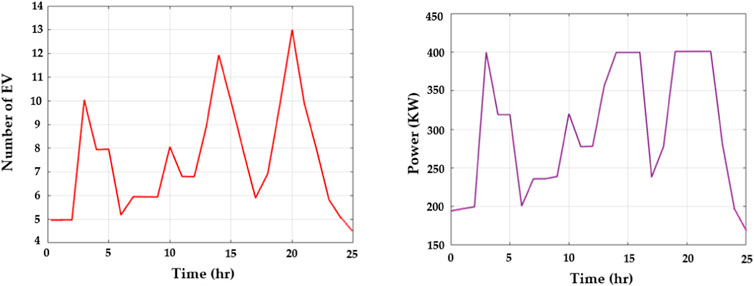
Figure 5. Number of (A) electric vehicles arriving for charging (y-axis) during a particular time (x-axis) and (B) the amount of load consumed (y-axis) and with respect to time (x-axis).
Figure 6 portrays an analysis of the output power of WT and PV. Figure 6A displays the output power of WT in kW per hour. The output power of wind turbines starts from 140 kW per hour and reaches the lowest range of 28 kW/h. At the 14th hour, the power rate is 25 kWh; at the 15th hour, the rate begins to increase, and it attains 150 kWh. Figure 6B displays the photovoltaic output power in kW per hour. The photovoltaic output power starts from 0 kW per hour and reaches the highest range of 100 kW/h. At the 14th hour, the power rate is 100 kWh, and at the 15th hour, the power rate begins to decrease until it reaches 0 kWh.
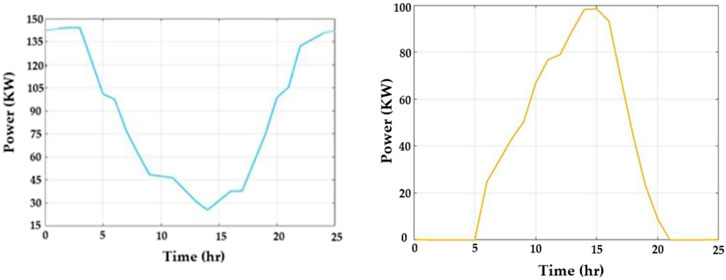
Figure 6. Output power of (A) amount and variation in wind power produced (y-axis) with reference to time (x-axis) and (B) the amount of power produced by photovoltaics (y-axis) with variation in time (x-axis).
Figure 7 portrays an analysis of the output power of BESS and the utility grid. Figure 7A displays the output power of BESS in kW per hour. The output power of BESS starts at 16 kW per hour and reaches the highest range of 55 kW/h. At the 15th hour, the power rate is 10 kWh; from the 7th hour, the power rate begins to attain negative values, and it reaches −40 kWh. Figure 7B displays the output power of the utility grid in kW per hour. The output power of the utility grid starts from −140 kW per hour and reaches the highest range of 150 kW/h at the 20th hour. At the 21st hour, the power rate starts to decrease until it reaches −120 kWh.
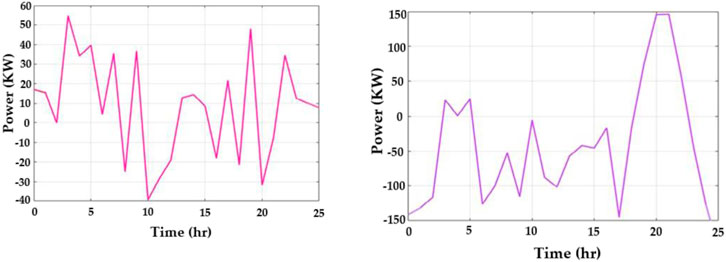
Figure 7. Output power of (A) amount of BESS power produced (y-axis) with reference to time (x-axis) and (B) the amount of power to the utility grid (y-axis) with variation in time (x-axis).
Figure 8 portrays the analysis of demand load with demand response (DR) in kWh. It starts at 200 kW, and the highest demand power reaches 400 kWh, and the lowest demand power is 200 kWh. From 16 h to 22 h, the DR attained a stable value.
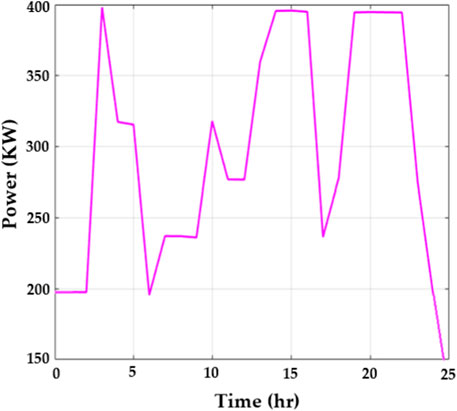
Figure 8. Amount of load demanded in kW (y-axis) with response to time in hr (x-axis).
Figure 9 portrays the result of the sensitivity analysis. Figure 9A displays the sensitivity analysis of wind. The fitness value of wind is in a decreasing phase from the beginning. As the weight of the objective increases, the wind speed increases as the battery life decreases. Concurrently, the shift in weights corresponds precisely with the shift in the objective functions’ values. Figure 9B displays the displays the sensitivity analysis of PV. The fitness value of PV increases from the beginning. A higher target weight results in a higher PV count and a lower battery count. Concurrently, the shift in weights corresponds precisely with the shift in the objective functions’ values.

Figure 9. Result of sensitivity analysis for (A) wind farm output energy and (B) solar irradiance with its particular fitness values.
Figure 10A portrays the total harmonic distortion (THD) analysis. A total harmonic distortion graph comparing an innovative approach to existing methods depicts the efficiency of various techniques for reducing harmonic distortion in electrical systems. When compared to existing approaches, the proposed DOA–SBNN approach consistently achieves lower THD values throughout a wide range of operating circumstances, demonstrating greater effectiveness in removing undesirable harmonics. This comparison is crucial for determining the efficacy and dependability of innovative ways to improve power quality, increase system stability, and lower energy losses in actual applications. The proposed DOA–SBNN attains 19.09%, 25.85%, and 31.17% lower THD when compared with existing MMOSSA, MOGWO, and MSO methods, respectively.
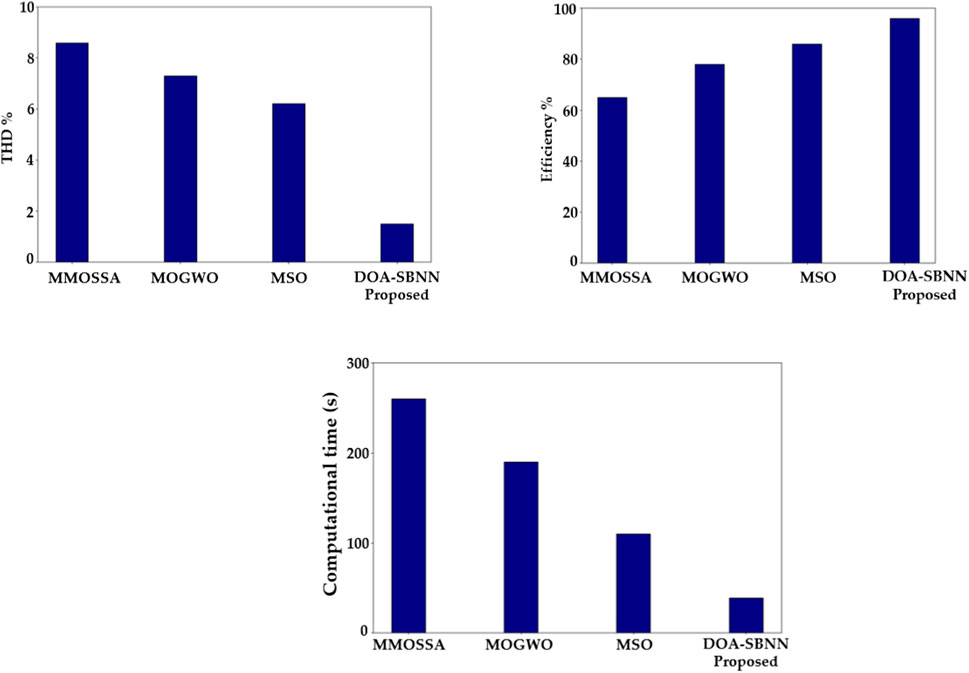
Figure 10. Parameters: (A) THD value analysis, (B) efficiency analysis, and (C) computational time (y-axis) compared with various techniques (x-axis).
Figure 10B portrays the efficiency analysis. An efficiency graph comparing the proposed DOA–SBNN method to existing methods shows the performance gains obtained by the new approach. The graph displays qualities like processing time, accuracy, and erroneous rates. The proposed DOA–SBNN method improves processing speed; the graph shows that tasks take less time to complete than with prior strategies. Overall, the graph depicts how the proposed technology DOA–SBNN outperforms existing alternatives, emphasizing its benefits and potential influence. The proposed DOA–SBNN attains 19.19%, 26.15%, and 32.57% higher efficiency than existing MMOSSA, MOGWO, and MSO methods, respectively.
Figure 10C portrays the computational time analysis. Comparing a proposed method’s computational time against existing methods is critical for determining its efficiency and applicability. This involves developing a graph that depicts the time required by each approach to execute specified tasks or procedures. The proposed DOA–SBNN method has a lower processing time, suggesting better performance. The x-axis of the graph indicates methods, while the y-axis displays processing time in seconds or milliseconds. The proposed method has a large reduction in time, as seen by lower values on the y-axis than existing approaches, illustrating its superiority in speed and efficiency. This comparison is critical for determining the efficacy of the proposed DOA–SBNN method in real-world applications. The proposed DOA–SBNN method attains 18.99%, 26.85%, and 32.17% lower computational time when compared with existing MMOSSA, MOGWO, and MSO methods, respectively.
Figure 11A displays the step response of robustness. MOGWO has the highest robustness of all the examined designs, at 89%, followed by MMOSSA at 78%. The suggested DOA–SBNN design has the lowest robustness at 29%, whereas MSO exhibits a robustness of 58%.
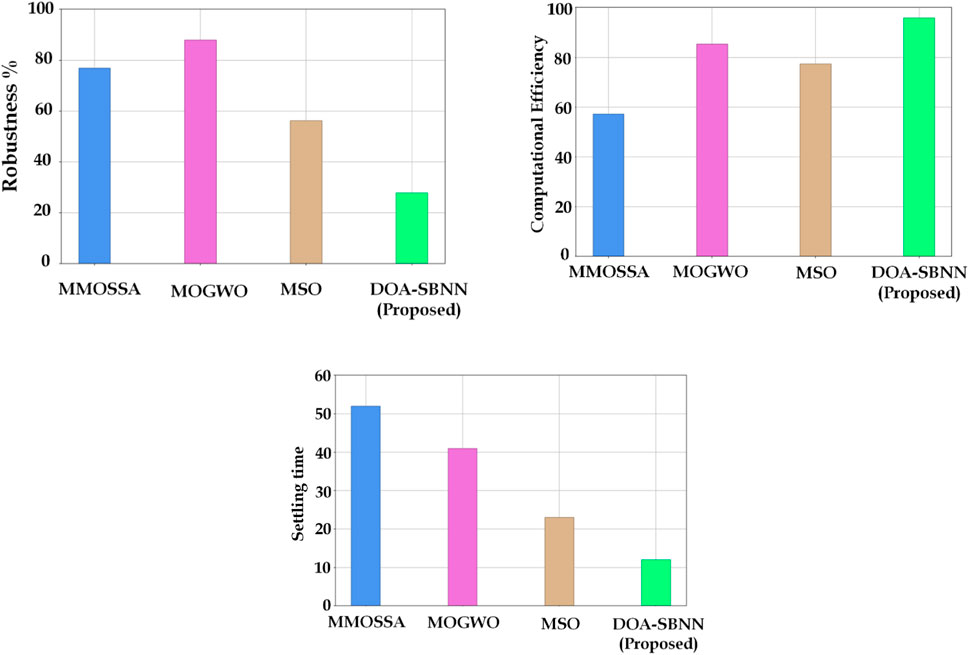
Figure 11. Various parameters for performance analysis: (A) robustness, (B) computational efficiency, and (C) settling time listed (y-axis) compared with various techniques (x-axis).
Figure 11B displays the step response of computational efficiency. The graph indicates that the DOA–SBNN method achieves the highest computational efficiency result at 95%, followed by MOGWO at 85%, MSO at 78%, and MMOSSA at 58%. This suggests that the most effective algorithm for microgrid system optimization with renewable energy sources and electric vehicle charging stations is DOA–SBNN.
Figure 11C displays the step response of settling time. The amount of time the system takes to return to a stable condition following a disturbance is known as the settling time. The suggested DOA–SBNN algorithm has the lowest settling time (12 s), followed by MSO (22 s), MOGWO (41 s), and MMOSSA (52 s). This suggests that the DOA–SBNN algorithm is the most effective in terms of settling time, which is essential for guaranteeing the microgrid system’s stability and dependability.
The Table 3 uses a benchmark function to show how well the suggested DOA–SBNN approach performs in comparison to other algorithms (MMOSSA, MOGWO, and MSO). With a best value of 5.8688 × 10⁻⁴⁰, the DOA–SBNN demonstrates competitive performance; however, MSO outperforms it in terms of both best and worst outcomes. In contrast to the other approaches, the DOA–SBNN exhibits stability and reliability, as demonstrated by its minimal standard deviation and consistent performance throughout numerous runs, as indicated by the median and mean values.
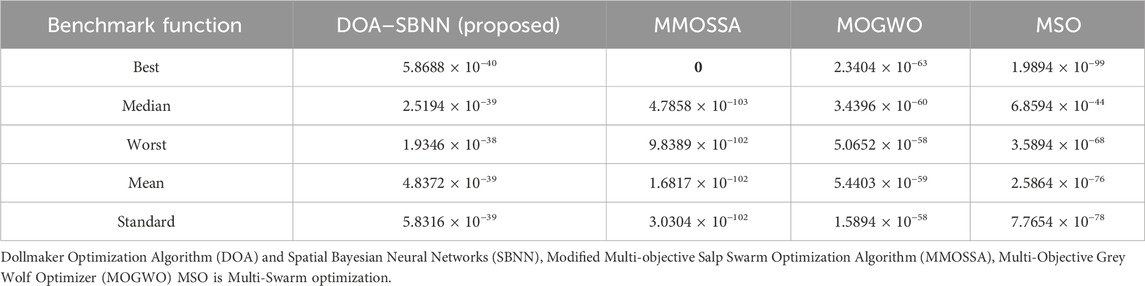
Table 3. Comparison of benchmark functions.
Harmonics and power quality issues arise when integrating electric vehicle charging stations into microgrids. Harmonic voltage distortion can reduce equipment reliability and performance. The suggested DOA–SBNN strategy reduces THD values by 19.09% compared to MMOSSA, 25.85% compared to MOGWO, and 31.17% compared to MSO. This reduction is significant because THD levels above 5% can cause transformers to overheat, often to temperatures above 90°C, costing 15%–30% more energy. Due to high harmonic distortion, sensitive equipment might malfunction, break down, and lose its productivity. Addressing these issues requires advanced filtering techniques. Active power filters can reduce total harmonic distortion to less than 5%, whereas passive filters handle frequency components to minimize voltage distortion. Using a four-phase inductor-coupled interleaved boost converter (FP-ICIBC) helps stabilize the output voltage. Normal output voltage starts at 900 V and stabilizes at 800 V. The system can maintain 290 kW of output power, ensuring reliable energy delivery. Control reaction times are faster with a FOPID controller because the steady-state error is less than 1% and overshoots are less than 5%. Maintaining THD limits improves the EV charging system’s reliability and efficiency. Power quality and microgrid energy management are improved by the DOA–SBNN hybrid method, boosting green transportation.
Figure 12 portrays the voltage, current, and power analysis of the FC-ICIBC. Figure 12A displays the output voltage of the FP-ICIBC in volts per second. The voltage starts from 900 V, and it has a decreasing phase. Finally, the voltage attains 800 V. Figure 12B displays the input current of the FP-ICIBC in amperes per second. The current starts from 700 A, and at the 5th s, the current attains 600 A. Figure 12C displays the output power of FP-ICIBC in kW/s, which is maintained at 290 kW during the time.
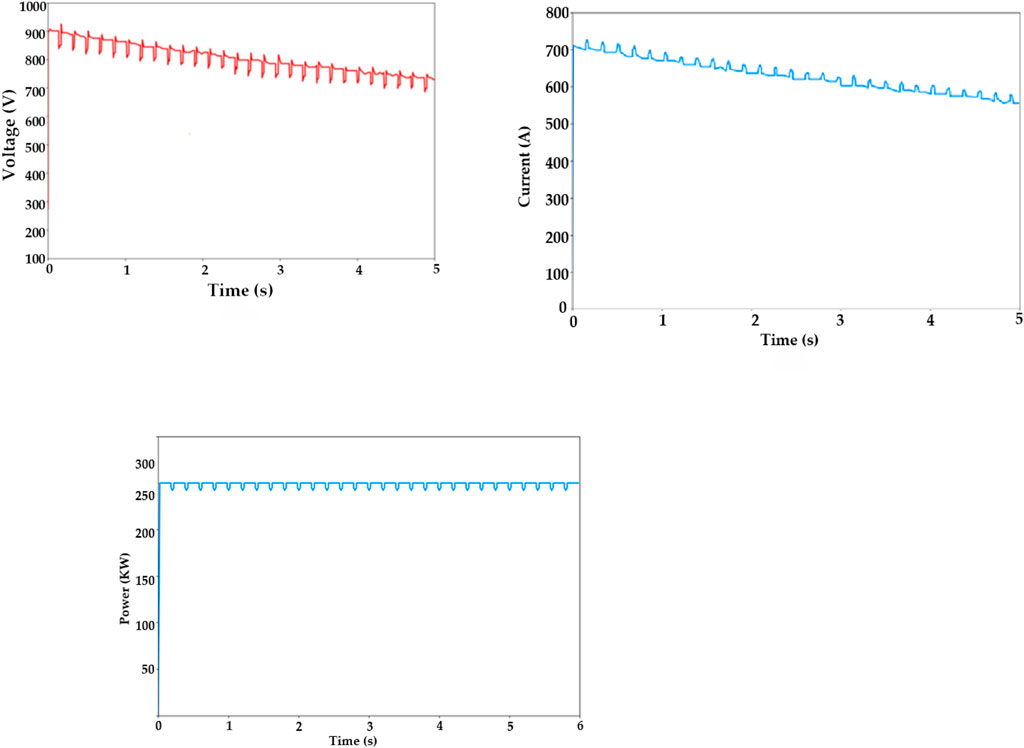
Figure 12. (A) Voltage, (B) current, and (C) power output waveforms of the FC-ICIBC (y-axis) with respect to time (x-axis).
Figure 13A portrays the FOPID controller parameters analysis. Ki, Kp, and Kd are the three main parameters of the controller. DC is given as the main input of the controller. Figure 13B shows the step response of the electric vehicle charging system. The proposed DOA–SBNN controller is adequate for generating FOPID controller parameters with good control response. The DOA–SBNN controller responds quickly, with minimal overshoot and steady-state accuracy.
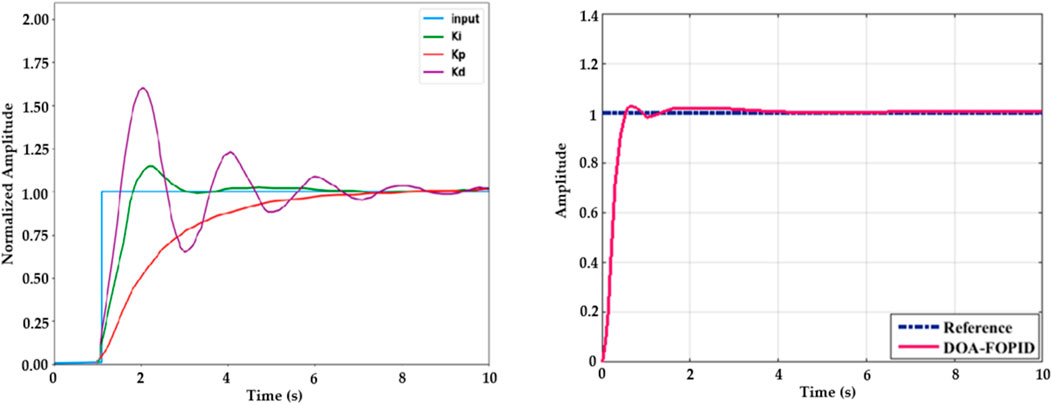
Figure 13. (A) FOPID controller parameter analysis and (B) step-wise response of an EV charging system.
This study suggests an effective control scheme for the FP-ICIBC that raises an EV charging station’s efficiency, dependability, and gain factor. By employing the interleaving technique, the suggested converter can function in all appropriate combinations while keeping the converter parameters constant during the charging mode. When the controlling approach is utilized to construct the inner current and outer voltage loops, a FOPID controller is employed. Benefits like less timing and computational problems make this controller a good option, contributing to the system’s increased stability. The state of charge of the battery determines how the converter’s phases work. This method achieves maximum battery charge in an hour by analyzing and simulating various electric vehicle outcomes. The suggested converter is the way of the future for the EV sector in the case of an urgent requirement for charging; it can be considered a powerful substitute for real EV applications.
This paper proposes an innovative approach for microgrid systems to EVCSs integrated with RES–DOA–SBNN. When integrating solar or wind power into the microgrid, the system’s performance may fluctuate depending on the amount of renewable energy generated depending on weather or seasonal variations. However, peak demand periods may put stress on the system. It is also believed that the demand for electric vehicle charging will match the energy supply. Limitations include the need to balance supply and demand in real time, particularly during grid isolation, and the potentially high initial costs of the infrastructure. The efficiency, gain, and power quality of the microgrid system will be enhanced by utilizing the proposed method. The improved performance of the microgrid system can be attributed to the low THD values. Moreover, the method maximizes the use of renewable energy sources in EVs, addresses a range of concerns, and promotes the broader adoption of EVs.
The proposed approach has been examined in a variety of contexts, including optimum and random scheduling, as well as a complex DOA algorithm. Several existing methods are compared to the suggested one and evaluated on the MATLAB platform. From the results, it is concluded that the operating THD of the proposed approach is approximately 10% less than existing techniques. It also assures numerical results and long-term performance stability. The results also show that the projected method achieves notably optimal performance compared to the other optimization methods.
Potential future contributions in this research domain include uncertainty modeling of renewable generation, different testing networks, incorporating fast-charging stations, and modeling the uncertainty of load demand. Studies should also concentrate on guaranteeing a stable power supply and improved energy storage solutions. Studies could examine how machine learning algorithms might improve renewable energy integration and microgrid predictive maintenance.
Incorporating stakeholders and policies, this study leverages local data with larger market applicability to provide a versatile model. At its core, the hybrid model factors in the attractiveness of green cars, including their life cycle analysis cost, range of travel, refueling time, and charging costs, which further improves rapid EV advancement. Due to the imitator lag, financial policies, especially subsidies, are effective in increasing EV adoption but fail to achieve desired sales. Policymakers intend to motivate more solar power plants and expedite the shift to renewable energy by offering an acceptable price.
The raw data supporting the conclusions of this article will be made available by the authors, without undue reservation.
KS: conceptualization, formal analysis, investigation, methodology, resources, software, writing–original draft, writing–review and editing, and visualization. MD: data curation, investigation, project administration, supervision, validation, visualization, writing–review and editing, and resources. MS: conceptualization, data curation, formal analysis, funding acquisition, resources, software, validation, and writing–review and editing. AE: data curation, funding acquisition, investigation, project administration, visualization, formal analysis, and writing–review and editing.
The author(s) declare financial support was received for the research, authorship, and/or publication of this article. This research was funded by Taif University, Taif, Saudi Arabia, Project Number TU-DSPP-2024-50.
The authors extend their appreciation to Taif University, Saudi Arabia, for supporting this work through project number TU-DSPP-2024-50.
The authors declare that the research was conducted in the absence of any commercial or financial relationships that could be construed as a potential conflict of interest.
All claims expressed in this article are solely those of the authors and do not necessarily represent those of their affiliated organizations, or those of the publisher, the editors and the reviewers. Any product that may be evaluated in this article, or claim that may be made by its manufacturer, is not guaranteed or endorsed by the publisher.
AC, alternating current; BESS, battery energy storage systems; CS, charging stations; DC, direct current; DOA, Dollmaker Optimization Algorithm, DNN, deep neural network; EV, electric vehicle; FP-ICIBC, four-phase inductor coupled interleaved boost converter; FOPID, fractional-order proportional integral controller; MG, microgrid; MMOSA, Modified Multi-objective Salp Swarm Optimization algorithm; MOGWO, Multi-Objective Gray Wolf Optimizer; PI, proportional integral; PID, proportional integral derivative; PV photovoltaic; PWM, pulse width modulation; RES, renewable energy source; SBNN, spatial Bayesian neural networks; SC, supercapacitor; SoC, state of charge; SOA, Snake optimization algorithm; THD, total harmonic distortion; VSG, virtual synchronous generator; WT, wind turbine.
Abid, M. S., Ahshan, R., Al Abri, R., Al-Badi, A., and Albadi, M. (2024). Techno-economic and environmental assessment of renewable energy sources, virtual synchronous generators, and electric vehicle charging stations in microgrids. Appl. Energy 353, 122028. doi:10.1016/j.apenergy.2023.122028
Ali, A., Mahmoud, K., and Lehtonen, M. (2022). Optimal planning of inverter-based renewable energy sources towards autonomous microgrids accommodating electric vehicle charging stations. IET Generation, Transm. and Distribution 16, 219–232. doi:10.1049/gtd2.12268
Behera, S., Das, S., Ganesh Pardhu, B. S. S., Vais, R. I., Babu, N. R., Bhagat, S. K., et al. (2024). A comprehensive study on energy management, sensitivity analysis, and inertia compliance of feed-in tariff in IEEE bus systems with grid-connected renewable energy sources. Heliyon 10, e36927. doi:10.1016/j.heliyon.2024.e36927
Chattopadhyay, A., and Kar, S. IDEAS: information-driven EV admission in charging station considering user impatience to improve QoS and station utilization. 2024.
Duan, Y., Zhao, Y., and Hu, J. (2023). An initialization-free distributed algorithm for dynamic economic dispatch problems in microgrid: modeling, optimization and analysis. Sustain. Energy, Grids Netw. 34, 101004. doi:10.1016/j.segan.2023.101004
Eswar, K. N. D. V. S., and Doss, M. A. N. (2024). “Implementation of renewable sources for designing EV charging station with hybrid storage device as reserve source,” in Flexible electronics for electric vehicles. FLEXEV 2022. Lecture notes in electrical engineering. Editors S. K. Goyal, D. K. Palwalia, R. Tiwari, and Y. Gupta (Springer), 1065, 315–328. doi:10.1007/978-981-99-4795-9_30
Eswar, K. N. D. V. S., Doss, M. A. N., Alruwaili, M., and Abdelfattah, W. M. (2024). Implementation of a microgrid system with a four-phase inductor coupled interleaved boost converter for EV charging stations. Energies 17, 2277. doi:10.3390/en17102277
Eswar, K., Doss, M., and Jayapragash, J. (2023). “Design of zeta converter integrated with renewable source PV and hybrid energy storage systems for industrial/domestic applications,” in Sustainable energy and technological advancements. ISSETA 2023. Advances in sustainability science and technology. Editors G. Panda, H. H. Alhelou, and R. Thakur (Singapore: Springer).
Fendzi Mbasso, W., Naoussi, S. R. D., Molu, R. J. J., Saatong, K. T., and Kamel, S. (2023). Technical assessment of a stand-alone hybrid renewable system for energy and oxygen optimal production for fishes farming in a residential building using HOMER pro, Clean. Eng. Technol.
Gopal, S. M., and Reddy, K. M. (2023). Design and control of high voltage gain interleaved boost converter for fuel cell based electric vehicle applications. J. Electron Comput. Netw. Appl. Math., 9–24. doi:10.55529/jecnam.32.9.24
Guo, X., Zhu, D., Hu, J., Zou, X., Kang, Y., and Guerrero, J. M. (2023). Inertial PLL of grid-connected converter for fast frequency support. CSEE J. Power Energy Syst.
Hussain, S., Irshad, R. R., Pallonetto, F., Jan, Q., Shukla, S., Thakur, S., et al. (2023). Enhancing the efficiency of electric vehicles charging stations based on novel fuzzy integer linear programming. IEEE Trans. Intelligent Transp. Syst. 24, 9150–9164. doi:10.1109/tits.2023.3274608
Ju, Y., Liu, W., Zhang, Z., and Zhang, R. (2022). Distributed three-phase power flow for AC/DC hybrid networked microgrids considering converter limiting constraints. IEEE Trans. Smart Grid 13, 1691–1708. doi:10.1109/tsg.2022.3140212
Kaabneh, K., AbuFalahah, I., Eguchi, K., Gochhait, S., Leonova, I., Montazeri, Z., et al. (2024). Dollmaker optimization algorithm: a novel human-inspired optimizer for solving optimization problems. Int. J. Intelligent Eng. and Syst.
Kazemtarghi, A., Mallik, A., and Chen, Y. (2024). Dynamic pricing strategy for electric vehicle charging stations to distribute the congestion and maximize the revenue. Int. J. Electr. Power and Energy Syst. 158, 109946. doi:10.1016/j.ijepes.2024.109946
Kumar, V. M., Bharatiraja, C., Elrashidi, A., and AboRas, K. M. (2024). Chaotic harris hawks optimization algorithm for electric vehicles charge scheduling. Energy Rep. 11, 4379–4396. doi:10.1016/j.egyr.2024.04.006
kumar Saha, S., and Biswas, S. (2023). “Analysis of the performance of a DG microgrid based on fuel cells,” in Renewable Resources and energy management.
Li, S., Zhou, J., Zhou, F., Niu, F., and Deng, W. (2024). A reduced current ripple overmodulation strategy for indirect matrix converter. IEEE Trans. Industrial Electron., 1–10. doi:10.1109/tie.2024.3453934
Liang, J., Feng, J., Lu, Y., Yin, G., Zhuang, W., and Mao, X. (2024). A direct yaw moment control framework through robust T-S fuzzy approach considering vehicle stability margin. IEEE/ASME Trans. Mechatronics 29, 166–178. doi:10.1109/tmech.2023.3274689
Ma, K., Yang, J., and Liu, P. (2020). Relaying-assisted communications for demand response in smart grid: cost modeling, game strategies, and algorithms. IEEE J. Sel. Areas Commun. 38, 48–60. doi:10.1109/jsac.2019.2951972
Ma, Y., Zhu, D., Hu, J., Liu, R., Zou, X., and Kang, Y. (2024). Optimized design of demagnetization control for DFIG-based wind turbines to enhance transient stability during weak grid faults. IEEE Trans. Power Electron. 40, 76–81. doi:10.1109/tpel.2024.3457528
Mbasso Wulfran, F., Raoul, D. N. S., Reagan Jean Jacques, M., Tsobze Saatong, K., and Kamel, S. (2023). A case study of a neighborhood in Douala examining the technical feasibility of a hybrid renewable energy system connected to the grid for energy and oxygen production in the fight against respiratory diseases. Sol. Compass 8, 100062. doi:10.1016/j.solcom.2023.100062
Meng, Q., Hussain, S., Luo, F., Wang, Z., and Jin, X. (2024a). An online reinforcement learning-based energy management strategy for microgrids with centralized control. IEEE Trans. Industry Appl., 1–10. doi:10.1109/tia.2024.3430264
Meng, Q., Tong, X., Hussain, S., Luo, F., Zhou, F., Liu, L., et al. (2024b). Revolutionizing photovoltaic consumption and electric vehicle charging: a novel approach for residential distribution systems. IET Generation, Transm. and Distribution 18, 2822–2833. doi:10.1049/gtd2.13232
Nafeh, A. E. S. A., Omran, A. E. F. A., Elkholy, A., and Yousef, H. M. (2024). Optimal economical sizing of a PV-battery grid-connected system for fast charging station of electric vehicles using modified snake optimization algorithm. Results Eng. 21, 101965. doi:10.1016/j.rineng.2024.101965
Pourvaziri, H., Sarhadi, H., Azad, N., Afshari, H., and Taghavi, M. (2024). Planning of electric vehicle charging stations: an integrated deep learning and queueing theory approach. Transp. Res. Part E 186, 103568. doi:10.1016/j.tre.2024.103568
Puech, A., Rigaut, T., Templier, W., and Tournoud, M. (2024). Controlling large electric vehicle charging stations via user behavior modeling and stochastic programming.
Schoenberg, S., and Dressler, F. (2022). “Reducing waiting times at charging stations with adaptive electric vehicle route planning,”. IEEE Transactions on Intelligent Vehicles.
Shalaby, R., El-Hossainy, M., Abo-Zalam, B., and Mahmoud, T. A. (2023). Optimal fractional-order PID controller based on fractional-order actor-critic algorithm. Neural Comput. Appl. 35, 2347–2380. doi:10.1007/s00521-022-07710-7
Sharida, A., Bayhan, S., and Abu-R, H. (2024). Enhancing scalability of fast electric vehicle charging stations: solutions for AC-DC side integration and regulation. IEEE Open J. Industrial Electron. Soc.
Shirkhani, M., Tavoosi, J., Danyali, S., Sarvenoee, A. K., Abdali, A., Mohammadzadeh, A., et al. (2023). A review on microgrid decentralized energy/voltage control structures and methods. Energy Rep. 10, 368–380. doi:10.1016/j.egyr.2023.06.022
Singh, S., Vaidya, B., and Mouftah, H. T. (2022). Smart EV charging strategies based on charging behavior. Front. Energy Res. 10. doi:10.3389/fenrg.2022.773440
ur Rehman, W., Bo, R., Mehdipourpicha, H., and Kimball, J. (2021). in 2021 IEEE power and energy society general meeting (PESGM) (IEEE). July. Sizing energy storage system for energy arbitrage in extreme fast charging station.
Venkataraman, V. (2024). “Energy management of hybrid energy storage system in electric vehicle using hybrid methodology,” in Australian journal of electrical and electronics engineering.
Yaghoubi, E., Yaghoubi, E., Khamees, A., Razmi, D., and Lu, T. (2024). A systematic review and meta-analysis of machine learning, deep learning, and ensemble learning approaches in predicting EV charging behavior. Eng. Appl. Artif. Intell. 135, 108789. doi:10.1016/j.engappai.2024.108789
Zammit-Mangion, A., Kaminski, M. D., Tran, B. H., Filippone, M., and &Cressie, N. (2024). Spatial Bayesian neural networks. Spat. Stat. 60, 100825. doi:10.1016/j.spasta.2024.100825
Zhang, B., Zhao, M., and Hu, X. (2023). Location planning of electric vehicle charging station with users’ preferences and waiting time: multi-objective bi-level programming model and HNSGA-II algorithm. Int. J. Prod. Res. 61, 1394–1423. doi:10.1080/00207543.2021.2023832
Keywords: battery energy storage systems, charging stations, electric vehicles, fuel cells, four–phase inductor coupled interleaved boost converter, photo voltaic, renewable energy sources and wind turbine
Citation: Sai Eswar KNDV, Arun Noyal Doss M, Shorfuzzaman M and Elrashidi A (2025) Microgrid system for electric vehicle charging stations integrated with renewable energy sources using a hybrid DOA–SBNN approach. Front. Energy Res. 12:1492243. doi: 10.3389/fenrg.2024.1492243
Received: 06 September 2024; Accepted: 02 December 2024;
Published: 07 January 2025.
Edited by:
Xiaoyi Ding, Xi’an University of Technology, ChinaReviewed by:
Rajeev Kumar, KIET Group of Institutions, IndiaCopyright © 2025 Sai Eswar, Arun Noyal Doss, Shorfuzzaman and Elrashidi. This is an open-access article distributed under the terms of the Creative Commons Attribution License (CC BY). The use, distribution or reproduction in other forums is permitted, provided the original author(s) and the copyright owner(s) are credited and that the original publication in this journal is cited, in accordance with accepted academic practice. No use, distribution or reproduction is permitted which does not comply with these terms.
*Correspondence: M. Arun Noyal Doss, YXJ1bm5veWFsQGdtYWlsLmNvbQ==; Ali Elrashidi, YS5lbHJhc2hpZGlAdWJ0LmVkdS5zYQ==
Disclaimer: All claims expressed in this article are solely those of the authors and do not necessarily represent those of their affiliated organizations, or those of the publisher, the editors and the reviewers. Any product that may be evaluated in this article or claim that may be made by its manufacturer is not guaranteed or endorsed by the publisher.
Research integrity at Frontiers
Learn more about the work of our research integrity team to safeguard the quality of each article we publish.