- School of Power Engineering, Nanjing Institute of Technology, Nanjing, China
Addressing issues such as high hardware costs, low recognition accuracy, and the inability to achieve fine-grained equipment classification, a non-invasive load fine-grained recognition system based on FPGA was developed and tested on a Linux system for online training. A three-dimensional (3D) image construction method based on color coding of voltage–current (V-I) trajectories is proposed to preprocess the collected voltage and current data, allowing for the distinction of features of various electrical equipment in multiple dimensions. First, high-frequency sampling data is preprocessed to extract the V-I trajectory and higher harmonic characteristics of the load. Then, the V-I trajectory is processed using RGB color coding and fused with higher-order harmonic features to construct a 3D image. This results in a 3D color V-I trajectory image that incorporates both color and harmonic features. Finally, the improved ResNet50 network is employed to identify the load characteristics, and the method is validated using the PLAID dataset and measured data. The load identification method achieves an accuracy rate of over 98%, enhancing the information conveyed by the V-I trajectory and improving the uniqueness of load characteristics, thereby enabling fine-grained equipment identification. This advancement holds significant implications for energy conservation and emission reduction in household electricity consumption, as well as for eliminating potential safety hazards associated with electrical equipment.
1 Introduction
Non-Intrusive Load Monitoring (NILM) has been a prominent research focus in the fields of smart grids and smart homes since its introduction by Hart (1992) and others in the 1980s. NILM technology analyzes the total electrical energy usage data of a building to infer the energy consumption patterns and operating statuses of individual appliances without the need for specialized measuring equipment on each device. This monitoring technology is significant for energy conservation, power system management, and user behavior analysis (Chen S. et al., 2023; Ghosh et al., 2021). With the intensification of the global energy crisis and the growing awareness of environmental protection, improving energy efficiency has become a universal societal goal. In this context, NILM has emerged as a powerful tool for fine-grained energy monitoring due to its advantages of easy installation, low cost, and minimal intrusion. Real-time monitoring and intelligent analysis of the total energy signal in residential or industrial environments can help users understand and manage their energy consumption. Moreover, it provides data support for load forecasting and demand-side management for power companies (Jia et al., 2021).
However, despite the concept of NILM technology being proposed many years ago, its practical application still faces numerous challenges. The diversity of household appliances and the complexity of usage patterns create difficulties in load disaggregation. Additionally, subtle differences in the electrical characteristics of different brands and models of appliances increase the identification difficulty. The parallel use of multiple appliances further complicates signal separation. Thus, accurately identifying the operating state of each appliance from the complex total load signal has become the core issue in NILM research (Yang et al., 2020; Yang et al., 2021). In recent years, advancements in machine learning and big data analysis technologies have brought new opportunities to the NILM field. Deep learning methods, particularly convolutional neural networks (CNN) and recurrent neural networks (RNN), have demonstrated excellent performance in handling nonlinear and non-stationary signals (Yin et al., 2021; De et al., 2019; Liu et al., 2019; Zhang et al., 2018). Their strengths in feature extraction and pattern recognition offer new solutions for appliance identification and load separation in NILM.
At present, Non-Intrusive Load Monitoring technology primarily relies on identifying the unique characteristics of power loads. By leveraging these characteristics alongside advanced classification technologies such as deep learning and neural networks, NILM can effectively classify different power loads. The V-I trajectory method, first proposed in the literature (Cheng et al., 2016), diverges from traditional load characteristic methods that are limited to voltage-current waveforms, offering a novel approach for load characteristic extraction. In literature (Baets et al., 2017), the contour of the V-I trajectory is analyzed, and contour features are extracted. Literature (Lam et al., 2007) represents the physical properties of V-I trajectories by analyzing their shape features and classifies these extracted features using hierarchical clustering methods. In literature (Du et al., 2016), loads are divided into seven main types, such as resistive and impedance loads. By comparing the differences in V-I trajectories among these categories, a rapid method for measuring load harmonics is developed, utilizing Self-Organizing Maps (SOM) to classify different loads based on features extracted from V-I trajectories. In literature (Shi et al., 2023), three pixel matrices representing current, voltage, and phase were constructed, and their numerical features were integrated into a grayscale V-I trajectory to create a composite color V-I trajectory image. Using the AlexNet network for deep feature learning of these color images significantly improves load detection accuracy. However, this method involves high-resolution pixelation of V-I trajectories, making it difficult to capture higher-order harmonic characteristics of the current waveform. Based on Fryze theory, literature (Liu et al., 2019) developed voltage and reactive current trajectories, integrating other load attributes through color coding. However, this method does not incorporate power information, limiting the trajectory’s ability to reflect the device’s power characteristics. The fusion of power features in literature (Chen et al., 2020; Wang et al., 2020a) is achieved through Gram matrix transformation, which increases the diversity of load features and enhances convolutional neural networks. By combining the Convolutional Block Attention Module (CBAM) with CNN, a non-intrusive load recognition model is developed, improving load recognition capabilities. Despite advancements in load recognition technology based on V-I trajectories, several challenges remain. Two-dimensional V-I trajectory images primarily convey shape information and fail to adequately represent details such as power and harmonic characteristics of the equipment. Additionally, due to the large variety of appliances and similar working principles, the V-I trajectory characteristics between different loads may overlap, which cannot meet the needs of fine-grained classification of equipment.
To address the aforementioned problems, this paper proposes a non-invasive fine-grained load identification method based on 3D V-I trajectory imaging. For the first time, a 3D image construction method is employed to preprocess the collected voltage and current data, thereby enhancing the uniqueness of load characteristics. This method improves the red (R), green (G), and blue (B) three-channel pixel matrix of V-I color images and integrates higher-order harmonic features into the third dimension of the image. This integration aims to minimize the overlap of V-I trajectories among different loads, meeting the requirements for fine-grained load classification. The preprocessed data is then input into a ResNet50 network enhanced with a Convolutional Block Attention Module to complete load identification. This approach leverages the powerful advantages of CBAM in image classification, significantly improving load recognition accuracy. Furthermore, a non-invasive load recognition hardware system based on FPGA is designed to collect and preprocess power data, demonstrating the practical feasibility of the load recognition method. This innovative method not only achieves an enhanced accuracy in load recognition but also supports the fine-grained classification of electrical equipment, which is crucial for energy saving, emission reduction, and the elimination of potential safety hazards in household electrical systems.
2 Data preprocessing and 3D image construction
2.1 Data acquisition and preprocessing
In household electricity monitoring, total current and voltage data can be obtained through smart meters and other high-frequency sampling equipment. According to the literature (Song and Zhang, 2023a; Lu et al., 2023), to collect data from various electrical devices, this study assumes that only one state change of an electrical load (i.e., a switching event) occurs at any given time.
Based on the analysis in the literature (Wang and Sun, 2023), this paper first collects current and voltage waveform data before and after the switching event to cover several complete cycles. To improve the accuracy of data acquisition, the data are interpolated. Since the voltage waveform typically approximates a standard sine wave, linear interpolation is applied to the voltage data to simplify the calculation process. In contrast, the current waveform often deviates from the sinusoidal shape due to sudden changes during the operation of the electrical load, leading to some distortion. To preserve this critical distortion information, the Hermite interpolation method is used for the current data.
In most cases, the voltage of the equipment is relatively stable, typically maintained near the power frequency voltage standard with minimal fluctuations. These fluctuations are usually associated with the equipment’s characteristics. In contrast, the electrical characteristics of the device are primarily reflected by the performance of the current, which plays a key role in the analysis of the V-I trajectory. However, due to the similarity of current waveforms among some devices, the traditional V-I trajectory analysis method faces significant challenges in distinguishing between these devices. To address this issue, this paper adopts Fryze power theory to preprocess the source current waveform of the device. This approach enhances the differentiation and uniqueness of the V-I trajectory, thereby improving the accuracy of device recognition.
According to Fryze power theory, the formula for calculating reactive current is as follows:
In the formula,
Through the above Formulas 1–3, the active power P can be calculated as follows:
In the formula,
2.2 Color coding based on V-I trajectory features
In the non-invasive load identification algorithm, the V-I trajectory is a key feature often used to distinguish the loads of different types of electrical equipment. However, extracting the shape parameters of these trajectories is often a complex process, and the type and number of selected parameters significantly impact the generalization ability of model training. The V-I trajectory construction method obtained in this paper is as follows:
1) After the operation of the electrical equipment reaches a stable state, all voltage and active current data within a complete cycle are collected. These data are then normalized to ensure consistency during analysis and processing:
In the formula,
2) Set the image resolution:
In the formula, floor is the down-integer function. If the resolution is set to n×n, the current data
3) Construct an n×n zero matrix and assign values step by step from the first row to the last row in a periodic manner. In this procedure, the current
Although V-I trajectories demonstrate high efficiency in resolving multiple electrical loads, neural networks still encounter challenges in recognizing the trajectories of certain loads. Literature (Chen D. et al., 2023) conducted an in-depth analysis of the physical properties of V-I trajectories and identified eight main features: the size of the closed region, the direction of circulation, asymmetry, the slope of the middle line, the number of intersections, the slope of the middle section, the area difference between the left and right sections, and the peak value of the middle section. These features reflect various physical aspects, such as the symmetry of the load current, the phase difference between voltage and current, the magnitude of the angle, and the harmonic content of the current waveform.
However, relying solely on these characteristics does not sufficiently distinguish all types of loads. To enhance the performance of V-I trajectory in load recognition, it is necessary to introduce additional feature quantities. This may involve employing more advanced geometric measures, conducting statistical analyses, or utilizing sophisticated machine learning algorithms to explore deeper recognition features.
To fully capture the characteristic parameters of the load, this paper maps these data to the red, green, and blue channels of the RGB color space. This is achieved by combining the ratio of the change rate of reactive power, voltage v(t), and active current ia(t), along with the average change ratio of pixels in the V-I trajectory diagram prior to the load reaching a stable operation period. Each channel forms an n×n matrix with the same number of pixels as the V-I trajectory diagram. The specific color coding process is as follows:
1) Build R channel:
Use reactive power Q for the red channel R:
In the formula, Q is the reactive power of the load,
2) Build G channel:
Because the voltage and current change rates of different electrical equipment during the stable period exhibit certain differences, this paper uses these rates as the green channel G value in the RGB coding.:
In the formula,
3) Build B channel:
Because the load undergoes an unstable initial stage after starting, followed by a period of stable operation, the characteristics of the V-I trajectory during the unstable stage differ significantly from those during the stable stage. Moreover, these differences vary among different loads, providing an important dimension for distinguishing between them. To effectively incorporate the unsteady operation characteristics into load identification, this paper uses the average value of the V-I trajectory during the unstable stage to construct the blue channel B of the RGB color space. This approach reflects the characteristics of this stage in the load identification process:
In the formula,
According to the above Formulas 1–12, V-I trajectories were constructed and color-coded for 11 electrical devices corresponding to the PLAID public dataset, as shown in Figure 1. The corresponding device types are as follows: (1) Air Conditioner, (2) Compact Fluorescent Lamp, (3) Fan, (4) Fridge, (5) Hairdryer, (6) Heater, (7) Incandescent Light Bulb, (8) Laptop, (9) Microwave, (10) Vacuum, and (11) Washing Machine. As illustrated in the figure, there are noticeable differences in the shape, color change, and distribution of color in the V-I trajectories among different categories of appliances. These differences enhance the degree of differentiation between various equipment categories, making the identification of different types of electrical equipment clearer and more effective.
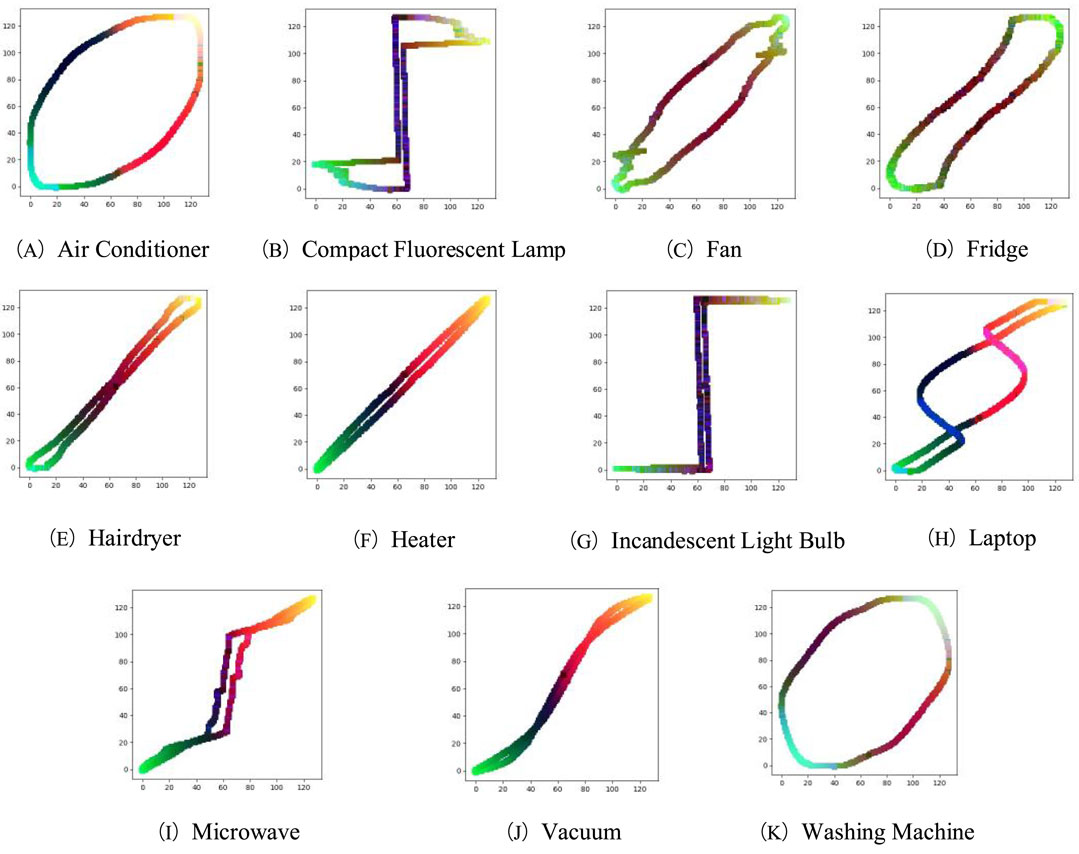
Figure 1. Each appliance in PLAID data set corresponds to a color V-I trajectory. (A) Air Conditioner (B) Compact Fluorescent Lamp (C) Fan (D) Fridge (E) Hairdryer (F) Heater (G) Incandescent Light Bulb (H) Laptop (I) Microwave (J) Vacuum (K) Washing Machine.
2.3 3D image construction
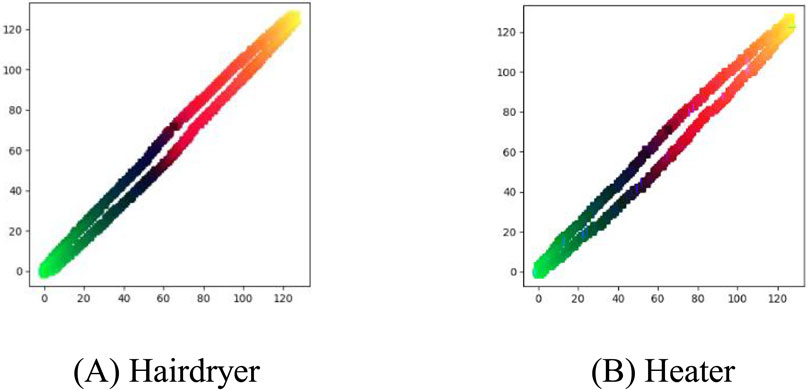
Although the V-I trajectory color coding method can effectively integrate features such as reactive power and the unstable phase into the curve, it is less accurate in distinguishing electrical devices with similar working principles and small differences in power feature values compared to the traditional method that relies solely on a single V-I trajectory identification. As shown in Figure 2, the 109th and 135th CSV files from the PLAID dataset were processed using the V-I trajectory color coding method described in this paper. The generated images are color-coded V-I trajectory images of a Hairdryer and a Heater, respectively.
The similarity between the two electrical devices in V-I trajectory and color distribution makes it challenging for neural network training and recognition, rendering it difficult to accurately distinguish between the two devices.
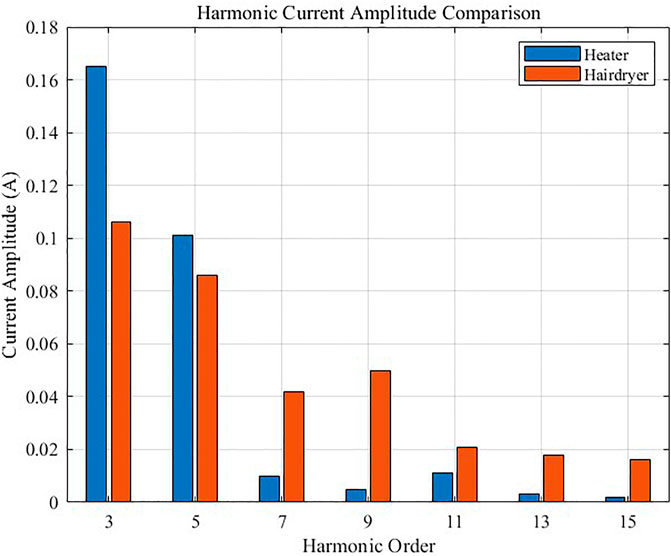
To better distinguish between the hairdryer and the heater, the frequency domain characteristics of these devices can be added to the load label to enhance the uniqueness of the load. Fast Fourier Transform (FFT) was used to calculate and analyze the fundamental wave and higher harmonics of their current signals. Since the amplitude of the fundamental wave is relatively large compared to the amplitude of each harmonic, the second to the 15th current harmonics were selected for comparison. The calculated values clearly show that the odd-order harmonic amplitudes of these two appliances are quite different. Based on this observation, the first 15 odd harmonic amplitudes of these two devices were selected for mapping, as shown in Figure 3 below.
From Figure 3, the differences in odd-order current harmonics between the two types of electrical equipment can be clearly observed as follows: starting from the seventh harmonic, the current harmonic amplitude of the hairdryer is significantly higher than that of the heater. The heater contains fewer odd current harmonics from the 7th to the 15th. According to literature (Song and Zhang, 2023b), the main reason for this difference is that the hairdryer contains a brushless DC motor, which produces higher-order harmonic components during operation, whereas the heater does not, resulting in fewer higher-order current harmonics.
Therefore, in this paper, the harmonic amplitude of higher-order current is selected as an additional feature and combined with V-I trajectory color coding to create a mixed feature. This mixed feature is used to construct a 3D color V-I trajectory image that includes both color and harmonic characteristics. This approach addresses the issue of differentiating similar trajectories in color coding and improves the accuracy of load identification. The construction method is as follows:
1) The FFT algorithm is used to convert the current waveform signal into a frequency domain signal for one cycle after reaching steady-state operation:
In the formula,
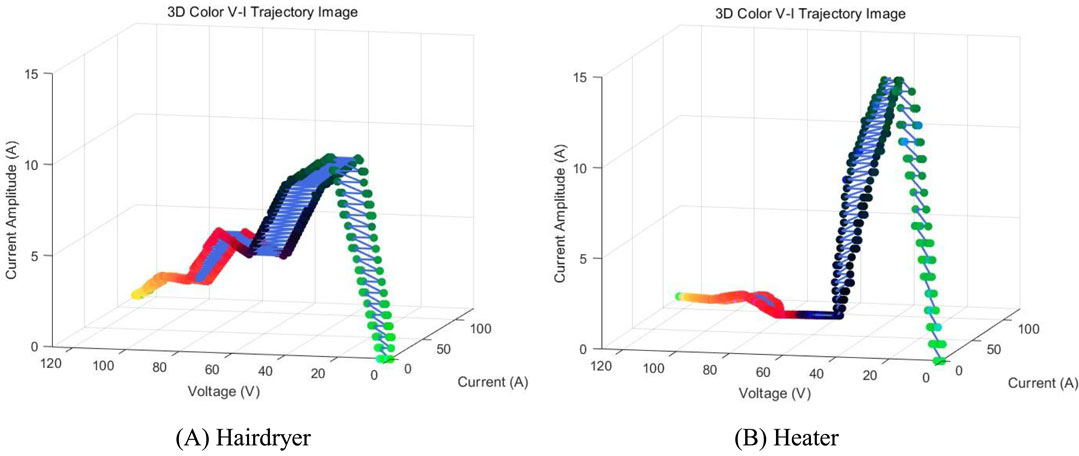
2) The X-axis coordinates in the V-I trajectory image, after the above color coding, are divided into seven segments. The height of the pixel coordinates in each segment (i.e., the Z-axis value) corresponds to the current amplitude of the 3rd to 15th odd harmonics. The color-coded V-I trajectory is taken as the X-Y plane of the 3D image, and the 3D image is constructed by combining the Z-axis value of each pixel, as shown in Figure 4.
Figure 4 demonstrates that the constructed 3D image can clearly distinguish between two types of electrical equipment with similar color V-I trajectory. By incorporating high-order harmonic features into the 3D color V-I trajectory image, the accuracy of equipment recognition is significantly improved compared to recognition based solely on color coding. This approach effectively addresses the issue of low accuracy in distinguishing electrical equipment when using only color-coded V-I trajectories.
3 Improved RESNET50 network
3.1 Data set balancing based on deep convolutional adversarial networks
As PLAID is a typical unbalanced dataset, there are more samples of Air Conditioners, Compact Fluorescent Lamps, and Fans, while there are fewer samples of Heaters, Vacuums, and Washing Machines. The maximum difference in the number of samples reaches 171, making it necessary to balance the 11 electrical equipment samples in the dataset to achieve better results in model training. In literature (Zai et al., 2022), the SMOTE method was used for oversampling to increase the number of minority class samples. However, this algorithm cannot independently control the number of synthetic samples, resulting in a high degree of randomness in the generated samples. Literature (Qiu et al., 2021) employed the SVMSMOTE algorithm to enhance data oversampling. This algorithm interpolates within the minority class samples and provides a better enhancement effect than the traditional SMOTE algorithm. Literature (Cui et al., 2022) utilized the ADASYN algorithm to increase the number of samples in each class to match the class with the largest number of samples. Although this algorithm can better cover the entire decision boundary by considering the number of neighboring samples for each minority class instance, for sparsely distributed minority instances, each neighborhood may contain only one minority instance. To better balance the image data in the dataset, this paper uses the DCGAN model to enhance the image data of minority classes, thereby balancing the number of samples across different categories and avoiding overfitting during network training.
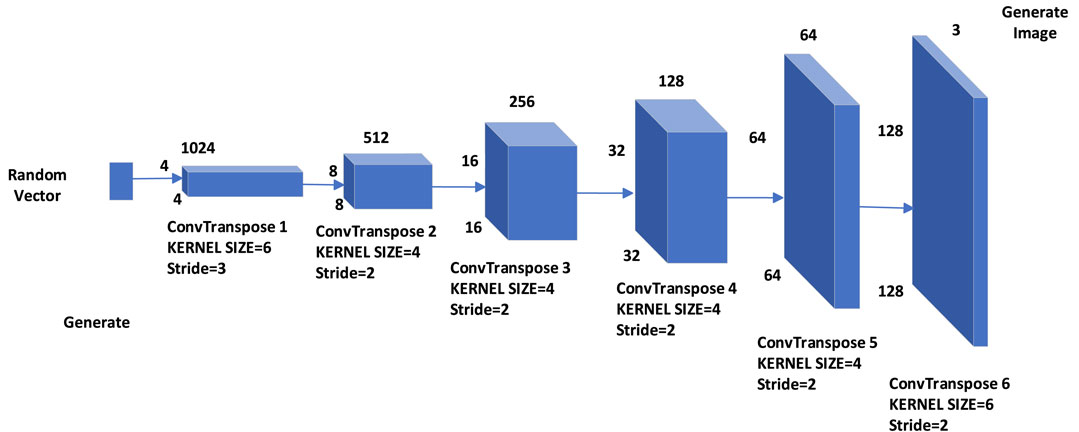
The output resolution of the classical DCGAN neural network is 64×64. Due to this low resolution, the details of the generated images are often blurred, necessitating an adjustment in resolution. To ensure the model can still learn the features of real images, the classical DCGAN neural network uses a Kernel Size of 5×5 and a Stride size of 2. In this paper, we modify the main generator and discriminator networks by adding one convolutional layer and adjusting the convolution kernel and stride size to improve the resolution of the generated images. When selecting the convolution kernel size and stride size, it is essential to ensure that the output size at each step is an integer to prevent problems caused by size mismatches. Therefore, three types of transposition structures were used in the generator network: convolutional kernel 4×4 with stride size 2, convolutional kernel 4×4 with stride size 2, and convolutional kernel 6×6 with stride size 2. These adjustments enable the generation and parsing of 128×128 images. Correspondingly, the discriminator network structure was also adjusted to fit the modified generator. The structure of the adjusted generator network is shown in Figure 5.
3.2 ResNet50 residual network
Deep Residual Networks (DRN) are widely used in the process of feature extraction. Their main advantage lies in their ability to clearly distinguish data features and significantly enhance the depth feature extraction capability of the network structure.
Compared with other network models, DRN is a more easily optimized scheme that effectively avoids degradation, gradient vanishing, or gradient explosion caused by network deepening. A key characteristic of residual networks is that different network layers correspond to different levels of features, with deeper layers extracting more detailed features. However, increasing the number of layers indefinitely will also lead to a significant increase in training time.
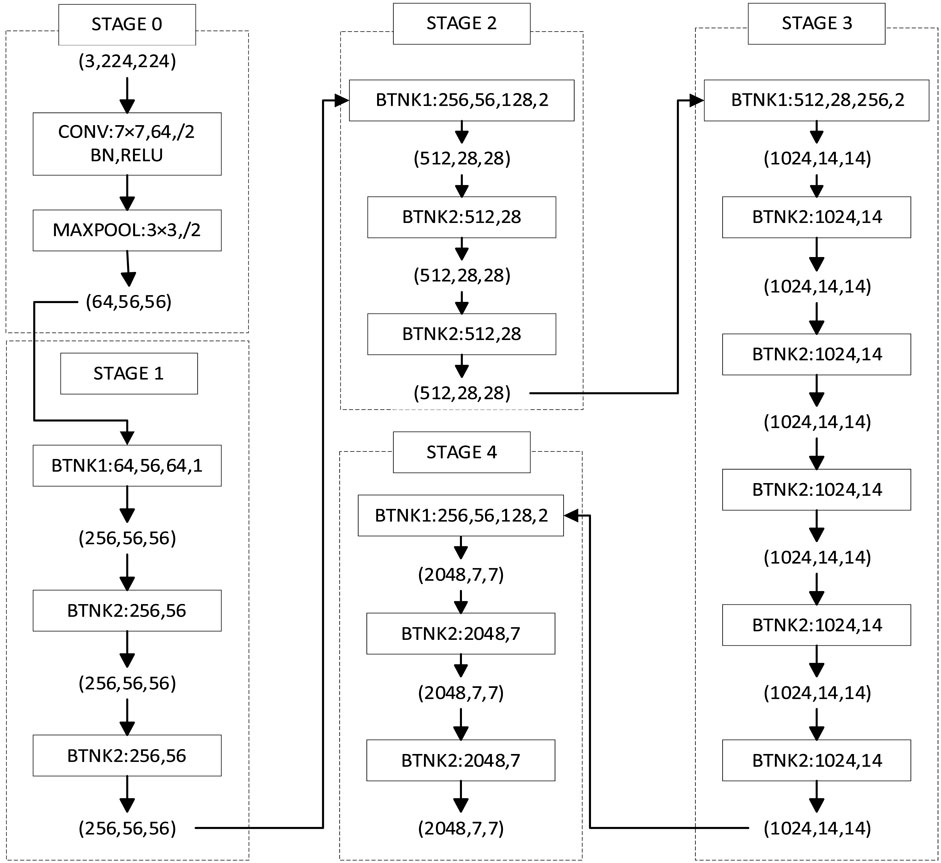
In the field of deep learning, ResNet50 is a widely used convolutional neural network architecture, particularly suited for complex image recognition tasks. This model features a residual network structure containing 50 convolutional layers, with the residual units allowing the network to maintain high recognition accuracy even at significant depths. The structure of ResNet50 consists of an initial convolution layer, four core residual modules, and a fully connected layer at the end. Specifically, each of the four core residual modules contains 3, 4, 6, and 3 submodules, respectively, with each submodule comprising three convolutional layers. The detailed network structure of the ResNet50 model is illustrated in Figure 6.
The BTNK1 structure consists of four adjustable parameters: number of channels (C), width (W), number of convolutional layer channels (C1), and step size (S). Additionally, BTNK1 includes an extra convolution layer on the right side compared to BTNK2, represented by the function G(x). This structure is suitable for scenarios where the number of input channels (x) and output channels (F(x)) differ. With the inclusion of the convolutional layer G(x), the input x is converted to G(x) to adjust the difference in the number of channels between the input and output, ensuring that G(x) matches the number of channels of F(x), thereby enabling the summation operation. In contrast, BTNK2 involves only two variable parameters: C and W, which represent the number and width of channels in the input shape (C, W, W). In this structure, input data x with shape (C, W, W) is processed by the function F(x), a three-layer convolution to the left of BTNK2, and then added to the original input. After being processed by a ReLU activation function, the final output of BTNK2 is obtained.
In this study, the ResNet50 residual network is used as the main framework, with the residual module from ResNet50 serving as the basic module. Its structure is optimized to adapt to the three-dimensional image recognition required in this paper. The classic ResNet50 network has 1,000 neurons in the fully connected layer, resulting in classification outputs for 1,000 image categories. However, this exceeds the 11 types of electrical equipment identified in this study. Therefore, the number of neurons in the final fully connected layer is modified to 11 to match the electrical load classification of the PLAID dataset. To better integrate 3D image features into each image for training and recognition, this paper combines the x-y plane, x-z plane, y-z plane, and z plane of the 3D image obtained during data preprocessing into a single image for input. This approach facilitates effective 3D load image recognition.
3.3 Model improvement based on CBAM
The attention mechanism is a deep learning technique modeled after human cognitive attention, which optimizes the allocation of computational resources in a model to focus on key features. This mechanism can enhance the learning efficiency of the model by avoiding the wastage of resources on unimportant features, thereby making the network more attentive to important local information. The Convolutional Block Attention Module structure consists of two submodules: the channel attention module and the spatial attention module.
The core function of the channel attention submodule is to adjust the contribution weight of each channel of the input 3D tensor. The dimensions of the input tensor include height (H), width (W), and number of channels (C). The submodule calculates the weight of each channel by evaluating the importance of features across different channels. This is usually achieved through global average pooling and global maximum pooling, which separately capture different statistical features. These features are then used to generate weights for each channel through a shared network, such as a multi-layer perceptron. These weights are applied to the channels of the original input, thereby highlighting features that are more important to the current task and improving the overall performance of the model.
The flow of the whole channel attention submodule is as follows:
1) Pooling operation: Two one-dimensional tensors (1×1×C) are obtained by performing maximum and average pooling on the input three-dimensional tensors (H×W×C).
2) Multilayer perceptron processing: The above two tensors are fed into a multilayer perceptron, and the weight coefficient for each channel is calculated through the network.
3) Weight application: The calculated weight coefficients are then used to weight the channels of the original input tensor, producing the weighted three-dimensional tensor.
The above procedure is expressed as follows:
In the formula,
The spatial attention submodule moderates its contribution by evaluating the importance of each position in the input tensor. First, the input feature maps are subjected to maximum and average pooling, generating two H×W×1 feature maps that represent the maximum and average values of the original feature map, respectively. These two feature maps are then merged into a single H×W×2 feature map. This feature map is convolved with a 7×7 convolution kernel to produce a 1×1×1 feature map whose values reflect the weight of each position. Finally, this feature map is processed by a Sigmoid function to obtain the spatial weight coefficients, thereby realizing the spatial attention adjustment of the input tensor.
The above procedure is expressed as follows:
In the formula,
Formulas 15 and 16 above can be used to improve the residual network in this paper. Because CBAM is a lightweight attention mechanism, when applied to the ResNet50 network, it can improve the accuracy of 3D color V-I trajectory image recognition while retaining image information, without significantly increasing the number of parameters in the network. By implementing CBAM processing on the previously processed image features, a more refined feature representation can be generated.
4 Experimental testing and analysis
4.1 Experimental environment
In this paper, the improved ResNet50 neural network is trained on the Python platform and validated using the PLAID public dataset and laboratory-measured data. The hardware platform used includes an Intel(R) Core (TM) I9-12900 CPU at 2.50 GHz and 16 GB of RAM. The PLAID dataset consists of 1793 voltage and current records for 11 household appliance types collected at 65 different locations, sampled at a high frequency of 30 kHz. To verify the accuracy and effectiveness of the identification algorithm, data for four types of electrical equipment—hot kettle, welding torch, printer, and hair dryer—were collected in a laboratory environment. These four types of equipment were combined in pairs to create six types of mixed equipment, resulting in a total of 960 groups of voltage and current data, with a sampling frequency of 25 kHz.
4.2 Hardware system implementation
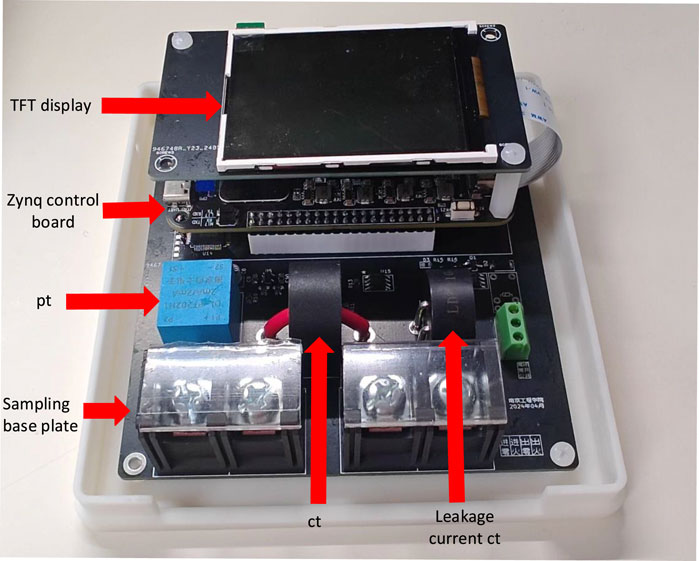
In this paper, the ZYNQ7020 development board developed by Xilinx is used as the hardware platform for the non-invasive load monitoring system, incorporating the XC7Z020CLG400-2 chip with mid-range performance. This chip features 85K logic cells, 4.9 Mb of Block RAM, 220 DSP slicing resources, up to 200 I/O pins, and a dual-core Cortex-A9 processor system. Compared to traditional PC or ARM-based embedded platforms, FPGAs offer more convenience in terms of size and installation, featuring a high-speed CHMOS process, flexible logic units, parallel computing capabilities, and pipeline optimization design. These characteristics enable more effective installation and implementation of NILM algorithms.
Additionally, the core board is configured with two 2 Gb DDR3 SDRAM modules, and it includes necessary peripherals such as a download interface, PL end crystal oscillator, PS end crystal oscillator, LED lamp, Ethernet chip, FLASH chip, and eMMC chip, to fully meet the system requirements. The ZYNQ7020 development backboard not only provides an expansion interface to the core board but also includes the SD card interface and various other peripheral modules required for this study. This hardware configuration offers significant advantages in terms of parallel processing and computing speed. The detailed design of the hardware module is shown in the appendix schematic diagram, and the physical diagram of the development board is shown in Figure 7 below.
4.3 Evaluation index
In this paper, three evaluation metrics—confusion matrix, F1 score, and accuracy rate—are used to assess the load identification results.
The F1 score is used to evaluate the recognition accuracy for each type of electrical equipment. Its calculation formula is as follows:
In the formula,
The accuracy rate refers to the ratio of correctly identified samples to the total number of samples in the test set. It is used to evaluate the overall recognition performance of the test samples. The calculation formula is as follows:
In the formula,
4.4 Public data set test results
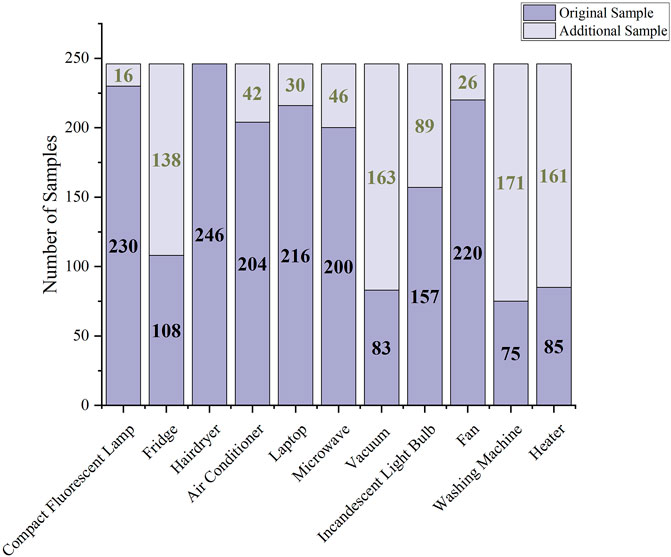
The dataset balancing method based on the Deep Convolutional Adversarial Network, described in Section 2.1, was used to balance the number of samples for various loads in the PLAID dataset, as shown in Figure 8.
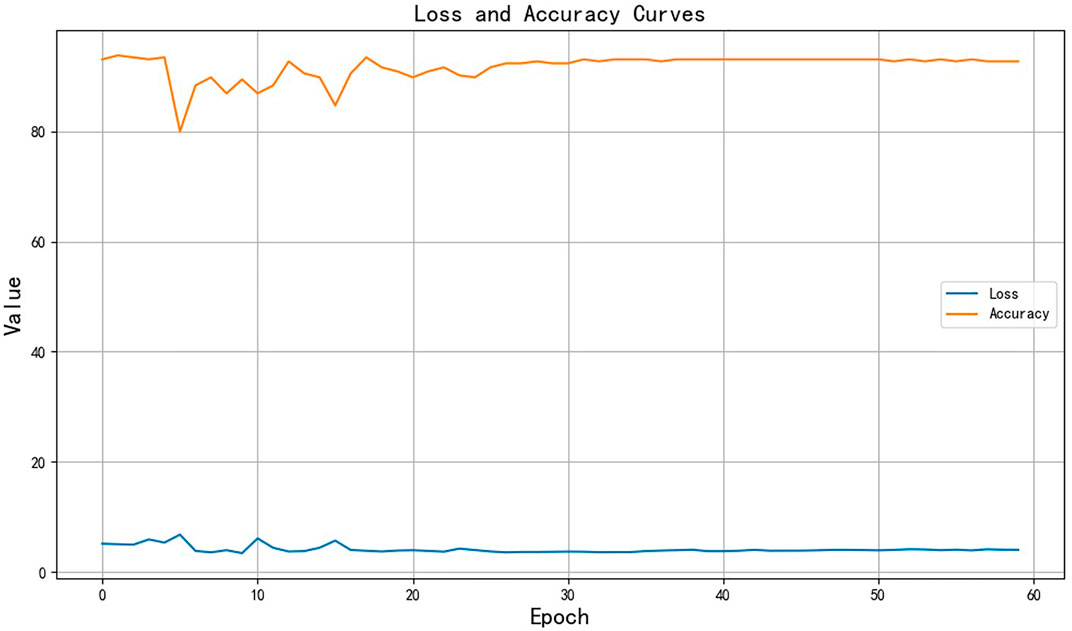
To match the input dimensions of the ResNet50 network, which are 227×227×3, the size of the constructed mixed color image was adjusted accordingly. For the transfer learning of the ResNet50 network, the number of neurons in the new fully connected layer was set to 11, the initial learning rate was set to 0.0001, the number of training epochs was set to 60, and the batch size was set to 8. The network was trained using the divided training set. The training process of the ResNet50 network is illustrated in Figure 9. The horizontal axis represents the number of training iterations, while the vertical axis, labeled “value,” reflects the model’s training accuracy and loss function, represented by the orange and blue curves, respectively. It is evident from Figure 9 that as the number of iterations increases, the loss function value gradually decreases and the training accuracy increases. When the number of iterations reaches 25, both the loss function value and the training accuracy trend stabilize.
In this paper, 3D color V-I trajectory images separated by 10 cycles from the training set data are selected as the test set. This approach ensures that there is no data leakage from the training set while also testing the robustness of the trained model. The confusion matrix, F1 score, and accuracy rate, as described in Section 3.3, were used to evaluate the recognition results of the test set.
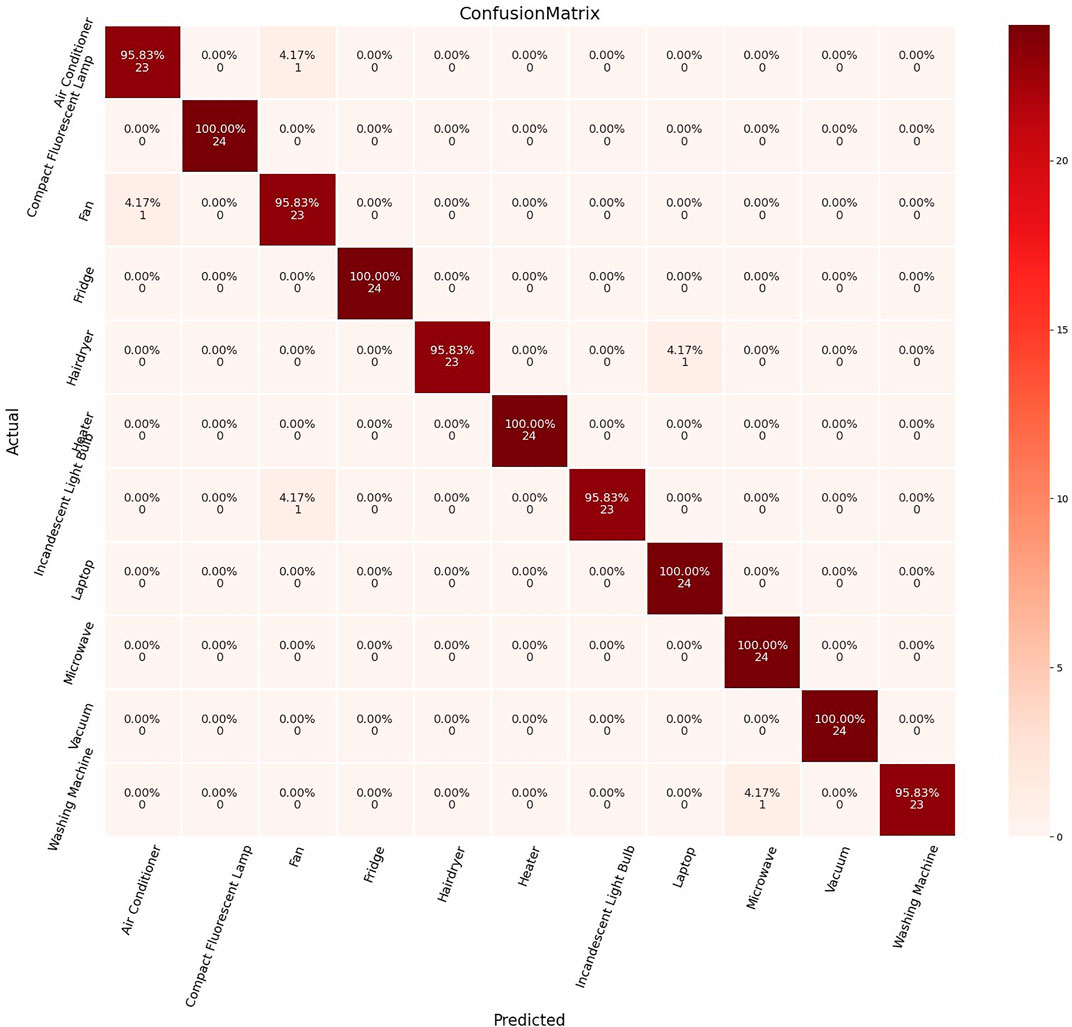
The confusion matrix plotted from the PLAID dataset test results is shown in Figure 10. The advantage of the confusion matrix is that it clearly shows where errors occurred, with each row of the matrix representing the predicted category of the device and each column representing the actual category. The predicted category matches the actual category on the diagonal, indicating correct classification. Non-diagonal entries represent instances where the device was misclassified. From the confusion matrix, it is evident that air conditioners, refrigerators, and laptops are commonly misclassified as other types of electrical appliances. In contrast, heaters and vacuum cleaners were not misclassified and were easily identified by other types of electrical appliances.
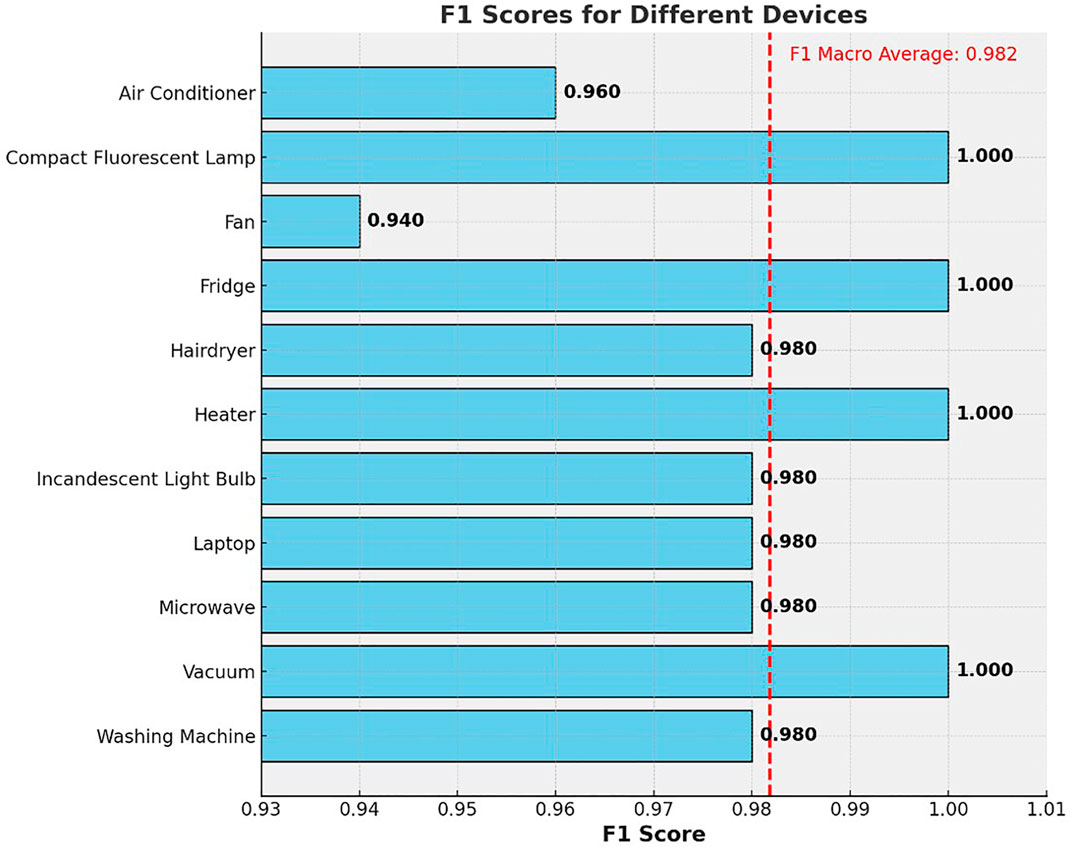
The F1 score of each type of electrical appliance is calculated by the confusion matrix to evaluate the recognition ability of the model for each type of electrical appliance. The F1 scores of the 11 electrical appliances corresponding to the test results are shown in Figure 11. The F-macro marked by red line in the figure represents the average F1 scores of 11 appliances, of which the F1 scores of Air Conditioner and Fan are much lower than the average. The reason for confusion between Air Conditioner and other types of equipment is that this type of appliance has multiple operating states, and the characteristics of similar appliances in different states are very different. There are motors in fans, and their working principles are similar to those of air conditioners, hairdryers, washing machines, and other equipment under specific working conditions, making them difficult to distinguish.
To further verify the effectiveness of the proposed method, the load characteristics and classification models described in literature (Zheng et al., 2018; Wang et al., 2020b; Xie et al., 2022) are introduced as comparison benchmarks. The specific comparison results are shown in Table 1. In the PLAID dataset, compared to the other three algorithms, the recognition accuracy of this method is improved by 25.1%, 7.2%, and 4.1%, respectively. This is particularly evident in reducing the false recognition rate of multi-state equipment such as refrigerators, washing machines, and air conditioners. The algorithm proposed in this paper combines higher-order harmonic features with the color V-I trajectory image to form a 3D color V-I trajectory image. This approach not only includes all the feature information used in the algorithms from literature (Zheng et al., 2018; Wang et al., 2020b; Xie et al., 2022), but also adds more detailed features. In terms of the classification model, the selected ResNet50 network outperforms conventional CNN models in image recognition performance. By improving and incorporating the CBAM model to extract more effective information from the load imprint, the load recognition effect is further enhanced. In summary, the proposed method significantly outperforms the other three algorithms in load recognition.
4.5 Test results of field data set
According to the load characteristics analysis in Section 2.3, when the operating principles of the devices are similar and the power characteristics (including active and reactive power) are similar, it is difficult to distinguish them using traditional color V-I trajectory images. To improve the accuracy of load identification in these cases, a 3D color V-I trajectory image with harmonic features is introduced in this paper. Section 4.4 verifies the effectiveness of the new method by comparing it with color V-I trajectory images without fused harmonic features. The experimental data included single operation data for a kettle, welding torch, printer, and hair dryer, as well as current and voltage data when any pair of these devices operated simultaneously. Among these devices, excluding the printer, the others are heating equipment. In the mixed operation of these devices, due to their similar power characteristics, single color V-I trajectory image recognition may lead to misjudgment. This study tested the data for both separate and mixed operations of the devices to assess the effectiveness of the recognition algorithm in distinguishing between the two scenarios.
To reduce the influence of unbalanced datasets on experimental results, this paper ensures that the sample number of a single device is consistent with that of its mixed operating state during the data acquisition stage. Additionally, to maintain consistency in the experiment, the test environment and network model parameters follow the settings previously used with the PLAID dataset. In the experiment, 20 samples of each device were randomly selected for testing, and two methods—color V-I trajectory image and 3D color V-I trajectory image—were used for comparison and analysis. The specific classification effects are shown in Table 2. The results show that the 3D color V-I trajectory image is significantly better than the traditional color V-I trajectory image in device recognition accuracy. Particularly, when harmonic features are not incorporated, color V-I trajectory images often misidentify hair dryers as hot water kettles, and misjudgments frequently occur when these devices are mixed with welding torches. In contrast, the introduction of harmonic features in mixed color images significantly reduces these misjudgments, thus confirming the significant advantages of mixed color images in solving similar device recognition problems.
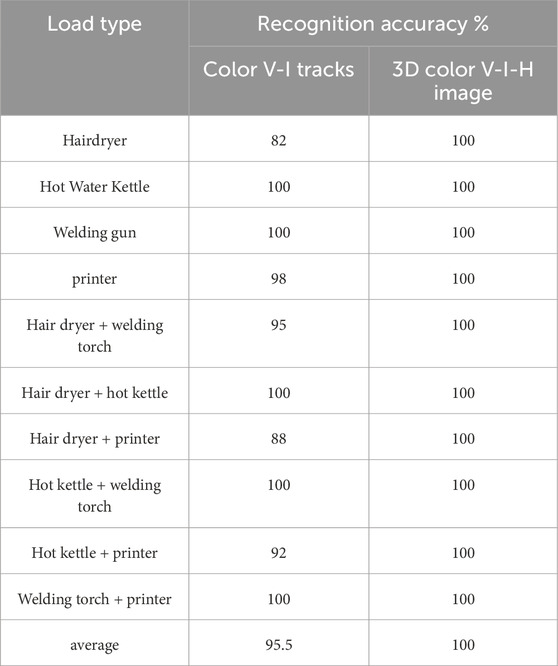
Table 2. In this paper, the measured data of hardware system are tested and compared by two methods.
5 Conclusion
This paper proposes a non-invasive fine-grained load recognition method based on 3D V-I trajectory analysis. By incorporating higher-order harmonic features and constructing 3D color V-I trajectory images from two-dimensional V-I trajectory color coding, the characterization ability of load features is enhanced, effectively improving the distinction between different loads and achieving fine-grained load recognition. For model training, a neural network based on the Convolutional Block Attention Module is designed on the foundation of the traditional ResNet50 residual network model to extract more effective information from load imprints and further improve recognition performance. Additionally, a non-invasive load recognition system based on FPGA is developed and trained online on a Linux system, with high-frequency data acquisition conducted on four types of laboratory electrical equipment. The proposed method was experimentally validated using both the PLAID dataset and laboratory data, and compared with other methods on the PLAID dataset. Experimental results show that the proposed method achieves higher recognition accuracy compared to other methods, particularly for devices with similar V-I trajectories and minimal power differences. The fusion of higher-order harmonic features significantly enhances recognition performance compared to methods that do not incorporate these features. However, the proposed method’s recognition performance for multi-state operating loads needs improvement. Besides incorporating higher-order harmonic features, the generation of 3D color V-I trajectory images can further integrate other load features with higher discriminability in three-dimensional space, leveraging the advantages of multi-dimensional analysis to improve model classification accuracy.
Data availability statement
The datasets presented in this study can be found in online repositories. The names of the repository/repositories and accession number(s) can be found in the article/supplementary material.
Author contributions
HB: Writing–review and editing, Project administration, Methodology, Conceptualization. ZZ: Writing–review and editing, Project administration, Methodology, Conceptualization.
Funding
The author(s) declare that financial support was received for the research, authorship, and/or publication of this article. We declare all sources of funding received for the research being submitted. This work was supported by Jiangsu Graduate Research Innovation Program (SJCX23_1209).
Acknowledgments
This paper employs Deep Convolutional Generative Adversarial Networks (DCGAN), a model introduced by Alec Radford et al. in 2015. Building upon this foundational framework, we implement optimizations and enhancements to adapt the deep learning model to the specific requirements of this study.
Conflict of interest
The authors declare that the research was conducted in the absence of any commercial or financial relationships that could be construed as a potential conflict of interest.
Publisher’s note
All claims expressed in this article are solely those of the authors and do not necessarily represent those of their affiliated organizations, or those of the publisher, the editors and the reviewers. Any product that may be evaluated in this article, or claim that may be made by its manufacturer, is not guaranteed or endorsed by the publisher.
References
Baets, L., Develder, C., Dhaene, T., and Deschrijver, D. (2017). “Automated classification of appliances using elliptical fourier descriptors,” in IEEE International Conference on Smart Grid Communications (SmartGridComm) (Dresden, Germany: IEEE), 153–158. doi:10.1109/SmartGridComm.2017.8340669
Chen, D., Liu, W., and Ding, S. (2023b). “Research review of non-invasive load monitoring,” in Annual conference of China electrotechnical society. Singapore: Springer Nature Singapore, 628–637.
Chen, S., Zhao, B., Zhong, M., Luan, W., and Yu, Y. (2023a). Nonintrusive load monitoring based on self-supervised learning. IEEE Trans. Instrum. Meas. 72, 1–13. doi:10.1109/tim.2023.3246504
Cheng, X., Li, L., Wu, H., and Ding, A. (2016). A survey of the research on non-intrusive load monitoring and disaggregation. Power Syst. Technol. 40 (10), 3108–3117. doi:10.13335/j.1000-3673.pst.2016.10.026
Chen, J., Wang, X., and Zhang, X. (2020). Non-intrusive load recognition using color encoding in edge computing. Chin. J. Sci. Instrum. 41 (9), 12–19.
Cui, H.-Y., Cai, J., Chen, L., Jiang, C., Jiang, Y., and Zhang, X. (2022). Non-invasive load fine-grained identification method based on color coding. Power Grid Technol. 46 (04), 1557–1567. doi:10.13335/J.1000-3673.pst.2021.0613
De, B. L., Develder, C., Dhaene, T., and Deschrijver, D. (2019). Detection of unidentified appliances in non-intrusive load monitoring using siamese neural networks. Int. J. Electr. Power Energy Syst. 104, 645–653. doi:10.1016/j.ijepes.2018.07.026
Du, L., He, D. W., Harley, R. G., and Habetler, T. G. (2016). Electric load classification by binary voltage-current trajectory mapping. IEEE Trans. Smart Grid 7 (1), 358–365. doi:10.1109/tsg.2015.2442225
Ghosh, S., Chatterjee, A., and Chatterjee, D. (2021). An improved load feature extraction technique for smart homes using fuzzy-based nilm. IEEE Trans. Instrum. Meas. 70, 1–9. doi:10.1109/tim.2021.3095093
Hart, J. G. W. (1992). Nonintrusive appliance load monitoring. Proc. IEEE 80 (12), 1870–1891. doi:10.1109/5.192069
Jia, D., Li, Y., Du, Z., Xu, J., and Yin, B. (2021). Non-intrusive load identification using reconstructed voltage–current images. IEEE Access 9, 77349–77358. doi:10.1109/access.2021.3082432
Lam, H. Y., Fung, G. S. K., and Lee, W. K. (2007). A novel method to Construct taxonomy electrical appliances based on loadsignaturesof. IEEE Trans. Consumer Electron. 53 (2), 653–660. doi:10.1109/tce.2007.381742
Liu, Y., Wang, X., and You, W. (2019). Non-intrusive load monitoring by voltage–current trajectory enabled transfer learning. IEEE Trans. Smart Grid 10, 5609–5619. doi:10.1109/tsg.2018.2888581
Lu, J., Zhao, R., Liu, B., Yu, Z., Zhang, J., and Xu, Z. (2023). An overview of non-intrusive load monitoring based on V-I trajectory signature. Energies 16 (2), 939. doi:10.3390/en16020939
Qiu, X., Yin, S., Zhang, Z., Xie, Z., Jiang, M., and Zheng, J. (2021). Non-invasive load identification method based on V-I locus and higher harmonic characteristics. Electr. Power Eng. Technol. 40 (06), 34–42. doi:10.12158/j.2096-3203.2021.06.005
Shi, J., Zhi, D., and Fu, R. (2023). Research on a non-intrusive load recognition algorithm based on high-frequency signal decomposition with improved VI trajectory and background color coding†. Mathematics 12 (1), 30. doi:10.3390/math12010030
Song, Y., and Zhang, R. (2023a). A non-invasive load identification method based on V-I trajectory mixing feature. J. Phys. Conf. Ser. 2520 (1), 012021. doi:10.1088/1742-6596/2520/1/012021
Song, Y., and Zhang, R. (2023b). A non-invasive load identification method based on VI trajectory mixing feature. J. Phys. Conf. Ser. 2520 (1), 012021. doi:10.1088/1742-6596/2520/1/012021
Wang, J., and Sun, Y. (2023). Non-intrusive load identification method based on GAF and RAN networks. Front. Energy Res. 11. doi:10.3389/fenrg.2023.1330690
Wang, S., Guo, L., Chen, H., and Deng, X. (2020a). Based on feature fusion and depth learning non-invasive load identification algorithm. Power Syst. Autom. 44 (9), 103–110. doi:10.7500/AEPS20190625010
Wang, S., Guo, L., and Chen, H. (2020b). Non-intrusive load identification algorithm based on feature fusion and deep learning. Automation Electr. Power Syst. 44 (9), 103–110.
Xie, Y., Mei, F., Zheng, J., Gao, A., Li, X., and Sha, H. (2022). Non-invasive load identification method based on V-I trajectory Color Coding. Automation Electr. Power Syst. 46 (04), 93–102. doi:10.7500/AEPS20210511005
Yang, D., Gao, X., Kong, L., Pang, Y., and Zhou, B. (2020). An event-driven convolutional neural architecture for non-intrusive load monitoring of residential appliance. IEEE Trans. Consum. Electron. 66, 173–182. doi:10.1109/TCE.2020.2977964
Yang, W., Pang, C., Huang, J., and Zeng, X. (2021). Sequence-to-Point learning based on temporal convolutional networks for nonintrusive load monitoring. IEEE Trans. Instrum. Meas. 70, 1–10. doi:10.1109/TIM.2021.3106678
Yin, B., Zhao, L., Huang, X., Zhang, Y., and Du, Z. (2021). Research on non-intrusive unknown load identification technology based on deep learning. Int. J. Electr. Power Energy Syst. 131, 107016. doi:10.1016/j.ijepes.2021.107016
Zai, Z., Zhao, S., Zhu, X., Zhang, Z., and Dong, F. (2022). Noninvasive load identification method based on color coding and harmonic feature fusion. Electr. Technol. 23 (12), 9–16. doi:10.3969/j.issn.1673-3800.2022.12.002
Zhang, C., Zhong, M., Wang, Z., Goddard, N., and Sutton, C. (2018). “Sequence-to-point learning with neural networks for non-intrusive load monitoring,” in Proceedings of the AAAI conference on artificial intelligence, New Orleans Louisiana, USA. doi:10.1609/aaai.v32i1.11873
Keywords: non-invasive load fine-grained identification, three-dimensional image, color coding, improved ResNet50 neural network, FPGA
Citation: Bian H and Zhang Z (2024) A non-intrusive fine-grained load identification method based on three-dimensional voltage–current trajectories. Front. Energy Res. 12:1479995. doi: 10.3389/fenrg.2024.1479995
Received: 13 August 2024; Accepted: 16 October 2024;
Published: 31 October 2024.
Edited by:
Yu Huang, Nanjing University of Posts and Telecommunications, ChinaReviewed by:
Shuaibing Li, Lanzhou Jiaotong University, ChinaChao Deng, Nanjing University of Posts and Telecommunications, China
Copyright © 2024 Bian and Zhang. This is an open-access article distributed under the terms of the Creative Commons Attribution License (CC BY). The use, distribution or reproduction in other forums is permitted, provided the original author(s) and the copyright owner(s) are credited and that the original publication in this journal is cited, in accordance with accepted academic practice. No use, distribution or reproduction is permitted which does not comply with these terms.
*Correspondence: Haihong Bian, YmhoX25qaXRAMTI2LmNvbQ==; Zhiyuan Zhang, NDE5NTA0OTQ4QHFxLmNvbQ==
 Haihong Bian
 Zhiyuan Zhang