- 1Guangzhou Power Supply Bureau of Guangdong Power Grid Co., Ltd., Guangzhou, China
- 2School of Electric Power Engineering, South China University of Technology, Guangzhou, China
The low-voltage distribution network (LVDN) is the final stage in delivering electric energy from power plants to consumers, and its operational condition greatly impacts many power users. While medium-voltage and high-voltage distribution networks can be managed through intelligent digital systems, load imbalance issues in LVDNs often rely on planners’ experience, leading to significant limitations. With advancements in electric vehicle (EV) charging technology and vehicle-to-grid (V2G) technology, where EVs act as distributed energy storage units, bidirectional energy exchange between vehicles and the grid can now contribute to LVDN operation. This paper proposes a low-voltage load distribution planning method that integrates street information and V2G technology. A two-stage stochastic programming mixed-integer model is developed to tackle load imbalance in LVDNs, with the planning scheme derived from solving this model. A case study is presented to verify the effectiveness of the method, demonstrating that incorporating V2G technology enhances load distribution accuracy and reduces reliance on manual planning, improving network stability and operational efficiency.
1 Introduction
The low-voltage distribution network (LVDN) directly serves basic electricity users, acting as a crucial link between power production and power consumption. With the increasing integration of new energy sources and the introduction of advanced power equipment, the LVDN is experiencing significant transformations (Guo et al., 2023). In actual LVDN, load conditions are dynamic and subject to constant fluctuations due to various unpredictable factors, such as customer behavior, weather conditions, and public events. These variations make load imbalance an inherent challenge in such networks (Yan and Saha, 2012). As urban development accelerates, the phenomenon of “village in the city” becomes more prevalent, leading to concentrated and disorderly power loads, with pronounced regional load differences. Effective distribution network planning can mitigate load imbalance issues. LVDN planning primarily involves designing distribution transformers and low-voltage lines to form a radial network with the lowest total cost (Díaz-Dorado et al., 2001). Scheidler et al. (2018) highlights that while a large amount of data is available for analysis in LVDNs, planning typically relies on the expertise of experienced planners. Utilizing intelligent planning methods can enhance the robustness of planning schemes, but the quality of the database information poses a significant challenge. Wang et al. (2015) employs the traditional manual planning method, gathering LVDN information for analysis to develop a distribution network planning scheme. This approach considers both the investment in grid transformation and the reduction of grid loss rates. Mateo et al. (2018) focuses on planning low-voltage feeder-level integrated distribution networks by collecting data from 79 large European distribution system operators (DSOs). However, these feeder-level distribution networks only encompass three-phase balanced urban and semi-urban low-voltage distribution networks. In Díaz-Dorado et al. (2001), a minimum Euclidean distance tree is employed to plan low-voltage radial distribution networks while considering voltage drop constraints and line losses. However, this method does not address the issue of load imbalance in the distribution network. Carpinelli et al. (2017) employs an intelligent planning method, utilizing multi-objective optimization to address load imbalance in LVDNs, thereby enhancing power quality and energy efficiency. In LVDNs, cables are typically laid along streets (Moon and Kim, 2017). Díaz-Dorado et al. (2003) focuses on planning rural power grids with fewer nodes, considering the connection between transformers and power grids but not the street layout. Verheggen et al. (2016) proposes a low-voltage distribution network planning method that accounts for both the laying of cables along streets and the inclusion of distributed generation. Similarly, Navarro and Rudnick (2009) considers the user street layout and uses a heuristic algorithm to divide the planning area into smaller sections for local analysis and optimization, ultimately optimizing the entire area. Also considers the user street layout and uses a heuristic algorithm to divide the planning area into small areas for local analysis and optimization, and finally optimizes the whole area. The aforementioned three papers focus exclusively on typical power system loads.
With the rapid development of clean energy, the number of electric vehicles (EVs) is also increasing rapidly. Studies have shown that EV charging behavior significantly impacts the power grid, causing issues such as current and voltage imbalance, line loss, and feeder overload (Boribun, 2019). For some distribution facilities, peak load may only be reached for a few hours a year. However, uncontrolled electric vehicle charging behavior often exacerbates these load peaks and negatively impacts transformer lifespan (Wu and Sioshansi, 2017). By implementing orderly charging, which involves controlling the timing and amount of EV charging load, the operation of the distribution network can be improved, and peak demand on the network can be reduced (Benetti et al., 2014). Sangob and Sirisumrannukul (2021) proposes an LVDN planning method based on sequential particle swarm optimization (PSO). This method aims to mitigate the impacts of large-scale EV usage by implementing ordered charging of EVs. Tan et al. (2016) employs a two-level planning method to minimize grid load differences by adjusting the EV charging load. Ordered charging of EVs can enhance system operation by shifting the load to off-peak hours. Moreover, if EVs can function as energy storage and participate in the adjustment of distribution network operations, peak load can be further reduced (Mets et al., 2011). EV batteries are increasingly popular as small to medium-sized energy storage solutions due to their relatively high energy density, lack of geographical restrictions, and low maintenance requirements (Pimm et al., 2018). When a large number of EV batteries are combined to act as energy storage and can send power back to the grid during peak hours, this is referred to as Vehicle-to-Grid (V2G) technology (Crozier et al., 2020). V2G technology has demonstrated significant potential in balancing electricity supply and demand (Han et al., 2012). For instance, Soares et al. (2011) proposes a particle swarm optimization (PSO) algorithm to address the optimal scheduling of energy resources, including V2G resources.
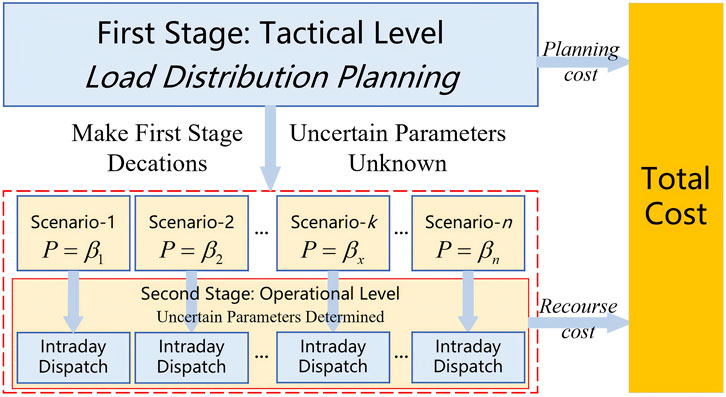
Stochastic programming is a significant branch of mathematical programming, used for modeling optimization problems that involve uncertain parameters (Shapiro and Philpott, 2007). The two-stage stochastic programming with recourse cost is the most common type, where decisions and related variables are divided into two stages (Mavromatidis et al., 2018). The first stage is typically referred to as the tactical level, involving long-term decisions that influence development over an extended period. The second stage, known as the operational level, involves more specific, shorter-term decisions. The first-stage decision must be made before the uncertain parameters are realized. Once these parameters are determined, they often differ from the expected values considered during the first stage. Consequently, the second stage incurs a recourse cost due to these differences, and the goal is to minimize this cost through second-stage decisions. Tan et al. (2014) adopts a two-stage stochastic programming method to plan the distribution network, taking into account distributed resources. Wu and Sioshansi (2017) uses a two-stage stochastic programming method to flexibly schedule EV charging times, leveraging distributed resources to mitigate the impact of load peaks on transformers.
In summary, LVDN planning is often closely linked to street information. However, due to data limitations and challenges in integrating and utilizing information, planners typically rely on limited data and design based on experience or use heuristic algorithms for support. The increasing adoption of EVs has added complexity, as their charging patterns significantly affect distribution network operations. The deployment of smart detection devices has improved data acquisition and utilization in LVDN. Nonetheless, current research falls short in integrating diverse information from these networks and using intelligent optimization methods to align long-term planning with operational scheduling while optimizing load distribution. Therefore, the paper proposes a low voltage load balancing distribution method considering street information and V2G technology applications. The proposed method employs a two-stage stochastic programming approach, the corresponding theory is illustrated in Figure 1. In the first stage, a load distribution optimization model that incorporates street information and electrical topology is established, focusing primarily on long-term load distribution planning and related constraints. In the second stage, a scheduling model utilizing V2G technology is created further to enhance the operational status of the distribution network.
The main contributions of this paper are as follows.
1) This study contributes to the planning of low-voltage distribution networks by integrating the original load distribution with optimal load combination strategies. We propose a method to reallocate load combinations to new access nodes through analytical modeling, taking into account street orientation to determine the most efficient and cost-effective load planning pathways.
2) The approach integrates two-stage adjustments for both long-term planning and dispatch. Utilizing the pseudo load curve acquisition method, it collaboratively addresses issues such as large load fluctuations, heavy overloads in the distribution network, and load imbalance, from both planning and dispatching perspectives.
2 Distribution network modeling
In the LVDN, most distribution lines are low-voltage overhead lines, and the road network is highly coupled with the power grid. Therefore, this paper integrates electrical lines in the LVDN with street information, forming what is termed the Road-Grid Coupling Network (RGCN). The primary method for optimizing load distribution in the LVDN involves removing the load from the original line, laying low-voltage overhead lines along the street, and reconnecting the removed load to the new line. Key issues in this process include selecting the most appropriate load combination (LC) for adjustment and choosing the adjustment path with the lowest cost.
2.1 Road-grid coupling modeling
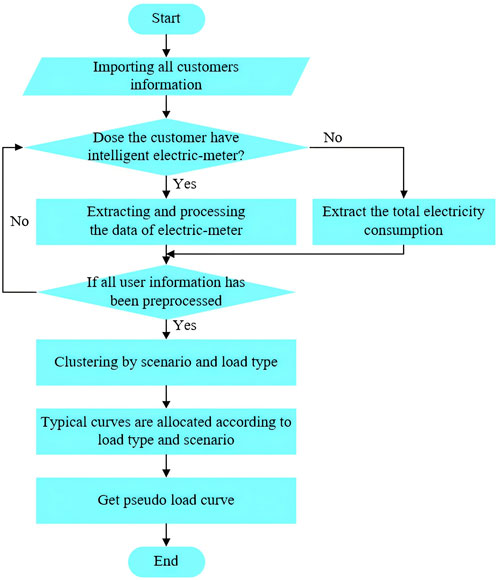
First, the street and electrical topology information related to the LVDN will be collected through the distribution operator systems (DSOs), as shown in Table 1. This table summarizes the key information required for modeling the RGCN. After collecting street direction information, the start and end nodes of the streets and the intersections of each street are anchored, and the streets are connected to establish a highway network connection model; for electrical topology information, the main focus is on the distribution and direction of electrical lines, and the line node locations are determined according to actual conditions, while the access locations of each user in the line are determined; for users, if smart meters are installed, the load data in the smart meters is read; if smart meters are not installed, the total electricity consumption information is collected for pseudo-load curve acquisition.
The cost of laying overhead lines is assessed for each street by the DSOs. This is represented by a cost coefficient ci, which is used to determine the most cost-effective planning route.
Finally, a weighted directed topological graph of the LVDN is created. The method for assigning weights to each edge in the directed graph is described in Equation 1.
Where wi is the weight of the i-th street, ci is the cost coefficient of the i-th street, and li is the length of the i-th street.
2.2 Pseudo load profile determination
The LVDN includes numerous users, making it impractical and costly to install intelligent electric meters for every user. Consequently, obtaining pseudo load profiles for low-voltage users depends on data from a limited number of users equipped with intelligent electric meters. In this paper, for users without intelligent electric meters, pseudo load profiles are utilized to approximate their actual power consumption curves (Gahrooei et al., 2017).
First, all loads are categorized based on the electricity consumption characteristics of the users. Collect electricity usage data from all users with intelligent electric meters. After cleaning the data and filling in any gaps, cluster the typical load patterns for various load types in different scenarios according to their load types and contexts. Additionally, mark the probability of each pattern’s occurrence. For loads without intelligent electric meters, assign a typical load pattern to each load based on its type and context. For example, if there are 100 A-type loads, and the clustering results for A-type loads in scenario-I show three load patterns (a, b, c) with occurrence probabilities of 50%, 30%, and 20%, respectively, then approximately 50, 30, and 20 of the 100 loads will be assigned to load patterns a, b, and c, respectively, in scenario-I. The flow chart illustrating the pseudo load profile acquisition method is shown in Figure 2.
3 Two-stage stochastic programming modeling
In the method proposed in this paper, the process is divided into two stages. The first stage is the planning stage, which spans a longer period and focuses primarily on replanning the existing load in the LVDN to mitigate issues of heavy overload and load imbalance through a limited number of load distribution adjustments. The second stage is the dispatching stage, which has a shorter period and mainly involves using V2G technology to manage EVs within the distribution network, further alleviating the problems of heavy overload and load imbalance.
This chapter addresses modeling in two distinct stages: long-term operation and short-term scheduling. After developing the models, a solver is utilized to derive collaborative planning and scheduling solutions. Ultimately, this approach aims to alleviate operational issues in the LVDN by integrating both long-term planning and short-term scheduling strategies.
3.1 Planning stage modeling
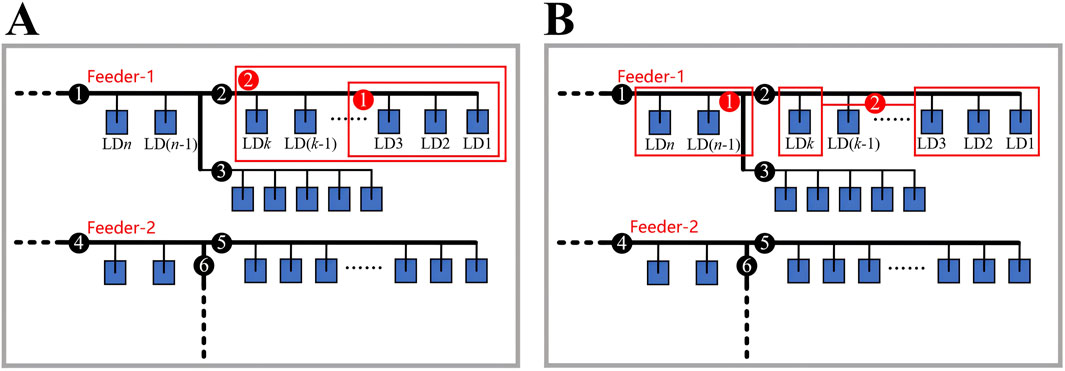
Through analysis of real-world projects, it is observed that the LVDN typically only redistributes load combinations (LCs) at the feeder endpoints. In the planning process, we begin with the load at the feeder’s end, then select the most appropriate LCs along the feeder. This LC is subsequently reconnected to the most suitable node within the distribution network, which is not always the terminal node.
In Figures 3A, B show the LCs that allow replanning and that do not allow replanning, respectively. For example, in Figure 3A, black nodes 2, 3, and five represent nodes located at the end of the feeder, and the loads they connect to are the ones subject to replanning. Taking node-2 as an example, during the planning process, we can select loads LD1-LD3 (as shown in the red frame-1 in Figure 3A). Alternatively, we can select up to k loads as an LC for planning (as shown in the red frame-2 in Figure 3A).
However, we cannot plan the load in the middle of the feeder (as shown in the red frame-1 in Figure 3B), nor can we select loads LD1-LD3 and then add LDk as an LC (as shown in the red frame-2 in Figure 3B).
In the planning stage, the key decision is to determine the node of each load connected to the distribution network. For each load within the distribution network, using the j-th load Ploadj as an example, we define a decision vector shown as Equation 2:
where the elements ρjn are all binary variables, and n is the number of nodes in the distribution network.
When making planning decisions, our goal is to minimize the total cost of the plan. The cost is calculated using the method shown as Equation 3. The cost matrix C is derived from the weighted directed topology graph developed in Chapter 2. To calculate the cost of each potential planning path for the loads, the Dijkstra shortest path algorithm is employed.
Where, Cji represents the cost of replanning the j-th load from the original node (assumption to be the k-th node) to the new i-th node. If k = i, then Cji = 0, indicating that the j-th load has not been replanned, and the cost is 0.
In LVDN, to avoid the formation of a closed power supply loop that could compromise safety in unexpected situations, the power supply network is typically designed to be radial. Consequently, users obtain power from only one node in the distribution network. This constraint is expressed as shown in Equation 4:
where ΩLD is the set of all loads, and n is the total number of distribution network nodes. When ρji = 1, it means that the j-th load access node is the i-th node in the distribution network.
Since all loads are already connected to the distribution network, readjusting the distribution of all loads is not feasible. During the planning stage, typically only a portion of the loads at the end of the distribution network can be redistributed. The constraint that needs to be met is shown in Equation 5, indicating that there is an upper limit on the number of loads that can be replanned:
where
Otherwise, constraint (Equation 7) must be met:
According to the above research results, the load connected to non-terminal nodes must adhere to the following constraint (Equation 8):
where ΩE.N. is the set of all end nodes.
For an end node (assuming it is node-i), two auxiliary decision variables are defined, as shown in Equations 9, 10:
where ain and bik are both binary variables, k is the total number of users connected to the end node-i;
where, if ahi = 1, it indicates that the LC from the end node-h is replanned to the node-i; if bhz = 1, it signifies that the z loads at the end of end node-i are replanned as an LC; if all bhz values are 0, it means that the load connected to this node is not replanned. The detailed usage of these two auxiliary variables will be elaborated in the second stage.
In LVDN, it is generally preferable to connect customers to the nearest point in the distribution network. If the connection point is too far from the customer’s geographical location, it can lead to cross-power-supply issues, which are detrimental to the operation and management of the power grid. Therefore, when redistributing the load, it is essential to follow the principle of proximity planning, as shown in Equation 13:
where Dji represents the Euclidean distance from the j-th load to the i-th node, according to the weighted directed topological graph obtained in Chapter 2. Rmax denotes the maximum allowable distance between the load location and the access node.
3.2 Operational stage modeling
During the operation stage, the primary objective is to utilize V2G technology to manage the charging load of EVs efficiently. This helps reduce the peak-to-valley difference in load and alleviate load imbalance. The decision variable in this stage is the EV charging load xs·k·t, which operates on a smaller time scale. The subscripts represent the charging load index, scenario, and time, respectively. Each scenario contains sn sampling points, as illustrated in Figure 4.
In low-voltage distribution networks, significant load differences between feeders exacerbate load imbalance within the regional grid. Therefore, during project operation and maintenance, it is essential to maintain uniform load rates across feeders. The article defines the degree of load imbalance as the difference between the maximum and minimum instantaneous load rates of all feeder outlets in the distribution network at any given time. A substantial degree of load imbalance typically signals that certain feeders are overloaded. When this imbalance surpasses a specified threshold, it can lead to increased transformer heating, elevated power losses, a higher failure rate, even voltage fluctuations, and reduced equipment lifespan. The calculation method for the degree of load imbalance is defined as Equation 14:
where σs·t·max and σs·t·min are the maximum and minimum values of all feeder load rates in scenario-s, at time t.
At this stage, the optimization goal is to minimize the mathematical expectation of the degree of load imbalance across all scenarios, as shown in Equation 15, where βs is the probability of the scenario-s occurring, and sn is the number of typical scenarios.
To facilitate the calculation of the load power at the end node (assuming node-i), auxiliary decision variables Pi·out·s·t, Pi·rest·s·t, and
where Pi·rest·s·t is the remaining load value of end node-i in scenario-s at time t, and the role of
where, according to the previous description, ys⋅tik is the total load value of the end node-i in scenario-s at time t, before planning.
Based on the above analysis, the calculation method for node power in the distribution network is shown as Equation 19:
where nE.N. is the total number of end nodes.
To ensure the distribution network’s safe and stable operation, the lines’ maximum instantaneous power should remain below the safety threshold, and the network should not operate under heavy overload conditions for extended periods. The constraints are shown in Equation 20:
where Ps⋅ij⋅t represents the instantaneous power of the line at time t in the s-th scenario; PN ij is the rated power of line-ij, μ is the safety threshold parameter, Tmax is the maximum allowable continuous overload time, ΩL is the set of all lines, and Ωs is the set of all scenarios.
At the same time, the distribution network should meet the power balance constraints during operation, as shown in Equation 21:
when ignoring line losses, at any time t, the power flowing into any node (e.g., node-i) Ps⋅i⋅t⋅in should be equal to Ploads·i·t (the sum of the total load of the users connected to this node) plus Ps⋅i⋅t⋅out (the power flowing out of the node). Ωi⋅in is the set of starting nodes of the lines flowing into node-i, Ωi⋅out is the set of ending nodes of the lines flowing out of node-i, ΩN is the set of all nodes.
When using V2G technology for load scheduling, to ensure the safe operation of the EV charging pile, its maximum charging and discharging power should meet the requirements specified in Equation 22:
where Pc⋅max and Pd⋅max are the maximum charging and discharging power of the charging pile, respectively.
Since users’ willingness to participate in the V2G plan varies across different periods, the proportion of users participating in the V2G plan at different times is not completely consistent. Here, we define the auxiliary decision variable PV2G, which represents the charging load of the user group participating in the V2G plan. This variable satisfies Equation 23:
Where Xs⋅k⋅t is the load value when EVs are charged in an unordered manner, and αs⋅t is the proportion of users participating in the V2G plan at scenario-s at time t. Additionally, for users in the V2G plan, the maximum charging and discharging power constraints must also be met, as shown in Equation 24:
where δ1 and δ2 are the maximum charging and discharging power safety thresholds of V2G users respectively.
To ensure the safety of EV charging and battery life, and to prevent excessive current changes from impacting the power grid and batteries, the power change rate should also be controlled when scheduling EV loads, as shown in Equation 25:
where ε is the maximum allowed charging rate.
For EV users, it is necessary to charge their vehicles to the specified capacity before their desired time. Therefore, in the scheduling plan, the total charging amount constraint must be met, as shown in Equation 26:
where t0 and tend are respectively the start and end times of the scheduling plan.
3.3 Modeling summary
Based on the theory of two-stage stochastic programming method, the model established in this chapter includes constraints (4)–(5), (13)and (20)–(26). The objective function of the model is shown in Equation 27:
where λ1 and λ2 are respectively the weight coefficients of the two-stage objectives.
When the model is solved, the values of the decision variables
4 Case study
The model established in this paper is a large-scale mixed integer programming model, containing both integer and continuous variables. The commercial solver Gurobi is used to solve the problem. The computer specifications are: Intel Core™ i5-13500H, 2.60 GHz, 16 GB of memory.
4.1 Case overview
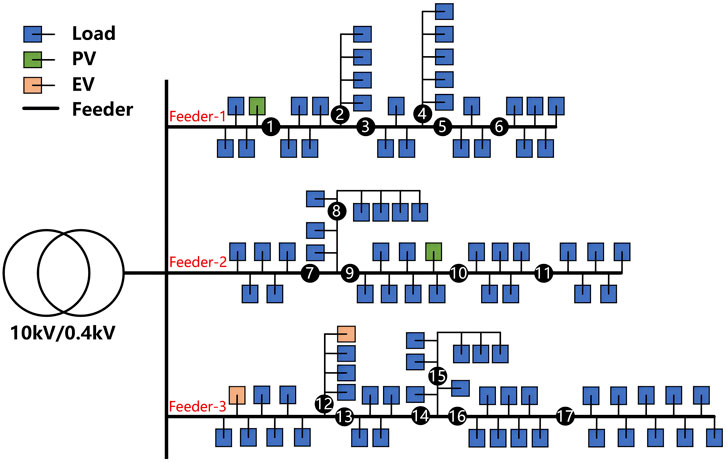
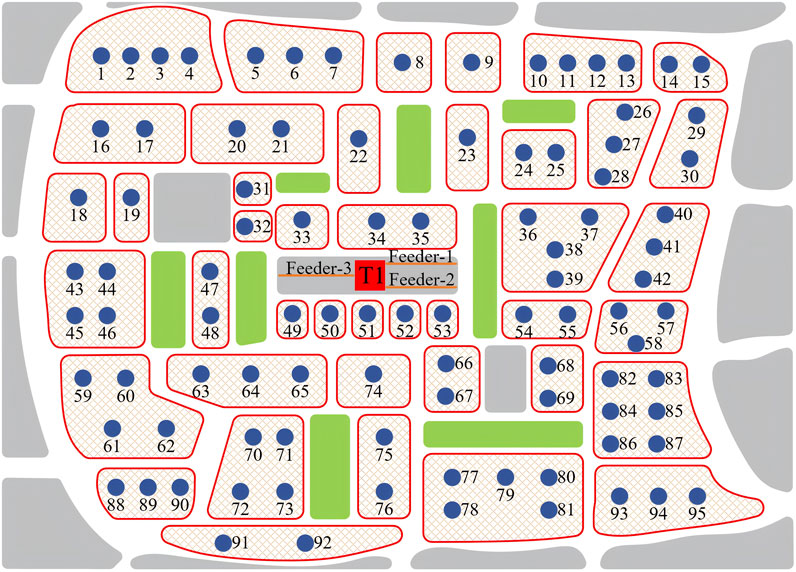
This paper uses a low-voltage distribution transformer in an urban village in Guangzhou City as an example. Figures 5, 6 are the electrical topology of the distribution network transformer and the road network coupling diagram respectively. The blue nodes in Figure 6 represent customers, and the red squares indicate distribution transformers.
The load exhibits characteristics typical of a residential area, including four categories: residential load, small commercial load, distributed photovoltaic (PV), and EV charging loads. Due to factors such as charging prices and limited charging pile capacity, most EVs charged during working hours follow a “charge-and-go” pattern. This means the owner starts charging immediately after connecting the car to the charging pile and leaves once the EV is charged to meet mileage requirements or the owner’s departure time limit. Fewer users participate in the V2G plan during these hours. However, for users who charge during late night to next morning, the end time of charging is more flexible, and the proportion of users participating in the V2G plan is relatively high.
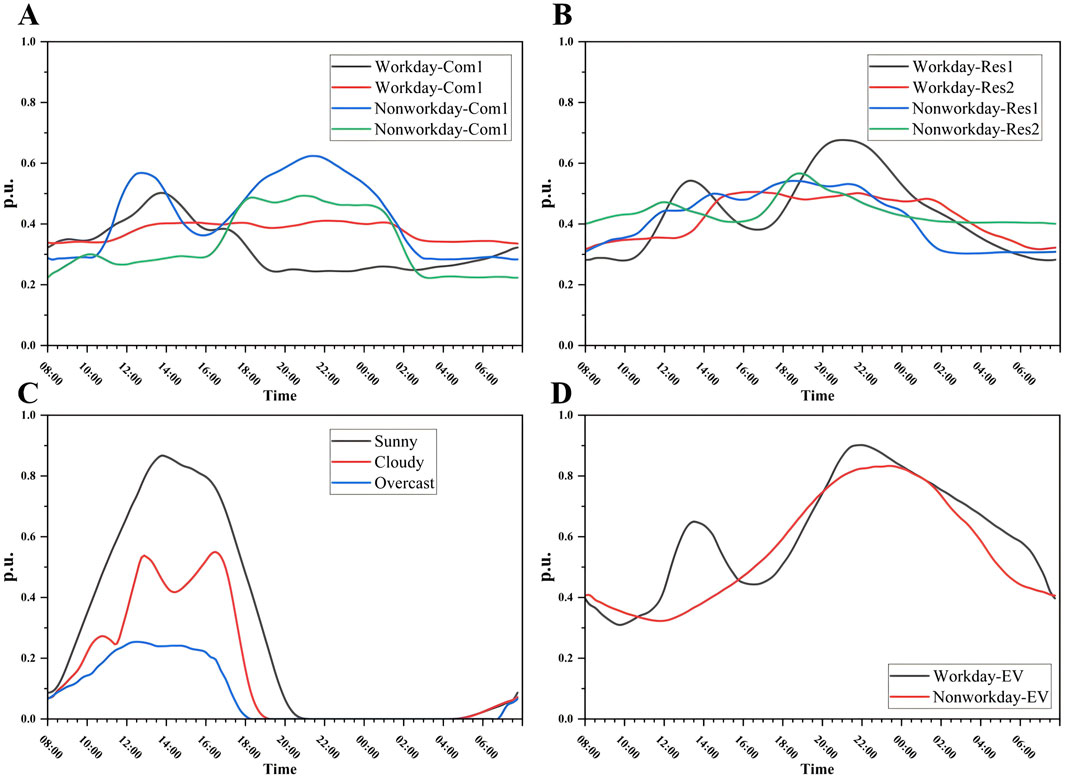
To more clearly demonstrate the continuous dispatch effect of V2G from late night to the next morning, this article takes 8:00 a.m. as the starting point, the scenario time scale is 24 h a day, and the sampling frequency is 15 min. For residential, small commercial, and EV charging loads, the load curve is closely related to whether the day is a weekday or not. Their clustering results on weekdays and non-working days show obviously different characteristics, as shown in Figures 7A–C. PV is closely related to weather conditions. Therefore, the clustering results of different scenarios according to weather conditions are shown in Figure 7D. From the results, we can see that PV output is larger on sunny days, smaller on cloudy or rainy days, and relatively smaller on cloudy days, with random fluctuations.
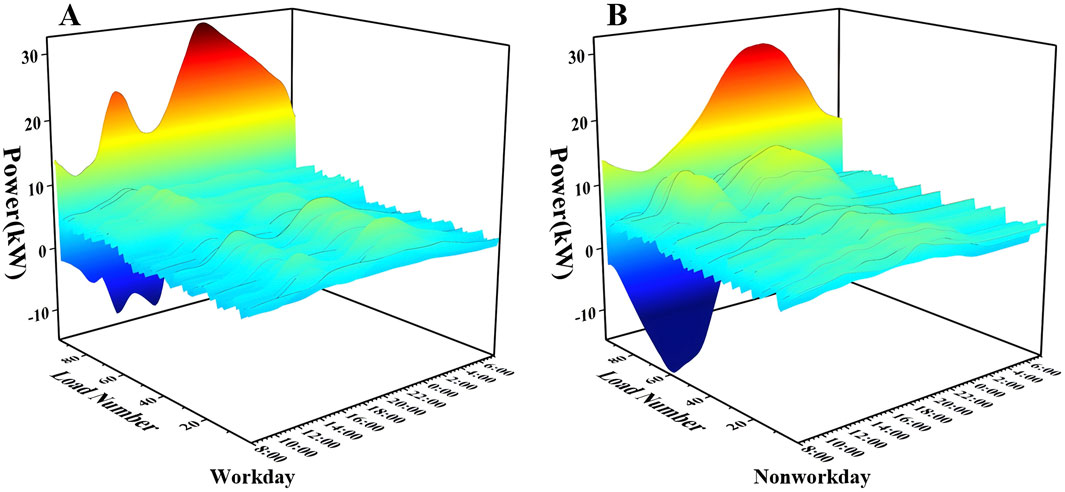
According to the pseudo load profile acquisition approach proposed in Chapter 2, the load profiles of all loads in the distribution network are obtained as shown in Figure 8. In this paper, PV output is regarded as loads with negative values, and all PV output is considered to be absorbed.
4.2 Case analysis
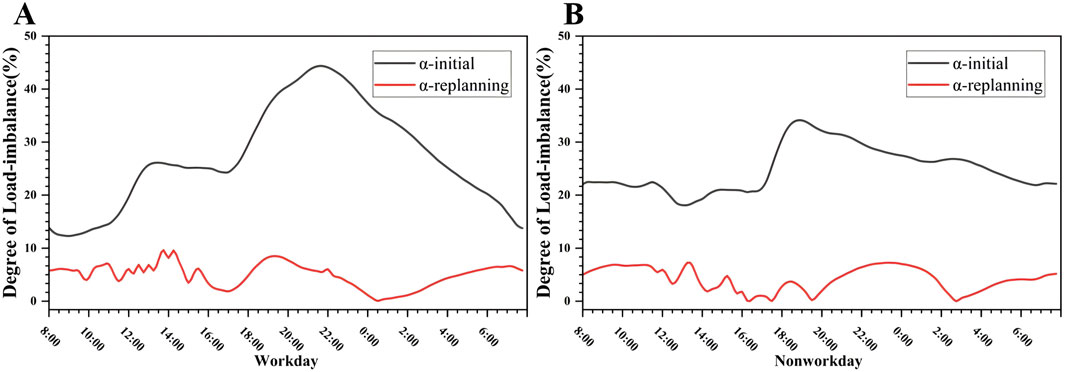
According to the scenarios generated above, the degree of load imbalance in the area before replanning reached 26.38%. In both working day and non-working day scenarios, the degree of load imbalance at 10:00 p.m. is significantly higher. In the working day scenario, the instantaneous degree of load imbalance can reach 43.71%, which is very unfavorable for the safe and stable operation of the regional distribution network.
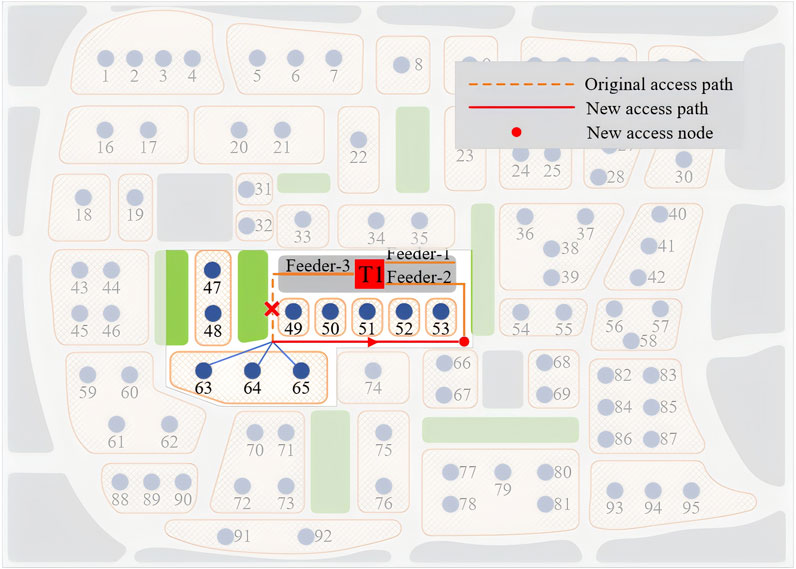
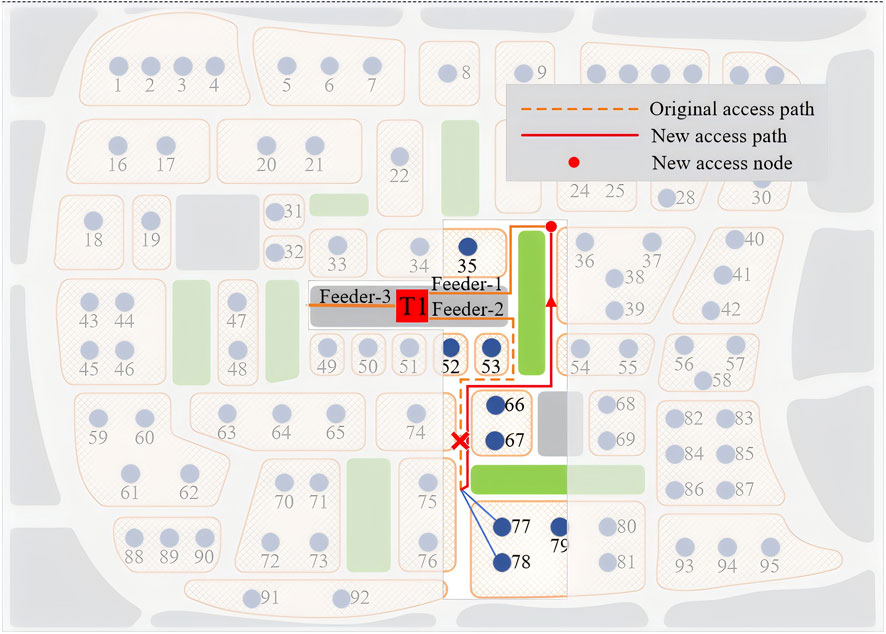
Applying the method proposed in this paper (referred to as method 1), the load planning scheme for the region is obtained as follows: load-63, 64, and 65 at the end of feeder-3 are adjusted to feeder-2, and load-77 and 78 at the end of feeder-2 are adjusted to feeder-1. The schematic diagrams of the load adjustment positions and paths are shown in Figures 9, 10.
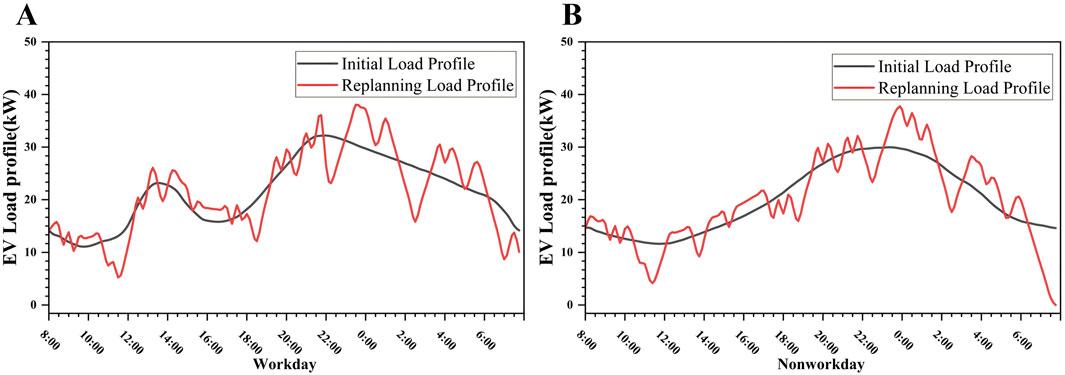
Take EV load No. 39 as an example, the optimization results of EV charging load considering V2G technology are shown in Figure 11. During certain high-load periods, EVs connected to the distribution network act as energy storage, transmitting energy back to the distribution network. As night falls, most residential and commercial loads decrease significantly. During this period, EV charging demand rises to fulfill charging requirements. By early morning, residential and commercial loads begin to increase again. By this time, most EVs have completed charging, leading to a gradual decrease in EV load. This sequence achieves a staggered operation of various loads.
After optimizing the distribution network in the region according to the plan mentioned above, the comparison of the degree of load imbalance is shown in Figure 12. It can be seen that the degree of load imbalance has significantly decreased across different scenarios, especially around the 22:00 period in the non-working day scenario. The load imbalance phenomenon has been greatly alleviated, and the overall degree of load imbalance has dropped to 4.66%, demonstrating a significant effect.
If we only consider adjusting the distribution of loads in the distribution network without applying V2G technology (referred to as method 2), the resulting planning scheme would need to adjust load 48 along with loads 63, 64, and 65 to feeder 2. In this case, the degree of load imbalance can only be reduced to 6.87%. The planning cost and the degree of load imbalance would be higher than method 1.
If we ignore street information and only optimize network flow (referred to as method 3), the planning scheme involves adjusting load-1, 2, 3, and 4 to feeder-2, and adjusting load-64 and 65 to feeder-1. This optimizes the degree of load imbalance to 4.11%. However, the replanning routes in this scheme are longer and the planning cost is higher. Compared to the case where street information is considered, the decrease in the degree of load imbalance is insignificant. The overall economic benefits of this scheme are lower, and it can easily cause cross-power-supply issues, increasing management difficulty. The comparison of the three methods is shown in Table 2.
The method proposed in this paper comprehensively considers street information and the application of V2G technology. It achieves a relatively good adjustment in the degree of load imbalance at the lowest cost, offering high efficiency and economic benefits.
5 Conclusion
Aiming at the current problem of load imbalance in Low Voltage Distribution Networks (LVDN), this paper proposes a load-balanced distribution method that considers street information and the application of V2G technology. Its outstanding features include the incorporation of LVDN street information and the adoption of a two-stage stochastic programming approach. The method proposed in this paper effectively integrates long-term planning with short-term dispatching strategies in the distribution network. By optimizing user access nodes and incorporating V2G technology, this approach significantly mitigates the degree of load imbalance in the LVDN with minimal and more judicious adjustments. However, the load profiles used in this method are pseudo load profiles. If more accurate load profiles of all users can be obtained, the effectiveness of this method can be further enhanced.
Data availability statement
The original contributions presented in the study are included in the article/supplementary material, further inquiries can be directed to the corresponding author.
Author contributions
YL: Conceptualization, Methodology, Writing–review and editing. YG: Formal Analysis, Writing–original draft. CH: Investigation, Methodology, Validation, Writing–review and editing. SG: Investigation, Validation, Writing–review and editing. JT: Investigation, Validation, Writing–review and editing. WH: Writing–review and editing.
Funding
The author(s) declare that financial support was received for the research, authorship, and/or publication of this article. This research was funded by the R&D Project of Guangzhou Power Supply Bureau of Guangdong Power Grid, Co., Ltd, grant number No. 030103KK52220007/GDKJXM20220286.
Acknowledgments
Special thanks to all the institutions and colleagues who provided help and support for this study.
Conflict of interest
Authors YL, CH, SG, JT, and WH were employed by Guangzhou Power Supply Bureau of Guangdong Power Grid Co., Ltd.
The remaining author declares that the research was conducted in the absence of any commercial or financial relationships that could be construed as a potential conflict of interest.
The authors declare that this study received funding from Guangzhou Power Supply Bureau of Guangdong Power Grid, Co., Ltd. The funder had the following involvement in the study: conceptualization and design of the article, collection of initial data, review of the article.
Publisher’s note
All claims expressed in this article are solely those of the authors and do not necessarily represent those of their affiliated organizations, or those of the publisher, the editors and the reviewers. Any product that may be evaluated in this article, or claim that may be made by its manufacturer, is not guaranteed or endorsed by the publisher.
References
Benetti, G., Casagrande, D., Giannuzzi, G., Livi, S., and Moser, D. (2014). Real-time modeling and control of electric vehicles charging processes. IEEE Trans. Smart Grid 6 (3), 1375–1385. doi:10.1109/TSG.2014.2376573
Boribun, B. (2019). Modeling and analysis of the plug-in electric vehicles charging in the unbalanced radial distribution system. Int. J. Electr. Electron. Eng. and Telecommun. 8 (3), 133–138. doi:10.18178/ijeetc.8.3.133-138
Carpinelli, G., Celli, G., Mocci, S., Pilo, F., and Russo, A. (2017). Minimizing unbalances in low-voltage microgrids: optimal scheduling of distributed resources. Appl. Energy 191, 170–182. doi:10.1016/j.apenergy.2017.01.057
Crozier, C., Morstyn, T., McCulloch, M. D., and Chilvers, A. (2020). The case for Bi-directional charging of electric vehicles in low voltage distribution networks. Appl. Energy 259, 114214. doi:10.1016/j.apenergy.2019.114214
Díaz-Dorado, E., Cidrás Pidre, J., and Míguez García, E. (2003). Planning of large rural low-voltage networks using evolution strategies. IEEE Trans. Power Syst. 18 (4), 1594–1600. doi:10.1109/TPWRS.2003.818741
Díaz-Dorado, E., Miguez, E., and Cidrás, J. (2001). Design of large rural low-voltage networks using dynamic programming optimization. IEEE Trans. Power Syst. 16 (4), 898–903. doi:10.1109/59.962443
Gahrooei, Y. R., Khodabakhshian, A., and Hooshmand, R.-A. (2017). A new pseudo load profile determination approach in low voltage distribution networks. IEEE Trans. Power Syst. 33 (1), 463–472. doi:10.1109/TPWRS.2017.2696050
Guo, R., Meunier, S., Protopapadaki, C., and Saelens, D. (2023). A review of European low-voltage distribution networks. Renew. Sustain. Energy Rev. 173, 113056. doi:10.1016/j.rser.2022.113056
Han, Y., Chen, Y., Han, F., and Liu, K. R. (2012). “An optimal dynamic pricing and schedule approach in V2G,” in Proceedings of the 2012 asia pacific signal and information processing association annual summit and conference, 03-06 December 2012 (Hollywood, CA, USA: IEEE), 1–8.
Mateo, C., Marti, J., Perez, R., Smith, P., Gangale, F., Frías, P., et al. (2018). European representative electricity distribution networks. Int. J. Electr. Power and Energy Syst. 99, 273–280. doi:10.1016/j.ijepes.2018.01.027
Mavromatidis, G., Orehounig, K., and Carmeliet, J. (2018). Design of distributed energy systems under uncertainty: a two-stage stochastic programming approach. Appl. Energy 222, 932–950. doi:10.1016/j.apenergy.2018.04.019
Mets, K., Verschueren, T., Haerick, W., Develder, C., and De Turck, F. (2011). “Exploiting V2G to optimize residential energy consumption with electrical vehicle (dis) charging,” in 2011 IEEE first international workshop on smart grid modeling and simulation (SGMS), 17-17 October 2011 (Brussels, Belgium: IEEE). doi:10.1109/SGMS.2011.6089203
Moon, S.-K., and Kim, J.-O. (2017). Balanced charging strategies for electric vehicles on power systems. Appl. Energy 189, 44–54. doi:10.1016/j.apenergy.2016.12.025
Navarro, A., and Rudnick, H. (2009). Large-scale distribution planning—Part I: simultaneous network and transformer optimization. IEEE Trans. Power Syst. 24 (2), 744–751. doi:10.1109/TPWRS.2009.2016593
Pimm, A. J., Cockerill, T. T., and Taylor, P. G. (2018). The potential for peak shaving on low voltage distribution networks using electricity storage. J. Energy Storage 16, 231–242. doi:10.1016/j.est.2018.02.002
Sangob, S., and Sirisumrannukul, S. (2021). Optimal sequential distribution planning for low-voltage network with electric vehicle loads. Front. Energy Res. 9, 673165. doi:10.3389/fenrg.2021.673165
Scheidler, A., Thurner, L., and Braun, M. (2018). Heuristic optimisation for automated distribution system planning in network integration studies. IET Renew. Power Gener. 12 (5), 530–538. doi:10.1049/iet-rpg.2017.0394
Shapiro, A., and Philpott, A., 2007. A tutorial on stochastic programming. Available at: www.isye.gatech.edu/ashapiro/publications.html,17.
Soares, J., Sousa, T., Morais, H., Vale, Z., and Faria, P. (2011). “An optimal scheduling problem in distribution networks considering V2G,” in 2011 IEEE symposium on computational intelligence applications in smart grid (CIASG), 11-15 April 2011 (Paris, French Guiana: IEEE). doi:10.1109/CIASG.2011.5953342
Tan, K. M., Ramachandaramurthy, V. K., and Yong, J. Y. (2016). Optimal vehicle to grid planning and scheduling using double layer multi-objective algorithm. Energy 112, 1060–1073. doi:10.1016/j.energy.2016.07.008
Tan, Y., Wang, L., Yang, F., Xiong, W., and Wang, J. (2014). A two-stage stochastic programming approach considering risk level for distribution networks operation with wind power. IEEE Syst. J. 10 (1), 117–126. doi:10.1109/JSYST.2014.2350027
Verheggen, L., Ferdinand, R., and Moser, A. (2016). “Planning of low voltage networks considering distributed generation and geographical constraints,” in 2016 IEEE international energy conference (ENERGYCON), 04-08 April 2016 (Leuven, Belgium: IEEE). doi:10.1109/ENERGYCON.2016.7514042
Wang, L., Zhang, H., Li, Y., and Liu, J. (2015). “Research on the methods of low-voltage distribution network planning,” in 2015 2nd international conference on electrical, computer engineering and electronics, May 29-31, 2015 (Jinan, China: Atlantis Press), pp.1498–1501. doi:10.2991/icecee-15.2015.282
Wu, F., and Sioshansi, R. (2017). A two-stage stochastic optimization model for scheduling electric vehicle charging loads to relieve distribution-system constraints. Transp. Res. Part B Methodol. 102, 55–82. doi:10.1016/j.trb.2017.05.002
Keywords: low-voltage distribution network (LVDN), load balancing distribution, two-stage stochastic programming, street information, vehicle to grid (V2G)
Citation: Lu Y, Gong Y, Huang C, Gu S, Tong J and Huang W (2024) A low voltage load balancing distribution method considering street information and V2G technology application. Front. Energy Res. 12:1479216. doi: 10.3389/fenrg.2024.1479216
Received: 11 August 2024; Accepted: 09 September 2024;
Published: 20 September 2024.
Edited by:
Zhenjia Lin, Hong Kong Polytechnic University, Hong Kong SAR, ChinaReviewed by:
Yixuan Chen, The University of Hong Kong, Hong Kong SAR, ChinaXuehan Zhang, Fuzhou University, China
Wei Gan, Cardiff University, United Kingdom
Copyright © 2024 Lu, Gong, Huang, Gu, Tong and Huang. This is an open-access article distributed under the terms of the Creative Commons Attribution License (CC BY). The use, distribution or reproduction in other forums is permitted, provided the original author(s) and the copyright owner(s) are credited and that the original publication in this journal is cited, in accordance with accepted academic practice. No use, distribution or reproduction is permitted which does not comply with these terms.
*Correspondence: Yushen Gong, MjU0NDQ5MzM4QHFxLmNvbQ==
 Youfei Lu1
 Yushen Gong