- China Energy Engineering Group Guangdong Electric Power Design Institute Co., Ltd., Guangzhou, China
This paper studies how to integrate the smart charging of large-scale electric vehicles (EVs) into the generation and storage expansion planning (GSEP), while analyzing the impact of smart charging on the GSEP of a real power system in south China. For this purpose, a random simulation-based method is first developed to provide the tractable formulations of the adjustable charging load and reserve provision from EVs. This method avoids the unrealistic assumption that EVs drive and charge every day, which often exists in prior relevant approaches. Based on the random simulation, this paper proposes a novel GSEP optimization model which incorporates the weekly adjustable charging load of EVs. In the proposed model, the total charging load of EVs can be co-optimized with the investment and operational decisions of various generation and storage units. This GSEP model is applied to a provincial power system in south China. The numerical results show that the implementation of smart charging can significantly alter the decisions of GSEP. As the participation rate of smart charging improves from 0% to 90%, there is an additional 1,800 MW installation in wind and solar power, while the need to build new batteries is noticeably reduced; also, depending on the level of EV uptake, the annualized total system cost decreases by 5.11%–7.57%, and the curtailment of wind and solar power is reduced by 10.34%–19.64%. Besides, numerical tests reveal that the traditional assumption that EVs drive and charge every day can mislead the evaluation of adjustable charging load and overestimate the daily charging power peak by averagely 24.72%.
1 Introduction
Electric vehicles (EVs) are seen as a prominent solution for decarbonizing personal transport, and the transport sector has started to shift away from fossil fuels and path the way toward its decarbonization. In recent years, the global number of EVs has been growing rapidly, and it is expected to increase from almost 30 million in 2022 to about 240 million in 2030, achieving an average annual growth rate of about 30% (IEA, 2023). EVs have been also promoted vigorously by both policymakers and industry stakeholders in China (IEA, 2023), (IEA, 2020), with 9.44 million EVs produced in 2023 (National Bureau of Statistics, 2024). And from January to March of 2024, the market share of EVs in China has reached 31.1% (CAAM, 2024).
With the increasing penetration level of EV, the charging of EVs is expected to gradually impact power systems from various aspects, e.g., the increasing charging demand leads to additional generation and storage capacities (Syla et al., 2024); the charging of millions of EVs requires the upgrade of distribution feeders (Jenn and Highleyman, 2022); numerous EVs increase the system loading resulting in weakening of the system reliability (Božič and Pantoš, 2015); the power quality and voltage stability are also likely to be affected (Torres et al., 2022).
To tackle with the negative impact of high EV penetration, smart charging of EVs is an effective measure by reducing the peak system demand (Spencer et al., 2021), (Anwar et al., 2022). Under smart charging, EVs participate in a demand response program in which an aggregator (utility or third-party) remotely controls the charging time and power through the charger or vehicle software; the charging of EVs is shifted in time to reduce the peak system loading or accommodate the abundant renewable generation, with the EV owners getting rewarded by adjusting their charging plans (Syla et al., 2024).
Smart charging can benefit power systems from different aspects. The work in (Szinai et al., 2020) reveals that the smart charging of EVs in California saves grid operational costs and reduces renewable energy curtailment up to 40%. The benefits of smart charging are also identified in lowering operational cost and carbon emissions in France (Lauvergne et al., 2022). Another study highlights that smart charging in Great Britain can act as an effective non-network alternative to conventional grid reinforcement (Borozan et al., 2022).
Long-term generation expansion planning (GEP) is a complex task, which aims at determining the optimal investment plan on the generation portfolio (Gómez and Olmos, 2024), (Li et al., 2024). Some studies have attempted to incorporate large-scale EVs and smart charging into GEP problems. For instance, the work in (Taljegard et al., 2019) integrates the flexible EV charging into the GEP of Scandinavian-German and suggests that smart charging helps reduce the new investment on local peak power capacity and solar power. The study in (Manríquez et al., 2020) models the shifting of daily EV load in a long-term generation and transmission expansion model, and different to (Taljegard et al., 2019), it points out that smart charging allows for more installation of solar power in Chile. Reference (Ramirez et al., 2016) considers the charging optimization of EVs in GEP while accounting for the cost to enable charging flexibility, and the case studies in U.K. show the capability of EVs in reducing peak demand and absorbing wind variability. Further, the research in (Carrión et al., 2019) includes the controllability of EV charging in a stochastic generation and storage expansion planning (GSEP) model, with the findings that the EV flexibility in a regional network in Spain enables for more solar and less batteries to be installed but has no obvious impact on wind installation. The impact of smart charging on the Chinese power sector is also analyzed in (Li et al., 2021) based on a customized GSEP model for China, and the results suggest that the aggressive EV deployment using smart charging, coupled with the development of renewables, can make China meet its future carbon cap targets.
Though some works have considered the smart charging of EVs in GEP or GSEP, they have deficiencies in the modelling of the controllable EV charging. The references (Taljegard et al., 2019)- (Carrión et al., 2019) attempt to use a very limited number of deterministic daily driving and charging profiles to evaluate the adjustable charging load, which is inadequate in representing the wide variety of driving and charging behaviors of EVs in reality. Actually, from the perspective of the entire EV fleet, the driving and charging behaviors of EVs are full of randomness (Mandev et al., 2022), (Li et al., 2023), e.g., the starting time of the charging of EVs can be distributed in any time of 1 day, which cannot be accurately represented by a few fixed time points. On the other hand, the increase of the number of driving and charging profiles may obviously enlarge the size of GEP models. The methodology in (Li et al., 2021) fills the gap in (Taljegard et al., 2019)- (Carrión et al., 2019) by employing the random simulation of adjustable charging load. In this method, the random driving and charging behaviors of EVs are represented by proper statistical distributions. However, the method in (Li et al., 2021) relies on an assumption that every EV drives and charges every day, which does not match the reality and may mislead the evaluation of charging load. Moreover, the approach in (Li et al., 2021) can only model the charging load for separate days. That is, this approach cannot be applied to the GEP or GSEP which needs a series of consecutive days to represent the target whole year (e.g., (Ramirez et al., 2016)).
This paper studies how to integrate the smart charging of large-scale EVs into GSEP and analyzes how the smart charging affects the GSEP on a real power system in south China. To this end, the following works are conducted is this paper:
1) Based on the probabilistic modelling of various EV parameters, an improved random simulation method is first developed to model the adjustable charging load and reserve provision from EVs.
2) Based on the random simulation method, this paper proposes a novel optimization model for the GSEP incorporating the adjustable EV charging. In the GSEP model, the shiftable charging load of EVs is co-optimized with the investment and operational decisions of various generation and storage units. This GSEP model is then applied to a provincial power system in south China to investigate the impact of smart charging on GSEP.
Compared to the existing similar research, the study in this paper has the following merits:
• As for the modelling of adjustable charging load, the proposed random simulation method enables more adequate and accurate description of the random driving and charging behaviours of EVs compared to the approaches in (Gómez and Olmos, 2024)- (Manríquez et al., 2020); meanwhile, unlike the approach in (Li et al., 2021), the proposed method does not need the unrealistic assumption that EVs drive and charge every day, and it can provide the tractable formulation of the adjustable charging load and reserve provision from EVs during consecutive days.
• A novel GSEP model incorporating the smart charging of large-scale EVs is developed, which can leverage the adjustability of weekly charging load for power balancing and reserve provision in a tractable way.
• This paper applies the proposed GSEP optimization model to a real provincial power system in south China. This power system is representative of the regions in south China where the market share of EVs is expected to increase rapidly in future and smart charging is also beginning to be promoted. The study in this paper helps understand how the smart charging affects the GSEP of the southern provinces with upcoming high EV penetration.
• This paper also analyses how the settings on the driving and charging frequencies of EVs affect the evaluation of charging load and its adjustability.
This paper is structured as follows. Section 2 presents the improved random simulation method for adjustable charging load. Section 3 gives the mathematical formulation of the proposed GSEP model. Section 4 conducts case studies. Section 5 concludes the paper.
2 Random simulation method for adjustable charging load
Figure 1 illustrates the overall structure of the proposed GSEP model incorporating the random simulation of adjustable charging load. This section will present the details of the random simulation method, together with the advantages of the proposed simulation method over existing methods (e.g., see (Taljegard et al., 2019) (Li et al., 2021)). The formulation of the GSEP model is constructed by improving the work in (Ramirez et al., 2016) and (Gómez-Villarreal et al., 2023), and it will be introduced in the next section.
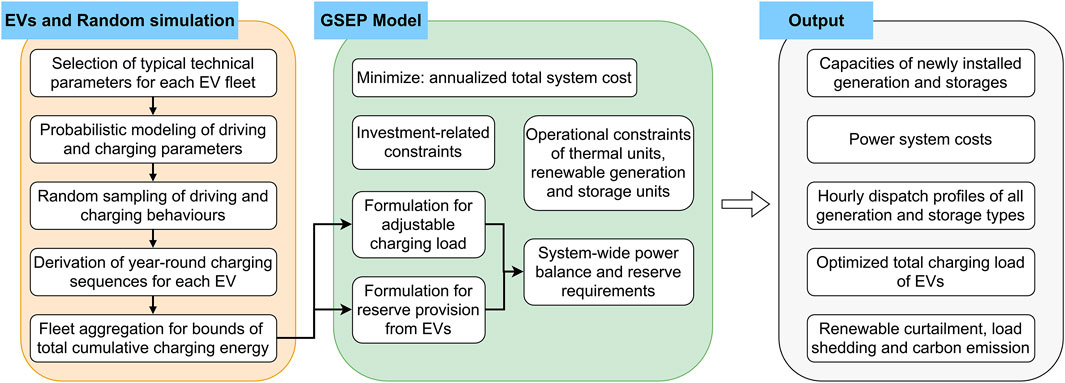
Figure 1. Schematic diagram of the proposed GSEP model incorporating the random simulation of adjustable charging load.
2.1 General description
In this paper, the entire EV population is categorized into eight fleets according to both the purposes and power types of EVs, i.e., private battery EVs (BEVs), private plug-in hybrid EVs (PHEVs), official BEVs, official PHEVs, logistics EVs, electric public buses, e-taxis, and e-hailing EVs.
BEVs exclusively use an electrochemical battery to power an electric motor; PHEVs have both an electric motor with an electrochemical battery and a combustion engine with a petrol tank. Like BEVs, PHEVs can be plugged to charge their batteries. According to the statistical data from the annual report in (Wang and Liang, 2022), about 24.5% of private EVs are PHEVs in China in 2022, and this percentage is 20% for official EVs. Here, official EVs denote the EVs owned by government divisions or enterprises and used for official travels. For other EVs, almost all of them belong to BEVs (Wang and Liang, 2022), so only BEVs are considered here.
Briefly, the simulation method for the adjustable charging load of EVs consists of four steps:
1) Select the typical vehicle models of each EV fleet, and each model is characterized by its battery capacity and electricity usage per km in each season.
2) For each EV fleet, a series of probability density functions (PDFs) are employed to describe the statistical distributions of its driving and charging behaviors.
3) For each EV, its driving and charging behaviors are randomly sampled from proper PDFs, and the charging sequences occurred in a specific target year are derived.
4) Finally, the formulations for the total adjustable charging load and reserve provision from EVs are constructed based on the total cumulative charging energy (CCE) of all charging sessions.
2.2 Probabilistic modelling of EV parameters
To characterize the randomness in EV driving and charging, the PDFs on the following parameters are considered as input:
1) driving parameters of each EV fleet: yearly number of travel days, average daily driving distance.
2) charging parameters of each EV fleet: proportion of each charging pattern, the start time and the latest allowed end time of charging, charging power and efficiency, the state-of-charge (SOC, the ratio of the energy remaining in the battery to the battery capacity) threshold to charge.
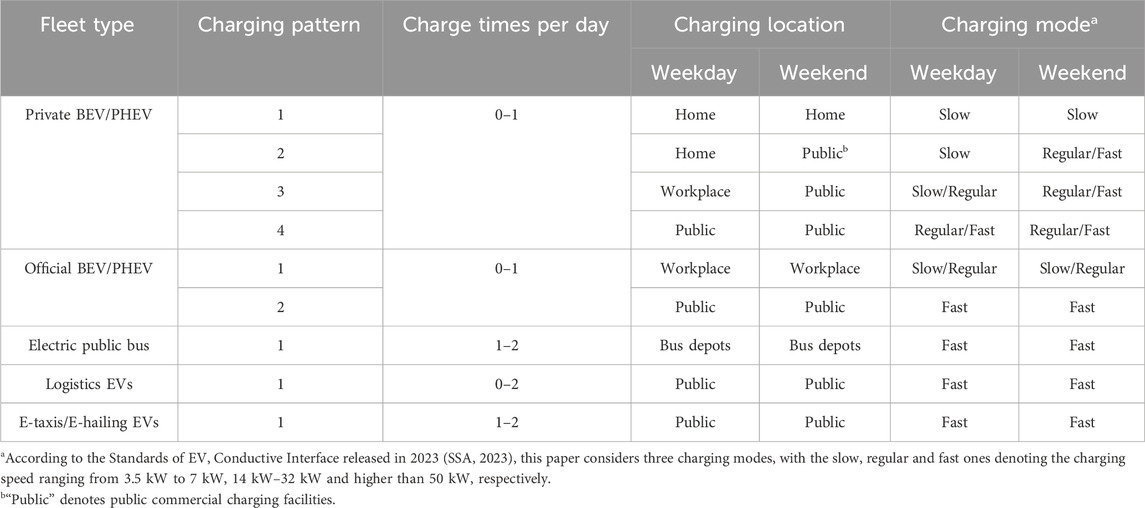
As shown in Table 1, each EV fleet is assumed to follow one or more than one charging patterns. Each charging pattern is characterized by the charging times per day and location and mode of each charging (depending on the type of day). Private EVs are mainly used for commuting on weekdays, and most of them are charged at home overnight or the workplace in the daytime (Sun et al., 2022). On weekends, owners of private EVs can charge their cars at their residences, public charging piles during shopping or charging stations during trips (Luo et al., 2013). Official EVs are basically used for official travels on weekdays (Zheng et al., 2020), and they are assumed to charge in workplaces or charging stations. It is common for the public buses in China to charge overnight after finishing service, and they also need to charge in the daytime if the overnight charging energy cannot satisfy the bus service in the next whole day (Zheng et al., 2020). Logistics EVs, e-taxis and e-hailing EVs are assumed to charge two times per day if the daily driving distance is high, and they prefer fast-charging because the shorter charging time implies more time to finish goods delivery or make profit (Wang and Liang, 2022).
Note that for each EV fleet, different charging patterns may be corresponding to different groups of PDFs on the charging parameters (e.g., the start and latest allowed end time of charging). Those PDFs are also dependent on the types of day (weekday or weekend).
Note that the random simulation methods in the literature often assume that each EV drives and charges every day (e.g., see (Li et al., 2021)), which does not match the reality. Actually, the statistical data in (Wang and Liang, 2022) shows that private and logistics EVs may not drive and charge every day, especially for private ones (see Table 2). In the proposed random simulation method, the yearly numbers of travel days for private and logistics EVs are assumed to follow the PDFs in Figure 2, which are extracted from (Wang and Liang, 2022). Besides, electric public buses and e-taxis and e-hailing EVs, considering their purposes and relatively long driving distance per day, are assumed to drive and charge every day; official EVs are assumed to drive in every working day. Moreover, every private, logistics and official EV is assumed to charge only when its battery SOC drops below a threshold decided by the owner, so that each EV may not charge every day. More details can be found in Section 2.3.

Table 2. Average monthly number of travel days and charge times for private and logistics EVs (Wang and Liang, 2022).
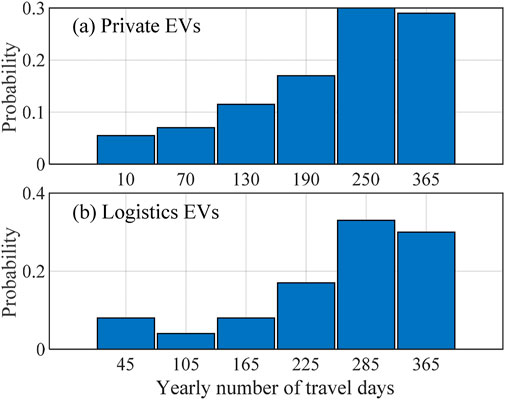
Figure 2. PDFs of yearly number of travel days for private and logistics EVs. (A) Private EVs. (B) Logistics EVs.
2.3 Random sampling and annual charging sequences
Next, the year-round charging sequences of each EV are derived through the following steps, in which the SOC trajectory of each EV is tracked and the days with charging are identified sequentially. Note that each charging sequence is characterized by its start day, start time, end time, charging power and efficiency.
1) According to the typical model parameters of each EV feet, the battery capacity and electricity usage per km of each EV in each day are assigned, i.e.,
2) For each EV, the following parameters are also randomly sampled from the PDFs in Section 2.2: the days in which the EV travels, average daily driving distance
3) Let
4) For EV
5) Let
6) Starting from the day
That is, EV
Note that if the battery SOC of EV
7) In order to fulfill the charging need
If EV
If
If EV
8)
The whole procedure is terminated when
2.4 Total charging load and the formulation of its adjustability
Similar to (Luo et al., 2013), the following types of charging are considered to be controllable: i) charging of private cars at home or workplaces; ii) charging of official cars at workplaces; iii) overnight charging of public buses after they finish daily service. For other types of charging, they have low controllability since they are often asked to be finished as early as possible, such as the charging of taxis which pursue short charging time. Note that for the EVs with controllable charging, the participation rate is introduced to indicate the percentage of EVs which participate into smart charging, i.e., they accept the control of their charging by aggregators.
Next, this paper formulates the adjustable charging load based on the concept of cumulative charging energy (CCE). Specifically, all the charging sessions obtained in Section 2.3 represent the strategy in which each EV is fully charged as early as possible. The CCE of each charging session
where
For a controllable charging session, it can be also postponed as late as possible, with the corresponding EV fully charged just at the latest allowed time
For an uncontrollable charging session, it cannot be postponed so its upper and lower boundaries of CCE are the same.
Then, for all the charging sessions that start in day
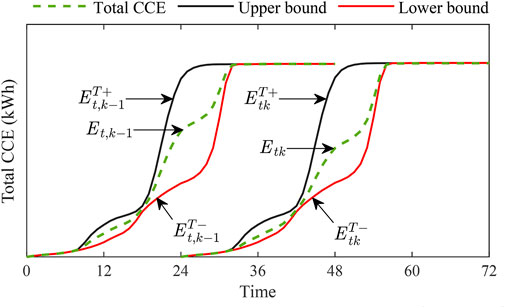
As illustrated in Figure 3, the trajectory of the total CCE
Meanwhile,
According to the definition of
Constraints Equations 11–13 will be incorporated into the proposed GSEP model, with
Remark 1. Constraints Equations 11–13 can be used to formulate the adjustability of charging load in any given days, especially during multiple consecutive days (e.g., 1 week). This overcomes the shortcoming in (Li et al., 2021), which can only model the adjustable charging load in separate days.
2.5 Modelling of the reserve provision from EVs
EVs can provide upward spinning reserve by decreasing their charging power. Let
Note that since the deployment of reserve much not affect the charging demand of all EVs, the reduced total charging power in some time needs to be compensated by the increased total charging power in some other time. As a result,
Likewise, EVs can provide downward reserve by increasing their charging power, and the following constraints can be used to formulate the available provision of downward reserve:
Remark 2. the formulations of adjustable charging load and reserve provision from EVs, i.e., Equations 11–19, involve only linear constraints and their sizes do not increase with the number of EVs. Thus, these formulations are adequate in modelling the smart charging of large-scale EVs in a tractable way. And the integration of these formulations into the proposed GSEP model will not affect the computational efficiency of the model. This is beyond the capability of the existing relevant methods in (Taljegard et al., 2019)- (Carrión et al., 2019).
3 GSEP model incorporating the smart charging of EVs
Based on the formulations of adjustable charging load and reserve provision from EVs in Section 2, the proposed GSEP model incorporating smart charging is introduced in this section.
3.1 Key properties
The general structure of the proposed GSEP model has been presented in Figure 1. The objective of the model is to determine how much new capacity should be invested for each generation and each storage technology. Two levels of decisions are optimized in the formulation. On the capacity expansion (first) level, the model makes decisions on the new capacity of each thermal unit type, renewable type and storage type in a specific target year. On the operational (second) level, the decision variables include the power dispatch of generators and storages and the total charging power of the entire EV fleet. The second level aims to evaluate the adequacy of generation and storage resources through the optimization of power system operation. And inspired to the work in (Gómez-Villarreal et al., 2023) and (Chen et al., 2018), the power system operation is optimized upon the historical data of renewable energy and load. The objective function of the whole model is to minimize the annualized total system cost in the target year.
Besides, a group of typical weeks are used to capture the variability of renewable power and load in the target whole year. The whole model is a large-scale mixed-integer linear optimization (MIP) problem, which can be solved by off-the-shelf solvers, like Gubori (Gurobi, 2023).
3.2 Model formulation
The formulation of the GSEP model is presented as below.
Subject to:
Upper limits on investment:
Unit commitment status equations for thermal units:
Restriction on the number of committed thermal units:
Minimum on/off time of thermal units:
Power output ranges of thermal units:
Limitation on the reserve provision from thermal units:
Ramping limits of thermal units:
Power dispatch and curtailment of renewable power:
Allowable charging/discharging power and reserve provision of energy storages:
Allowable energy level of energy storages:
Daily usage cycles of energy storages:
The adjustable charging load and reserve provision from EVs:
(Equations 11, 12, Equations 14, 15, Equations 17, 18),
(Equation 13, Equation 16, Equation 19),
System-wide power balance:
System-wide upward and downward reserve requirements:
Upper limit on the total carbon emission from power generation:
The objective function Equation 20 formulates the annualized total system cost, where the 1st, 3rd and 5th terms evaluate the annualized investment costs on thermal units, renewable power and storages, respectively; the 2nd and 4th terms give the fixed operational & maintenance (O&M) costs of thermal units and renewable plants, respectively; the 6th to 11th terms defines the penalty cost for exceeding the total carbon emission limit, generation and start-up costs of thermal units, cost of renewable curtailment, operational cost of storages, and cost of load shedding, respectively. Here, the yearly operational cost is defined as the sum of the 2nd, 4th and 6th to 11th terms.
The investment constraints are given by Equations 21–25, which enforce the caps on the number of installed units for each thermal unit type, the installed power capacity of each renewable type and the installed power and energy capacities of each storage type.
The operational constraints of thermal units are stated in Equations 26–37, where Equation 26 expresses the unit commitment status equations, Equation 27, 28 restrict the number of units which are on-line, Equation 29/Equation 30 enforces the minimum on/off time if a thermal unit is start-up/shut-down, Equations 31–33 limit the power output, Equations 34, 35 bound the provision of up- and down-reserve, Equations 36, 37 represent the upward and downward ramping limits.
The available power dispatch and curtailment of renewable generation is expressed through Equations 38, 39. The operational constraints of all storage types are given in Equations 40–50, where Equations 40–47 limit the charging and discharging power as well as the provision of upward and downward reserves of each storage type, Equations 48, 49 indicate that the energy level of each storage type must stay within the safe range after the execution of up- and down-reserves, Equation 50 denotes the daily usage cycles in the energy level of each storage type. In this paper, the pumped storage units and batteries are considered. The fast response of these storages makes them adequate for providing upward reserve through the decrease of charging power,
The constraints for the smart charging of EVs are given in Equations 51, 52, which account for the adjustable charging load, i.e., Equations 11–13, and reserve provision, i.e., Equations 14–19, from EVs during all typical weeks. Note that for the
The system-wide power balance, upward and downward reserve requirements are given by Equations 53–56, respectively. Inspired by (Ramirez et al., 2016), (Zhao et al., 2022), the carbon emission-related constraints are presented in Equations 57–59, where Equation 57 calculates the power generation-related carbon emission
4 Case studies
The proposed GSEP model is applied to a real provincial power system in south China. The objective is to investigate the impact of smart charging on local GSEP and test the effectiveness of the GSEP model. The numerical study focuses on the year of 2035, when the target province is expected to have a high level of EV penetration. The time resolution is 1 hour.
4.1 System overview
The peak power generation in the target province is 6430 MW in 2022. By the end of 2024, the installed capacity of coal-fired, nature-gas and nuclear power units will be 2760 MW, 5520 MW and 1300 MW, respectively. In 2024, the installed capacities of onshore wind power, solar power and hydropower are 290 MW, 5090 MW and 930 MW, respectively. The power capacities of pumped hydro units and batteries are 600 MW and 247 MW, with energy capacities of 3,600 MWh and 494 MWh, respectively.
EVs have been promoted vigorously by the local government. By the end of 2023, there are 1.99 million cars in the target province, increased by about 10% from 2022. And 14.69% of local cars (i.e., 0.29 million) are EVs, with 83.59% of them belonging to BEVs and the rest PHEVs. In 2023, about half of the new cars are EVs. According to the local government’s development planning, more than 60% of new cars will be EVs in 2025, and more than 45% of cars on road are expected to be EVs in 2030, with all public buses, taxis and e-hailing cars powered by electricity or other clean energy in the same year.
4.2 Case settings
By analyzing the historical yearly peak load and future possible economic gain of the target province, the annual growth rate of local power demand is assumed as 7.81%, with the peak load in 2035 expected to reach 17,100 MW. As the utilization of hydropower resources in the target province has reached a high level, the possibility of increasing further the hydro capacity is not considered here. Under the background of promoting the utilization of clean energy, the target province will not build any new coal-fired power units. And according to the development plan of the local government, the maximum potentials to build new natural-gas power, nuclear power, offshore wind power and solar power from 2024 to 2035 are 2938 MW, 2400 MW, 6000 MW and 3500 MW, respectively. This shows that the local government is ambitious in developing renewable power. Note that due to the limitation of land resource and adequacy of marine wind energy resource in the target province, only offshore wind power will be developed in the future. The potentials for new pumped storage units and batteries are both 1500 MW.
Besides, the parameters of thermal unit types, renewable types and storage types can be found in Supplementary Tables S1-S3, and they are provided by the power grid company in the target province, except
According to the operational practice in the target province, nuclear plants are set to keep the maximum output, and the penalty price for load shedding is 15,000 CNY/MWh. For the reserve factors,
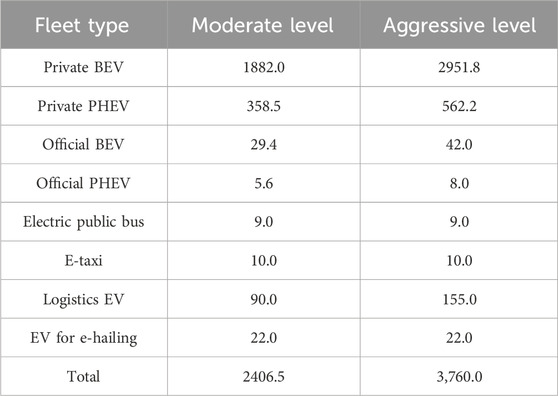
According to the promotion plan of EVs in the target province, the predicted population of each EV fleet in 2035 is shown in Table 3, in which two different levels of EV uptake are considered. The driving and charging frequencies of each EV fleet are set according to the specifications in Section 2.2. The typical technical parameters of each EV fleet are given in Supplementary Table S4, which are obtained by aggregating the parameters of hot-selling EV models in China. The charging parameter-related PDFs are shown in Supplementary Figure S1 and Table 5, which are constructed based on the statistical information in (Wang and Liang, 2022) and (Ma et al., 2023). The PDFs of the daily average driving distance for all EV types are fitted based on the relevant histograms in (Wang and Liang, 2022) and (Ma et al., 2023), and they are plotted in Supplementary Figure S2.
In this numerical study, the following scenarios are considered:
1) Mod-
2) Agg-
Note that smart charging is not implemented if
All numerical cases are coded in MATLAB via YALMIP on a laptop with Intel Core i5-1240P CPU and 16GB RAM, and all the optimization problems are solved by GUROBI with the MIP gap tolerance set at 0.02%.
4.3 Impact of smart charging on expansion planning
Table 4 compares the capacities of newly installed generation and storage types under different scenarios. It can be seen that under the moderate or aggressive level of EV uptake, the optimal additions of wind and solar power both increase as the participation rate of smart charging increases from 0% to 45%, while the new battery capacity drops to a very low level or even zero. As the participation rate further improves to 90%, more wind and solar are newly installed while no batteries need to be built. The new installations of other generation and storage technologies remain unchanged under different participation rates.

Table 4. Capacities of newly installed generation and storage types under different scenarios (unit: MW).
Table 5 lists the breakdown of costs for different scenarios. Under the moderate level of EV uptake, the yearly operational cost and annualized total system cost decrease by 7.82% and 5.11%, respectively, as the participation rate of smart charging improves from 0% to 90%. For the aggressive level of EV penetration, these two percentages are 9.67% and 7.57%, respectively. These results imply that the application of smart charging helps reduce the operational cost and total system cost, and such benefit is larger under higher level of EV uptake. Also, Table 5 shows that the reduction in total system cost mainly comes from the decrease in operational cost.
Table 6 gives the indices about the renewable accommodation, load shedding and carbon emission under different scenarios. It is found that the renewable curtailment rates decrease as more EVs participate into smart charging, together with an increase of 3.12–3.33 percentage points in the share of wind and solar generation. The post-simulation analysis finds that the renewable curtailment is reduced by 10.34%–19.64% as the participation rate of smart charging improves from 0% to 90%. These results reveal that the implementation of smart charging can enhance the utilization level of wind and solar power. Also, it is seen from Table 6 that the promotion of smart charging is helpful in reducing the annual rate of load shedding. In addition, the total carbon emission is reduced by 4.86%–5.29% when the participation rate of smart charging increases from 0% to 90%.
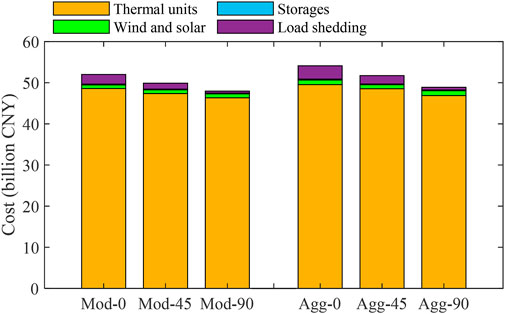
Actually, the increased generation of wind and solar power and decreased load shedding through the use of smart charging are two main reasons for the reduced operational cost. With more generation from wind and solar, the fossil fuel-based generation can be reduced, decreasing the operational cost from thermal units. Meanwhile, the lower amount of load shedding can also noticeably reduce the operational cost due to its high penalty price. These two points are more clearly depicted in Figure 4, where the breakdown of yearly operational cost is plotted. Besides, the less use of fossil fuel also contributes to the lower carbon emission from power generation.
To explain why smart charging allows for more wind and solar to be installed, the total charging loads and system net loads during two typical weeks under scenarios Mod-0 and Mod-90 are extracted and plotted, see Figure 5. Here, the system net load is defined as the sum of total system load (with or without EV load) minus the available wind and solar power from existing renewable plants. Figure 5 shows that after the application of smart charging, a large portion of charging load at night (18:00–24:00, when the system net load without EVs is high) is shifted to the early morning (2:00–7:00, when the system net load without EVs is low). As a result, the peak of the system net load with EVs is reduced. Also, the system net load in the early morning is increased, yielding less steep ramp of the net load from the peak to the valley. That is, the system net load is smoothed. The lower peak and less steep ramp of the net load means lower operational pressure for other controllable generating and storage units, such as fewer thermal units required to run at their upper/lower limits of output. Therefore, these controllable units can have larger spare capability to accommodate the volatile wind and solar power. In other words, more wind and solar power can be installed.
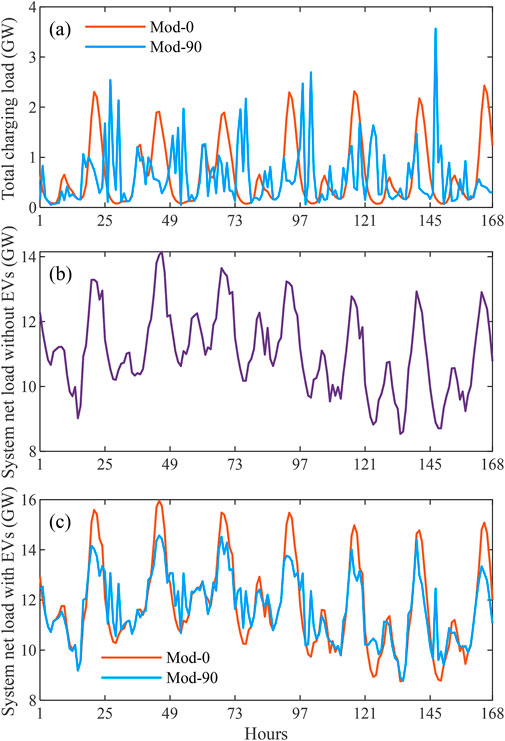
Figure 5. Examples of the weekly total charging load and system net load in scenarios Mod-0 and Mod-90. (A) Total charging load. (B) System net load without EV load. (C) System net load with EV load.
Furthermore, the smoothed net load through smart charging means that EVs can partially play the role of storages in decreasing the fluctuation of net load. Thus, the need to build new storages is reduced. Meanwhile, pumped storage units have lower annualized investment cost per MW than batteries, so the capacity of new batteries drops noticeably after the use of smart charging.
4.4 Impact of the settings about the driving and charging frequencies of EVs
To test the impact of the settings about the driving and charging frequencies of EVs, the following two cases are compared:
1) private and logistics EVs may not drive and charge every day, see the specifications in Section 2.2.
2) private and logistics EVs are set to drive and charge every day.
The other settings remain the same under the two cases. To enable a fair comparison, the annual total driving distance of each private or logistics EV does not change with the simulation case.
Considering the scenario Mod-0, the year-round total charging load under the two cases are calculated and some indices for the calculation results are listed in Table 7. Examples of the total charging loads under the two cases are plotted in Figure 6. Meanwhile, the charging times of private and logistics EVs are extracted from simulation results and presented in Table 8.
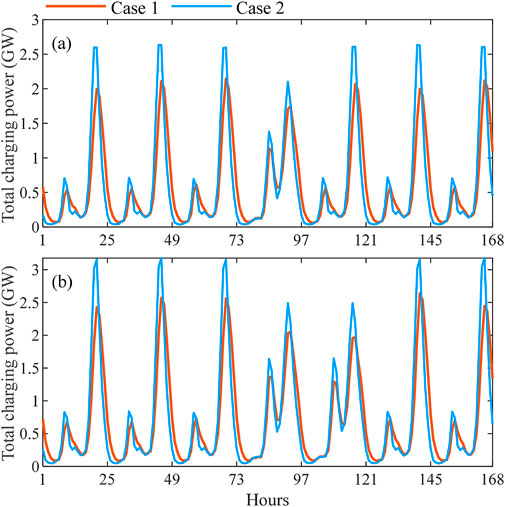
Figure 6. Examples of the weekly total charging load under Case 1 and Case 2. (A) January 31st to February 6th. (B) August 1st to 7th.
From Table 7, it is observed that Cases 1 and 2 have very close results in terms of annual total and average daily charging demand. This is mainly because the annual total driving distance of each private or logistics EV is not affected by the simulation case. However, the values of annual peak and average daily peak of charging power for Case 2 are 20.66% and 24.72% higher than those for Case 1, respectively. A more intuitive presentation is given in Figure 6, where the daily charging power peaks for Case 2 are obviously higher than those in Case 1. These results reveal that the traditional settings that EVs drive and charge every day can cause noticeable overestimation on charging power peak.
The results in Table 8 show that the private EVs in Case 2 charge much more frequent than those in Case 1. Considering that private EVs account for 93.1% of the EV population, it can be speculated that the difference in the charging frequencies of private EVs is the main reason for the difference in the daily charging power peak under the two cases.
The traditional setting that EVs drive and charge every day may also mislead the evaluation of adjustable charging load. This is presented in Figure 7, where the bounds of the total CCE for Cases 1–2 in scenario Mod-90 are plotted. Clearly, there is overall larger room to schedule the total CCE in Case 2 than that in Case 1. In other words, the adjustability of charging load is overestimated in Case 2. The underlying main reason is that nearly all private EVs charge every day in Case 2, significantly increasing the number of controllable EVs for smart charging in each day.
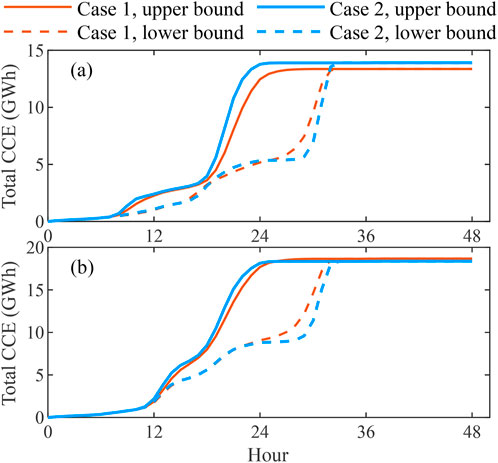
Figure 7. Examples of the bounds of total CCE for Case 1 and Case 2 in scenario Mod-90. (A) February 6th. (B) August 4th.
5 Summary
This paper presents a novel GSEP model which explicitly accounts for the adjustable charging load of large-scale EVs enabled by smart charging. A random simulation-based method is also developed to formulate the adjustable charging load during consecutive days in a tractable way. The weekly adjustable charging load is incorporated into the proposed GSEP model and co-optimized with other investment and operational decisions. Based on the case studies on a provincial power system in south China, some valuable observations are drawn:
• The implementation of smart charging can significantly alter the optimal decisions of GSEP. As the participation rate of smart charging improves from 0% to 90%, there is an increase of around 1800 MW in the total installation of wind and solar power, together with a 5.11%–7.57% decrease in the annualized total system load. Moreover, smart-charging EVs can partially play the role of batteries in smoothing the system net load, thus decreasing the need of installing new batteries.
• Smart charging can also affect the utilization level of wind and solar power and the carbon emission. As the participation rate increases from 0% to 90%, the overall curtailment of renewable power decreases by 10.34%–19.64%, and the total carbon emission from power generation is reduced by 4.86%–5.29%.
• The settings about the driving and charging frequencies of private EVs have a non-negligible impact on the evaluation of charging load, and the traditional assumption that private EVs drive and charge every day can cause the overestimation of both daily charging power peak (averagely by 24.72%) and the adjustability of charging load.
• The proposed random simulation method and GSEP model can serve as decision-support tools for power system planners who aim to leverage the flexibility from smart-charging EVs in a tractable and efficient way.
Data availability statement
The original contributions presented in the study are included in the article/Supplementary Material, further inquiries can be directed to the corresponding author.
Author contributions
LY: Conceptualization, Formal Analysis, Investigation, Methodology, Software, Visualization, Writing–original draft, Writing–review and editing. XJ: Project administration, Supervision, Writing–review and editing. YL: Project administration, Supervision, Writing–review and editing.
Funding
The author(s) declare that financial support was received for the research, authorship, and/or publication of this article. This research was funded by Science and Technology Project of China Energy Engineering Group Guangdong Electric Power Design Institute Co., Ltd. (EV11031W).
Acknowledgments
Thanks for the funding provided by China Energy Engineering Group Guangdong Electric Power Design Institute Co., Ltd.
Conflict of interest
Authors LY, XJ, and YL were employed by China Energy Engineering Group Guangdong Electric Power Design Institute Co., Ltd.
The authors declare that this study received funding from China Energy Engineering Group Guangdong Electric Power Design Institute Co., Ltd. The funder had the following involvement in the study: data collection and decision to publish.
Publisher’s note
All claims expressed in this article are solely those of the authors and do not necessarily represent those of their affiliated organizations, or those of the publisher, the editors and the reviewers. Any product that may be evaluated in this article, or claim that may be made by its manufacturer, is not guaranteed or endorsed by the publisher.
Supplementary material
The Supplementary Material for this article can be found online at: https://www.frontiersin.org/articles/10.3389/fenrg.2024.1472216/full#supplementary-material
References
Anwar, M. B., Muratori, M., Jadun, P., Hale, E., Bush, B., Denholm, P., et al. (2022). Assessing the value of electric vehicle managed charging: a review of methodologies and results. Energy Environ. Sci. 15 (2), 466–498. doi:10.1039/d1ee02206g
Baseline emission factor (2024). Baseline emission factors in China regional power grids for 2023 emission reduction projects. Natl. Cent. Clim. Change Strategy Int. Coop. Available at: http://www.ncsc.org.cn/SY/zywj/202407/t20240709_1081217.shtml (Accessed July 16, 2024).
Borozan, S., Giannelos, S., and Strbac, G. (2022). Strategic network expansion planning with electric vehicle smart charging concepts as investment options. Adv. Appl. Energy 5, 100077. doi:10.1016/j.adapen.2021.100077
Božič, D., and Pantoš, M. (2015). Impact of electric-drive vehicles on power system reliability. Energy 83, 511–520. doi:10.1016/j.energy.2015.02.055
CAAM (2024). “Information conference of China association of automobile manufacturers in March 2024,” in China Association of Automobile Manufacturers, March 2024. Available at: http://www.caam.org.cn/chn/4/cate_154/con_5236377.html (Accessed April, 2024).
Carrión, M., Domínguez, R., and Zárate-Miñano, R. (2019). Influence of the controllability of electric vehicles on generation and storage capacity expansion decisions. Energy 189, 116156. doi:10.1016/j.energy.2019.116156
Chen, X., Liu, Y., Wang, Q., Lv, J., Wen, J., Chen, X., et al. (2021). Pathway toward carbon-neutral electrical systems in China by mid-century with negative CO2 abatement costs informed by high-resolution modeling. Joule 5 (10), 2715–2741. doi:10.1016/j.joule.2021.10.006
Chen, X., Lv, J., McElroy, M. B., Han, X., Nielsen, C. P., and Wen, J. (2018). Power system capacity expansion under higher penetration of renewables considering flexibility constraints and low carbon policies. IEEE Trans. Power Syst. 33 (6), 6240–6253. doi:10.1109/TPWRS.2018.2827003
Gómez, S., and Olmos, L. (2024). Coordination of generation and transmission expansion planning in a liberalized electricity context — coordination schemes, risk management, and modelling strategies: a review. Sustain. Energy Technol. Assess. 64, 103731. doi:10.1016/j.seta.2024.103731
Gómez-Villarreal, H., Cañas-Carretón, M., Zárate-Miñano, R., and Carrión, M. (2023). Generation capacity expansion considering hydrogen power plants and energy storage systems. IEEE Access 11, 15525–15539. doi:10.1109/ACCESS.2023.3244343
Gurobi (2023). Gurobi optimizer reference manual. Gurobi optimization, LLC. Available at: https://www.gurobi.com (Accessed July 20, 2024).
IEA (2020). New energy vehicle industry development plan (2021-2035). China: General Office of the State Council. Available at: http://www.gov.cn/zhengce/content/2020-11/02/content_5556716.htm (Accessed May 16, 2023).
IEA (2023). Global EV outlook 2023. Paris: International Energy Agency. Available at: https://www.iea.org/reports/global-ev-outlook-2023 (Accessed April, 2023).
IRENA (2012). Renewable energy technologies: cost analysis series. Int. Renew. Energy Agency. Available at: https://www.irena.org/-/media/Files/IRENA/Agency/Publication/2012/RE_Technologies_Cost_Analysis-HYDROPOWER.pdf (Accessed June, 2012).
Jenn, A., and Highleyman, J. (2022). Distribution grid impacts of electric vehicles: a California case study. iScience 25 (1), 103686. doi:10.1016/j.isci.2021.103686
Lauvergne, R., Perez, Y., Françon, M., and Tejeda De La Cruz, A. (2022). Integration of electric vehicles into transmission grids: a case study on generation adequacy in Europe in 2040. Appl. Energy 326, 120030. doi:10.1016/j.apenergy.2022.120030
Li, B., Ma, Z., Hidalgo-Gonzalez, P., Lathem, A., Fedorova, N., He, G., et al. (2021). Modeling the impact of EVs in the Chinese power system: pathways for implementing emissions reduction commitments in the power and transportation sectors. Energy Policy 149, 111962. doi:10.1016/j.enpol.2020.111962
Li, J., Lu, T., Yi, X., An, M., and Hao, R. (2024). Energy systems capacity planning under high renewable penetration considering concentrating solar power. Sustain. Energy Technol. Assess. 64, 103671. doi:10.1016/j.seta.2024.103671
Li, Z., Xu, Z., Chen, Z., Xie, C., Chen, G., and Zhong, M. (2023). An empirical analysis of electric vehicles’ charging patterns. Transp. Res. Part Transp. Environ. 117, 103651. doi:10.1016/j.trd.2023.103651
Luo, Z., Hu, Z., Song, Y., Xu, Z., and Lu, H. (2013). Optimal coordination of plug-in electric vehicles in power grids with cost-benefit analysis—part II: a case study in China. IEEE Trans. Power Syst. 28 (4), 3556–3565. doi:10.1109/TPWRS.2013.2252028
Ma, J., Gan, Q., and Li, T. (2023). Research report on the big data of new energy vehicle in Shanghai (2022). Shanghai, China: Shanghai Jiao Tong University Press.
Mandev, A., Plötz, P., Sprei, F., and Tal, G. (2022). Empirical charging behavior of plug-in hybrid electric vehicles. Appl. Energy 321, 119293. doi:10.1016/j.apenergy.2022.119293
Manríquez, F., Sauma, E., Aguado, J., De La Torre, S., and Contreras, J. (2020). The impact of electric vehicle charging schemes in power system expansion planning. Appl. Energy 262, 114527. doi:10.1016/j.apenergy.2020.114527
National Bureau of Statistics (2024). Statistical bulletin on the national economic and social development of the people’s Republic of China for the year 2023. China: National Bureau of Statistics. Available at: https://www.stats.gov.cn/sj/zxfb/202402/t20240228_1947915.html (Accessed February 29, 2024).
Ramirez, P. J., Papadaskalopoulos, D., and Strbac, G. (2016). Co-optimization of generation expansion planning and electric vehicles flexibility. IEEE Trans. Smart Grid 7 (3), 1609–1619. doi:10.1109/TSG.2015.2506003
Spencer, S. I., Fu, Z., Apostolaki-Iosifidou, E., and Lipman, T. E. (2021). Evaluating smart charging strategies using real-world data from optimized plug in electric vehicles. Transp. Res. Part Transp. Environ. 100, 103023. doi:10.1016/j.trd.2021.103023
SSA (2023). Connection set for conductive charging of electric vehicles—Part 1: general requirements. State Administration for Market Regulation, State Standardization Administration. Available at: https://openstd.samr.gov.cn/bzgk/gb/newGbInfo?hcno=5A456919C33E2C9041B843AB3D36AB67 (Accessed July 26, 2024).
Sun, M., Shao, C., Zhuge, C., Wang, P., Yang, X., and Wang, S. (2022). Uncovering travel and charging patterns of private electric vehicles with trajectory data: evidence and policy implications. Transportation 49 (5), 1409–1439. doi:10.1007/s11116-021-10216-1
Syla, A., Rinaldi, A., Parra, D., and Patel, M. K. (2024). Optimal capacity planning for the electrification of personal transport: the interplay between flexible charging and energy system infrastructure. Renew. Sustain. Energy Rev. 192, 114214. doi:10.1016/j.rser.2023.114214
Szinai, J. K., Sheppard, C. J. R., Abhyankar, N., and Gopal, A. R. (2020). Reduced grid operating costs and renewable energy curtailment with electric vehicle charge management. Energy Policy 136, 111051. doi:10.1016/j.enpol.2019.111051
Taljegard, M., Göransson, L., Odenberger, M., and Johnsson, F. (2019). Impacts of electric vehicles on the electricity generation portfolio – a Scandinavian-German case study. Appl. Energy 235, 1637–1650. doi:10.1016/j.apenergy.2018.10.133
Tidball, R., Bluestein, J., Rodriguez, N., and Knoke, S. (2010). Cost and performance assumptions for modeling electricity generation technologies. National Renewable Energy Laboratory. Available at: https://www.nrel.gov/docs/fy11osti/48595.pdf (Accessed July 22, 2024).
Torres, S., Durán, I., Marulanda, A., Pavas, A., and Quirós-Tortós, J. (2022). Electric vehicles and power quality in low voltage networks: real data analysis and modeling. Appl. Energy 305, 117718. doi:10.1016/j.apenergy.2021.117718
Wang, Z., and Liang, Z. (2022). Annual report on the big data of new energy vehicle in China. Beijing, China: China Machine Press.
Zhao, D., Zhang, S., and Wang, H. (2022). Low carbon economy scheduling of multi-energy combined peak shaving system considering nuclear power participation. J. North China Electr. Power Univ. 49 (3), 9–19. doi:10.3969/j.ISSN.1007-2691.2022.03.02
Zheng, Y., Jiang, Y., and Zhang, J. (2023). Joint planning optimization of source-storage-transportation considering long- and short-term energy storage under high proportion of wind power penetration. Electr. Power Autom. Equip. 43 (3), 63–71. doi:10.16081/j.epae.202205054
Zheng, Y., Shao, Z., Zhang, Y., and Jian, L. (2020). A systematic methodology for mid-and-long term electric vehicle charging load forecasting: the case study of Shenzhen, China. Sustain. Cities Soc. 56, 102084. doi:10.1016/j.scs.2020.102084
Nomenclature
Keywords: generation and storage expansion planning, electric vehicles, smart charging, adjustable charging load, random simulation
Citation: You L, Jin X and Liu Y (2024) Integration of smart charging of large-scale electric vehicles into generation and storage expansion planning: a case study in south china. Front. Energy Res. 12:1472216. doi: 10.3389/fenrg.2024.1472216
Received: 29 July 2024; Accepted: 05 September 2024;
Published: 16 September 2024.
Edited by:
Yirui Wang, Ningbo University, ChinaReviewed by:
Wenjing Shuai, Xidian University, ChinaZewei Zhong, China University of Petroleum, China
Copyright © 2024 You, Jin and Liu. This is an open-access article distributed under the terms of the Creative Commons Attribution License (CC BY). The use, distribution or reproduction in other forums is permitted, provided the original author(s) and the copyright owner(s) are credited and that the original publication in this journal is cited, in accordance with accepted academic practice. No use, distribution or reproduction is permitted which does not comply with these terms.
*Correspondence: Lei You, eW91bGVpNDAzMTE4NEBvdXRsb29rLmNvbQ==
 Lei You
 Xiaoming Jin