- 1Chemical Engineering, School for the Engineering of Matter, Transport, and Energy, Arizona State University, Tempe Arizona, AZ, United States
- 2Materials Science and Engineering, School for the Engineering of Matter, Transport, and Energy, Arizona State University, Tempe Arizona, AZ, United States
- 3ASU LightWorks® and School of Molecular Sciences, Arizona State University, Tempe Arizona, AZ, United States
Thermodynamic modeling of metal oxide reduction is crucial for optimizing chemical processes and materials in systems dependent on off-stoichiometric reduction/re-oxidation cycling. Two prevalent methods for extracting reduction thermodynamics from thermogravimetric data are linearized van ‘t Hoff (VH) analysis and the compound energy formalism (CEF). This work evaluates the accuracy of these methods by constructing invertible ground truth thermodynamic models, generating hypothetical thermogravimetric data, and determining the reduction thermodynamic using both VH and CEF methods. Our findings reveal that the VH method produces absolute errors 3–5 times higher than the CEF in kJ/mol O or J/mol O K for enthalpy and entropy of reduction, respectively. In contrast, the CrossFit CEF (CF-CEF) method yields errors often less than 10 kJ/mol O or J/mol O K. Moreover, the CF-CEF method provides models based on mole fraction, temperature, and extent of reduction, while a typical VH analysis provides thermodynamics of only the specific compositions measured. Although simple to implement, the VH method suffers from significant, non-systematic errors due to entropy/enthalpy compensation and defect modeling. Consequently, we recommend the more complex but robust, CF-CEF method for extracting redox thermodynamics from thermogravimetric measurements.
Introduction
Many chemical processes exploit the flexible cationic oxidation states of metal oxides (
The selection and optimization of redox active metal oxides,
The solid state oxygen chemical potential,
Although the route to converting measured data points into thermodynamic quantities is well defined in principle, i.e., Equation 3, the method for reliably extracting the δ, T, pO2, and mole fraction, x, (TpOX) relationship into thermodynamic quantities remains unclear. While the chemical potential alone dictates the spontaneity of the reaction, the extraction of enthalpy and entropy of reduction from the chemical potential provides crucial information necessary for processes design. Particularly, the enthalpy of reduction is required for managing heat flows and determining if a material carries sufficient energy to drive a desired oxidation reaction. Therefore, accurate extraction of these thermodynamic properties is the key to elucidating controlling properties for the off stoichiometric reactions (i.e., composition, temperature, pressure, etc.). We note that although calorimetry can measure enthalpies of reaction, doing so with solids is complex and would require extensive experimentation to build a compositional or non-stoichiometric dependent model (Yoo et al., 2017).
Currently, one of the most widely used techniques for extracting reduction thermodynamics from experimental data is linearized van ‘t Hoff (VH) analysis (Hashimoto et al., 2023; Yoo et al., 2017; Bayon et al., 2021b; Van’t Hoff and Hoff, 1884). This approach relates the equilibrium constant of redox at a constant δ,
The slope and intercept of a VH plot correlate 1/T and ln (pO2) to the enthalpy
Deploying the VH method presents four main challenges:
1) Delineating entropy and enthalpy from only free energy information.
2) Assuring thermodynamic quantities are temperature independent.
3) Collecting sufficient δ data to mitigate errors associated with constant δ interpolations.
4) Characterizing each composition X independently.
Since only the chemical potential of the oxygen is known and experimental error introduces ambiguity in line fitting, determining the slope and intercept of the VH plot can lead to compensation or trade-off, between entropy and enthalpy terms of the free energy (Yoo et al., 2017). This issue is exacerbated when the experimental temperature range is small, increasing the error in the extrapolated intercept (Hoes et al., 2017). The most commonly adopted approach to VH analysis of TGA redox materials assumes that
The collection of constant δ data is challenging as the off-stoichiometry is unknown a priori; therefore, generally one approximates either by interpolation or by fitting a defect model to predict the points. Arriving at T and pO2 operating points with constant δ is unreliable using interpolation given the high non-linearity of reaction equilibria. Furthermore, correctly and confidently implementing a defect model is also challenging, arising because one can construct defect models in multiple ways (Zhang et al., 2023; Qian et al., 2021; Bergeson-Keller et al., 2022) and depend on making assumptions that may or may not reflect the thermodynamic and reactions occurring. Often, defect models also assume no temperature dependence, which may be the faster/easier estimation of thermodynamics, but, unbeknownst to the analyzer, may deviate vastly from the true thermodynamic trends (Chaires, 1997). These underlying assumptions and interpolated fits of T and pO2 required to construct the defect model exacerbate the errors inherent within the linearized VH method, i.e., an assumed temperature independence of
Finally, each composition must be characterized individually (i.e., each
The Compound Energy Formalism (CEF) (Hillert and Staffansson, 1970) overcomes many of the VH method limitations in characterizing the reduction thermodynamics of a family of
The sub-lattices represent the unique sites in the crystal lattice, each with fractional occupancy by different elements, oxidation states, and/or vacancies. Equations 6–9 show how to calculate these terms.
where
The key drawback to the CEF model approach in fitting thermochemical data is the large number of degrees of freedom (DOF) inherent in the construction of the CEF model. Linear, or near linear, dependencies in the excess term parameters and enthalpy and entropy can arise from the large parameter space. The former makes it challenging to find a global minimum when fitting, while the latter can result in compensation, or tradeoffs, between enthalpy and entropy, which equate to the same free energy. These challenges have prevented the widespread use of the CEF for thermochemical fitting. To solve these problems, we recently developed the CrossFit CEF(CF-CEF) method (Wilson et al., 2023), which reformulates the CEF fitting procedure to circumvent the challenges of linear dependence between some excess terms and delineate entropic and enthalpic contributions to the free energy. The CF-CEF optimizes the CEF model parameters using both computational (ab initio methods) and experimental (TGA) data. The experimental data informs the model via Equation 3, while we incorporate the computational data via the non-derivative free energy relationship
As outlined above, the advantages and disadvantages of the VH and CEF methods, i.e., simplicity but potential ambiguity in accuracy versus complexity but robustness of fit, are well known. However, to the best of our knowledge, no one has reported a quantification of the relative (in-)accuracy of these methods. Therefore, this work compares the accuracy of the linear VH analysis and CF-CEF method using a perfectly invertible, thermodynamic data set based on an Einstein solid model of heat capacity (Rogers, 2005), selected reduction enthalpies, and randomly generated sub-lattice interaction terms. Thus, the ground truth reduction thermodynamics are known exactly providing a means for error analysis between the two methods. In this work, we only examine hypothetical data sets because directly measured experimental data enthalpies and entropy, as opposed to extracted quantities, are not widely available. Three sets of hypothetical perovskite materials
Methods
This section first briefly describes the VH analysis and CF-CEF fitting methods. Then, we explain the construction of the hypothetical ground truth thermodynamic data generated using the heat capacity modeled as an Einstein solid for subsequent fitting by both the VH and CF-CEF approaches. Finaly, we explain how we constructed realistic but hypothetical ground truth thermodynamics data sets. The comparison between methods presented here focuses on the quinary metal oxide perovskite material (
Van ‘t Hoff method construction and implementation
We define a defect model that assumes redox activity occurs only on the B-site of the perovskite as shown in Equation 10. Using Kröger–Vink notation (Kröger and Vink, 1956), we describe the defect reaction charge transfer in Equation 11. We write the equilibrium constant at a constant T (
The defect model allows the determination of constant δ values across many T and pO2 points, Figure 1 (right). For each δ of interest, one must solve for
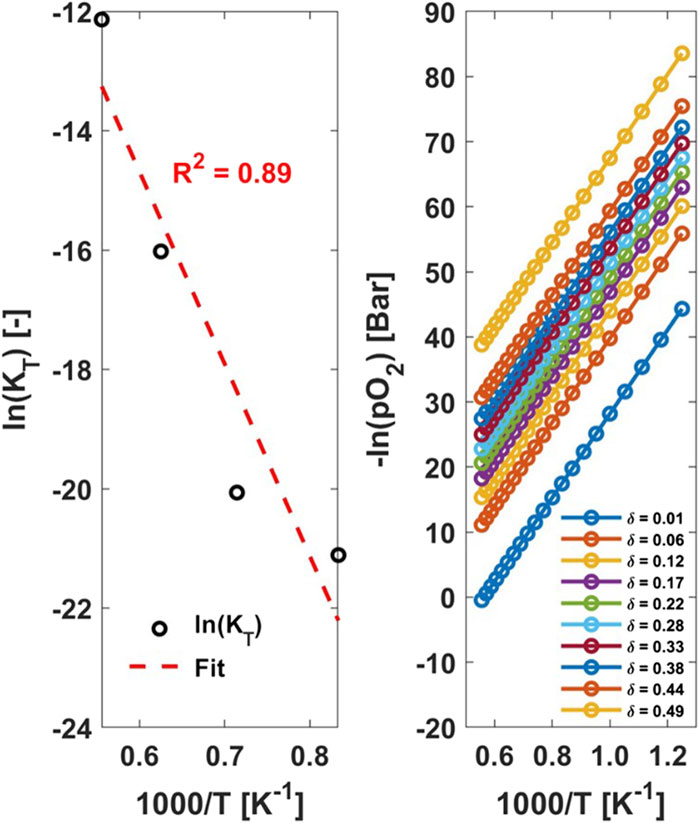
Figure 1. (left) ln (
CrossFit CEF construction and implementation
The CEF construction depends on which sublattice the substitutions sit, i.e., A or B, and will vary in the generic
Note that due to the definite integration of
While the consideration of a constant heat capacity may seem overly simplistic, we find that this expansion describes the enthalpy and entropy of these
Constructing the CEF state function with a definite integral provides a more physical fit, especially with respect to temperature trends, and aids in preventing tradeoff between H and S. However, it causes an inherent error in the fit to the DFT data since
Ground truth model construction, data generation using einstein solid, and error determination
In this section we discuss the construction of an invertible data set by selecting end member reduction energies, imposing a temperature dependence and randomly selecting excess terms. We generate “data points” from the ground truth model with random noise added. We generate a temperature dependent heat capacity (
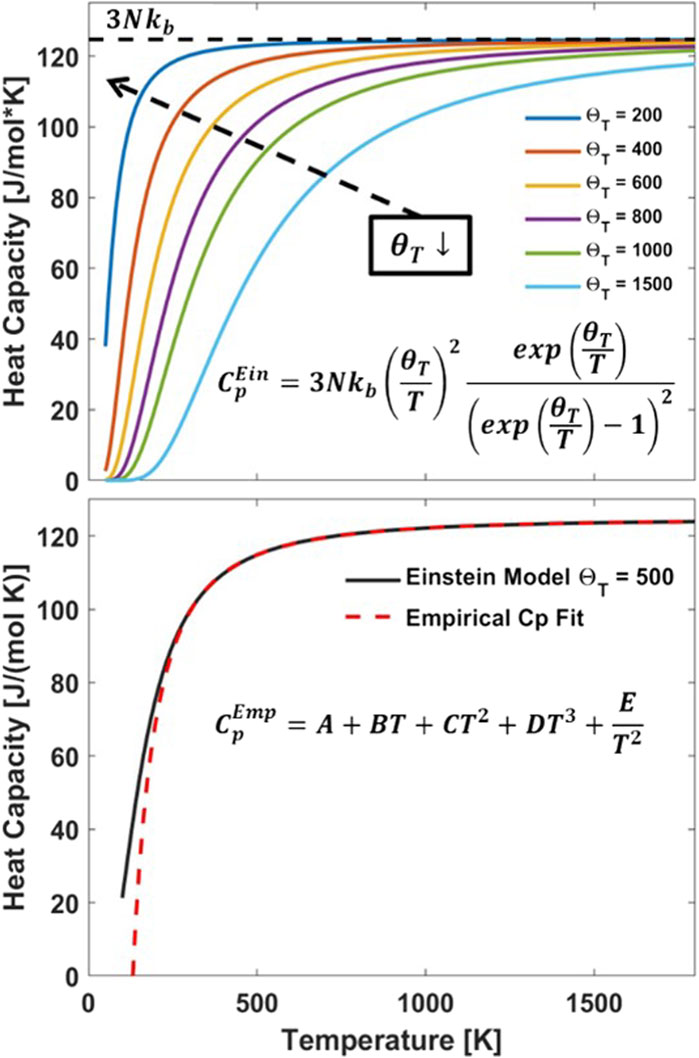
Figure 2. (top) Einstein heat capacity (
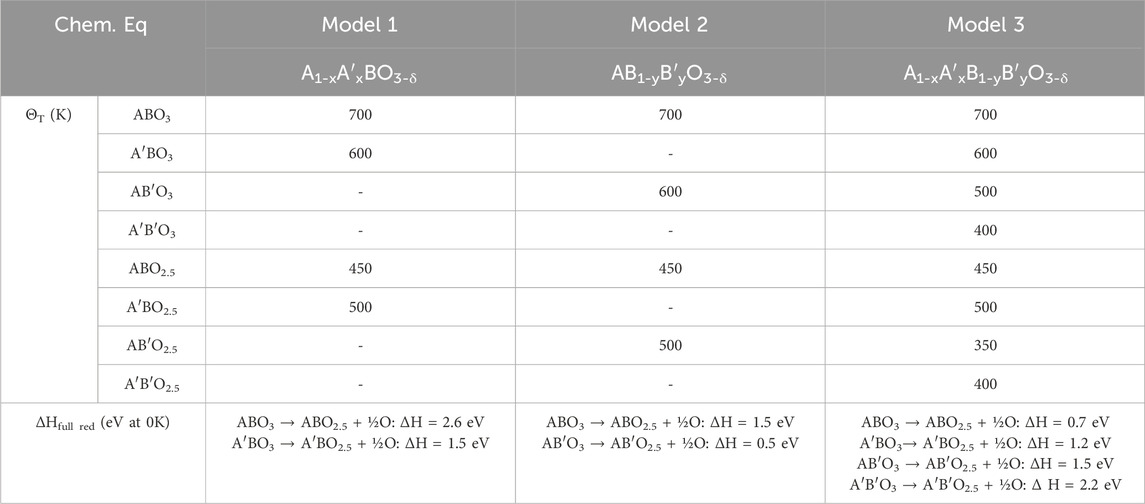
We generated three different ground truth models based on three different materials with varying thermodynamic trends. The materials vary in three ways: 1) the substitutions on the A and B lattice, 2) the reduction energy values for the ternaries (ABO3 →ABO2.5), and 3) the temperature dependence (via
We construct the first model material, Model 1, with reduction enthalpies in a range (1.5–2.2 eV) that enables thermochemical water or CO2 splitting (WS/CDS) with compositional variation on the A sublattice only. We selected the reduction energy values for the unsubstituted and fully substituted material such that the material becomes easier to reduce as x increases from zero to one. The second, Model 2, represents a thermochemical energy storage (TCES) material with lower reduction energies (0.5–1.5 eV) than Model 1. The Model 2 material has substitutions on the B sublattice such that the reduction energy decreases as y increases from zero to one. The final material, Model 3, is a quinary material with compositional variation on both the A and B sublattices. This material’s reduction energies increase from 0.7 to 2.2 eV as x and/or y increases from zero to one.
We randomly select three L terms to include in the model as the controlling excess terms. The SI contains the full list of possible L terms. We include three excess terms as previously done in our earlier work (Wilson et al., 2023; Wilson and Muhich, 2024), which fit real data but showed overfitting characteristics when using more than three excess terms. We did not investigate selecting more or fewer controlling terms, as doing so would only complicate or simplify the model’s curvature without altering the VH/CEF comparison. Selecting fewer or more excess terms to represent the ground truth model would simply create a different material altogether. Further investigation into the CEF functional form and its intricacies is left to future work. A normal distribution with a mean of zero and a standard deviation of 1 × 10⁻³ kJ/mol defines the parameters. Randomly selecting excess terms can result in some constructed models being wildly unphysical. Although we could have fit these hypothetical materials, inaccuracies would obscure whether the method is flawed or the thermodynamic trends are unreasonable. Therefore, we constructed 50 random perturbations and randomly selected models from the physically reasonable constructions. The chosen models met expected physical criteria: 1)
We added random noise in the δ dataset generated from the model thermodynamics to simulate experimental error. The random deviations were based on a normal distribution with a mean of zero and a standard deviation set to a desired noise value. For the work here, we consider two noise (standard deviation) values: 1 × 10⁻³ and 2 × 10⁻³.
To quantify the accuracy of VH and CF-CEF methods, we first determine the average and standard deviation of
Results and discussion
For each hypothetical material, the CF-CEF method outperforms the VH analysis, having error values of tens of kJ/mol or J/Kmol for enthalpy and entropy, respectively. The VH method was inconsistent in either over or underestimating both
Dependence of underlying thermodynamics on the effectiveness of VH and CEF
Base case model 1
Model 1 compares the CF-CEF and VH model performance of a hypothetical WS/CDS material varying in composition on the A sublattice only (
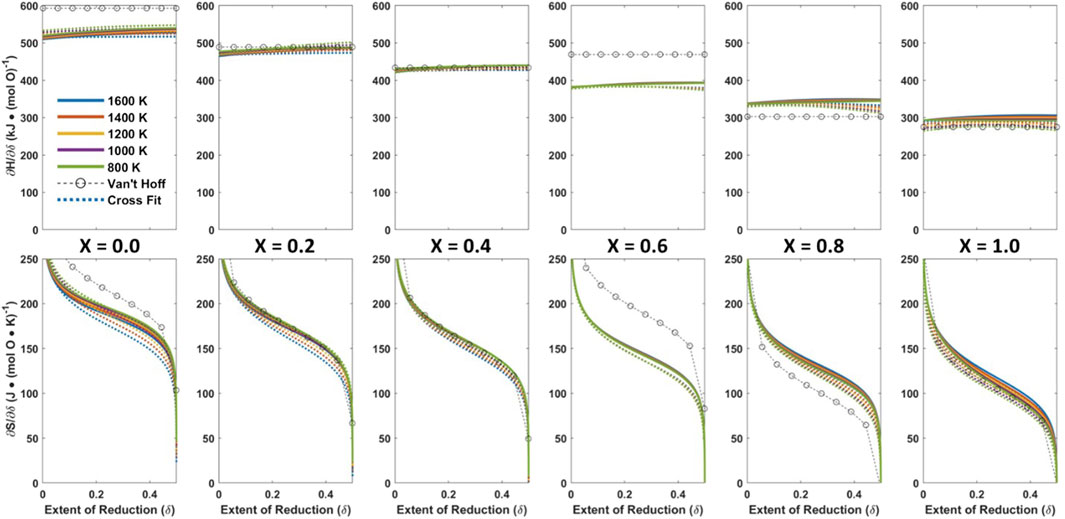
Figure 3. Generated water (or CO2) splitting material, Model 1, ground truth thermodynamic trend (solid), and model fits to the ground truth data with standard deviation noise of 1 × 10⁻³ added to δ to simulate experimental error, CF-CEF (dashed), VH (circles).
We individually extracted the
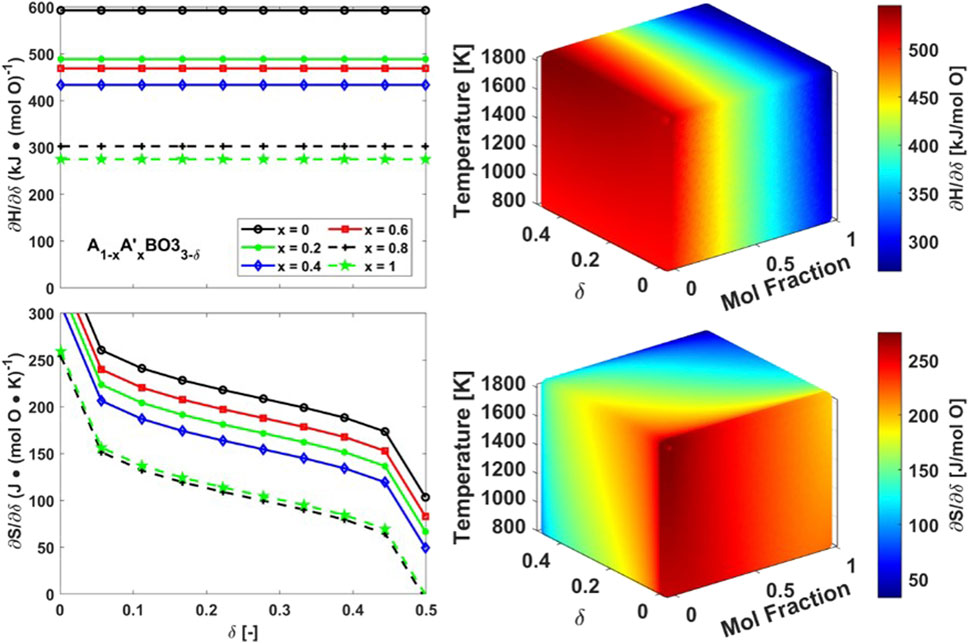
Figure 4. (Left) Enthalpy (top) and Entropy (bottom) of reduction thermodynamics prediction by VH analysis for Model 1. (Right) Enthalpy (top) and Entropy (bottom) of reduction thermodynamics prediction by CF-CEF method for Model 1.
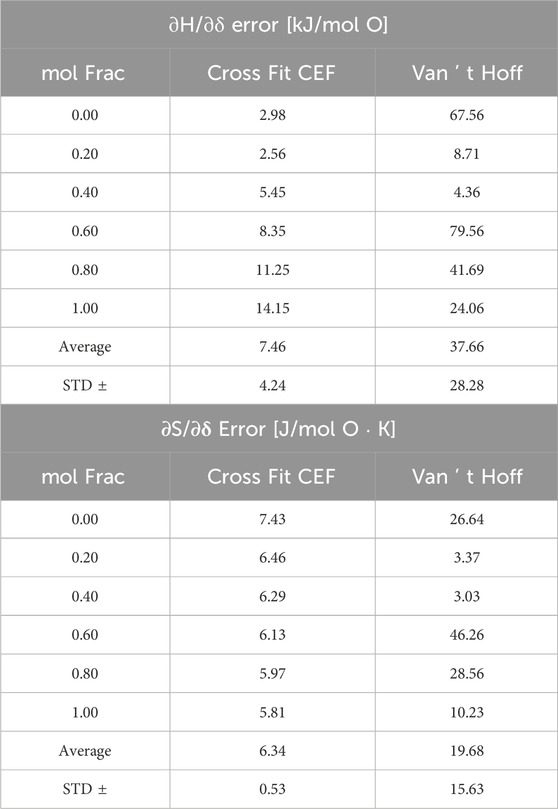
The CF-CEF method predicts the thermodynamics of Model 1 much more accurately than the VH method with an error of only 7 ± 4 kJ/mol O and 6 ± 0.5 J/mol O K for
Using the CF-CEF method, we can make a direct comparison between the optimized and ground truth constructed model parameters. The excess terms found in CF-CEF method are L8, L22, and L68. The linear combination of the CF-CEF excess terms is different by one term, predicting L22 instead of the ground truth term L74. However, the linear combination of the ground truth excess terms as compared to the optimized CF-CEF excess terms has a max difference of ∼20 kJ/mol at T = 1200K. We find that the temperature dependence difference in excess terms
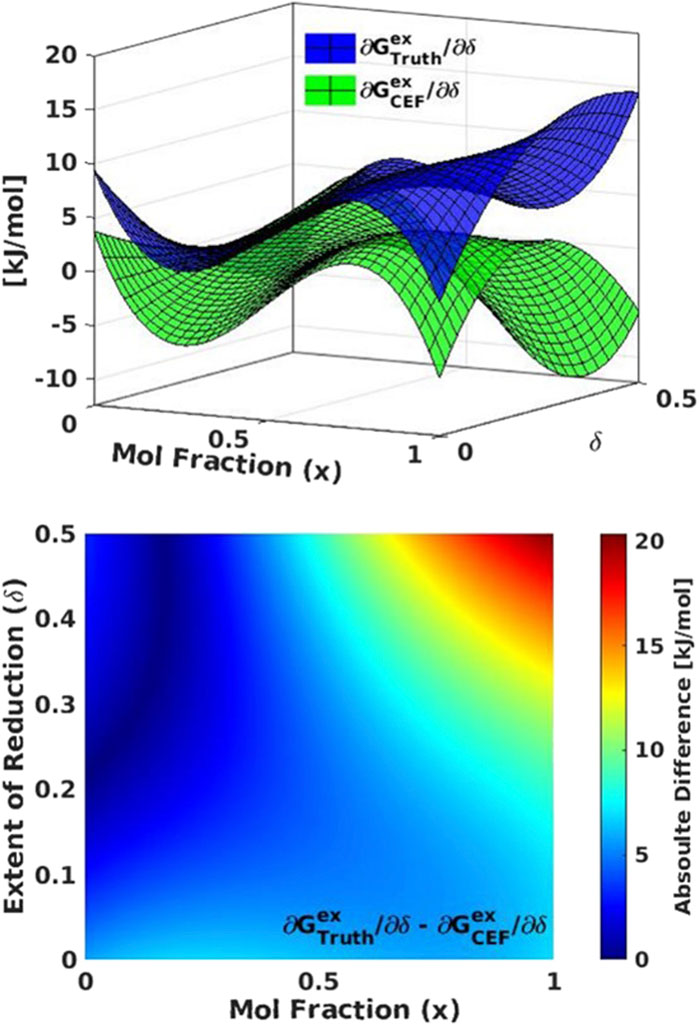
Figure 5. Model 1 comparison of (top) excess free energy (Gex) for the ground truth (blue) compared to the CF-CEF derived excess free energy (green). (bottom) The absolute difference between Gex for the ground truth and CF-CEF models.
Effectiveness of the methods on model two data
To ensure that the better performance of the CEF over the VH method was not coincidental, we generated and analyzed additional data sets. Model 2 compares the CF-CEF and VH model performance of a hypothetical TCES material varying in composition on the B sublattice only (
Figure 6 shows the ground truth thermodynamic trends as solid lines across the mole fractions x = 0, 0.2, 0.4, 0.6, 0.8, 1.0. The randomly selected excess L terms are L35, L43, and L51. We generated TpOX data from six evenly spaced points in each: T = [400, 560, 720, 880, 1,040, 1,200] K; x = [0, 0.2, 0.4, 0.6, 0.8, 1.0]; and pO2 = [1 × 10⁻², 1.84 × 10⁻², 3.38 × 10⁻², 6.21 × 10⁻², 0.11, 0.21] Bar, again evenly distributed in log space. Following the same process as Model 1, we generated 266 data points (133 unique TpOX points with replicated random noise) with 0.005 < δ < 0.495.
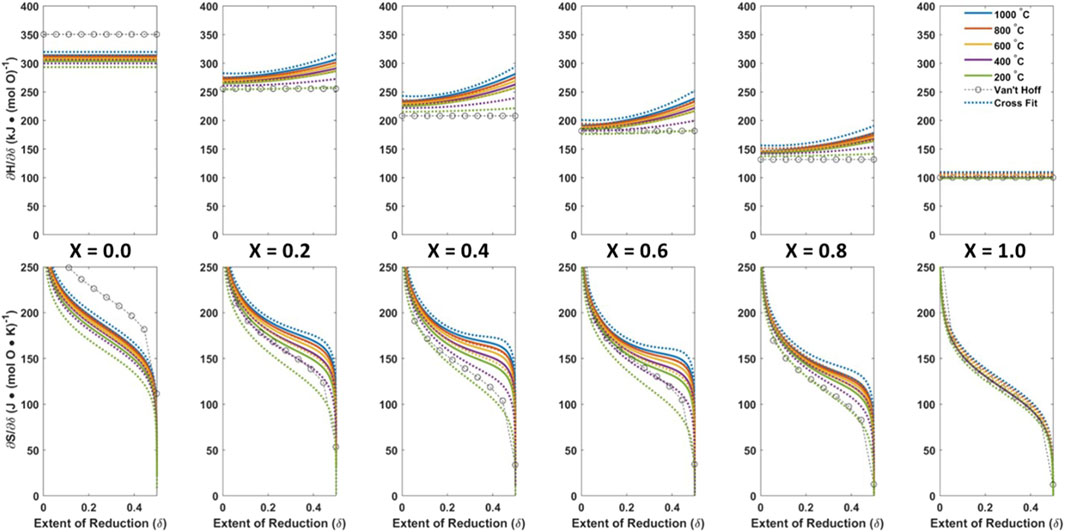
Figure 6. Generated TCES splitting material, Model 2, ground truth thermodynamic trend (solid), and model fits to the ground truth data with standard deviation noise of 1 × 10⁻³ added to δ to simulate experimental error, CF-CEF (dashed), VH (circles).
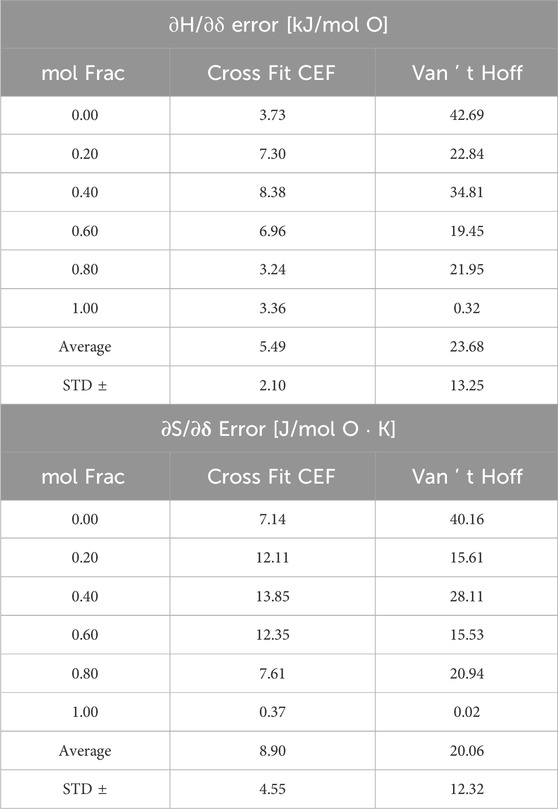
Table 3 shows the errors in the VH and CF-CEF methods. VH extracted thermodynamics display average errors of 24 ± 13 kJ/mol O and 20 ± 12 J/mol O K
Even with a material designed for easy thermodynamic extraction by VH analysis, the CF-CEF method outperforms it in predicting
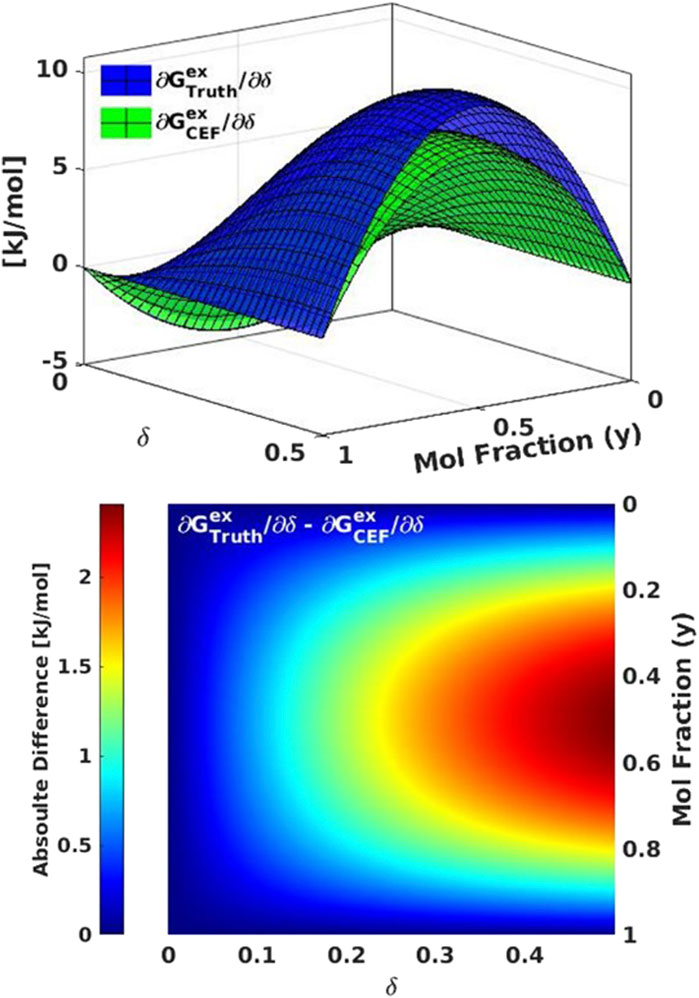
Figure 7. Model 2 comparisons of (top) excess free energy (Gex) for the ground truth (blue) to the CF-CEF derived excess free energy (green). (bottom) The absolute difference between Gex for the ground truth and CF-CEF models.
Effectiveness of the methods on model 3 data
Model 3 compares the CF-CEF and VH model performance of a complex hypothetical quinary material that varies in composition on the A and B sublattices (
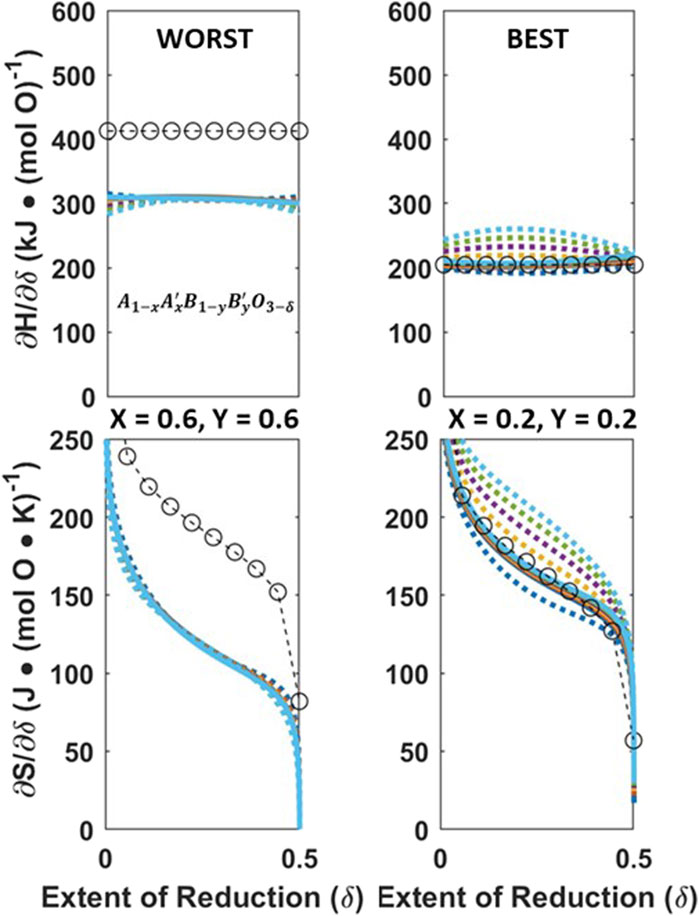
Figure 8. Worst (left) and best (right) VH fit (circles) to Model 3,
The error for VH across all 36 compositions can be found in the SI, Tabel SI-1, and achieved an average accuracy of 40 ± 28 kJ/mol O and 29 ± 22 J/mol O K
The CF-CEF method achieved an average error of 17 ± 10 kJ/mol O and 9 ± 5 J/mol O K
Noise sensitivity
We next examine the sensitivity of both the CF-CEF and VH models to noise in the data by doubling the normally distributed random valuations used in creating the data. Here, we use only the base case Model 1 for the invertible data set. We regenerated data at the same TpOX points as done with Model 1 but with a normal distribution of noise double that used for Model 1. The error in the CF-CEF method is effectively unchanged by additional noise in the data with a difference of <1 kJ/mol O and J/mol O K,
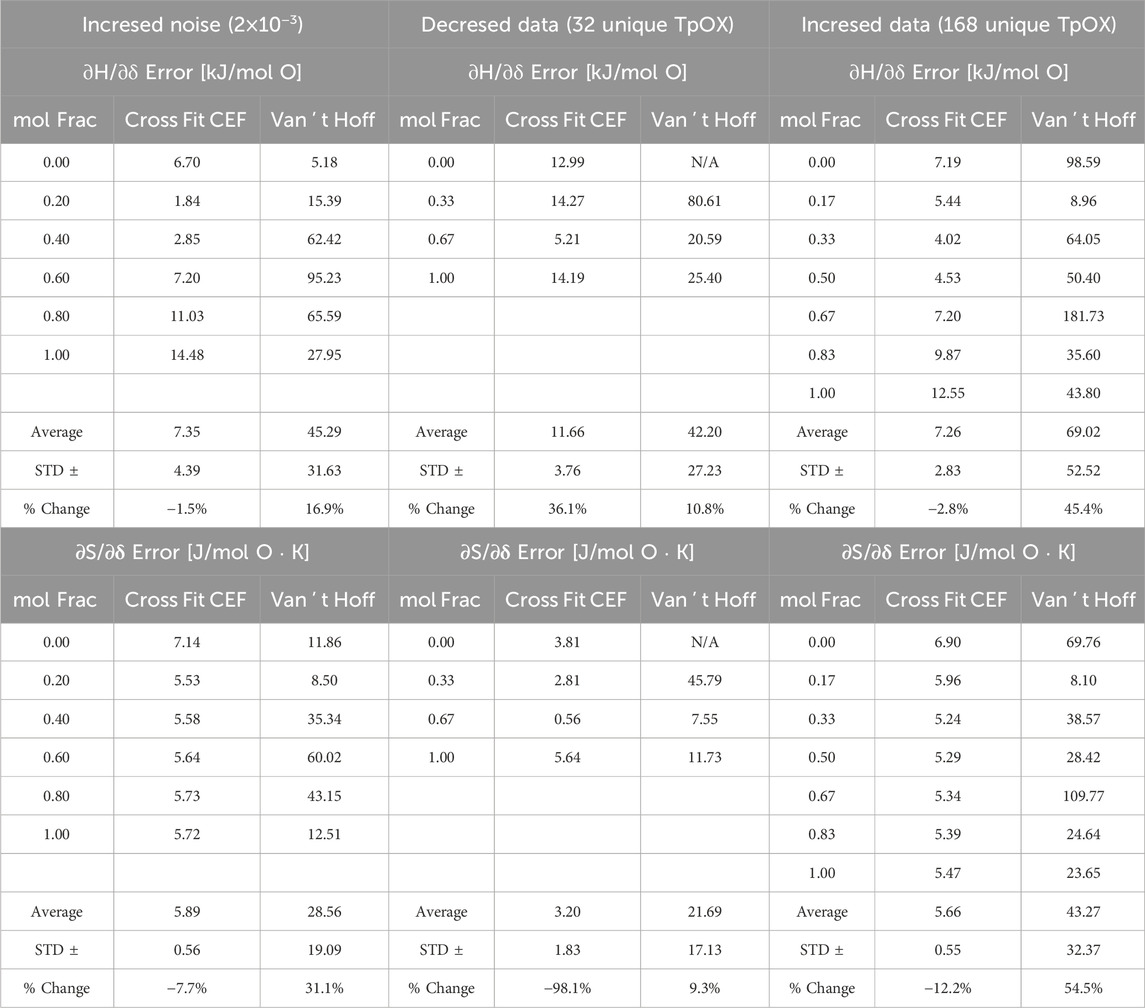
Table 4. Model 1 error in CF-CEF and VH analysis. (left) Nosie in data doubled, (middle) decrease in data available, (right) increase in data available. Percent change is relative to the average errors reported in Table 2.
Data amount sensitivity
The sensitivity of CEF and VH methods to the number of available data points is examined by altering the number of evenly spaced TpOX points on a mesh grid from six to either four or seven: T = [800, 1,133, 1,467, 1800] K, x = [0, 0.33, 0.67, 1.0], and pO2 = [1 × 10⁻¹⁰, 1.28 × 10⁻⁷, 1.64 × 10⁻⁴, 0.21] or T = [800, 967, 1,133, 1,300 1,467, 1,633, 1800] K, x = [0, 0.17, 0.33, 0.50, 0.67, 0.83, 1.0], and pO2 = [1 × 10⁻¹⁰, 3.58 × 10⁻⁹, 1.28 × 10⁻⁷, 4.58 × 10⁻⁶, 1.64 × 10⁻⁴, 5.90 × 10⁻³, 0.21] respectively. After applying the off-stoichiometry restrictions of 0.005 < δ < 0.495, the mesh grid of four TpOX resulted in 32 unique points and the mesh grid of seven points resulted in 168 unique points, ∼30% or ∼168% percent de/increase, respectively, in TpOX points from the original dataset. Again, we duplicated the data with the noise standard devotion equal to 1 × 10⁻³ as previously discussed for Model 1. Table 4 lists the new error values at every mol fraction for the changes in mesh grids of the data generated.
As expected, with less data available the error in
Again, as expected, in the case with more data available, the error in
Statistical analysis of VH and CF-CEF methods on model 1
In this section we perform a statistical analysis of the VH and CF-CEF methods again utilizing Model 1 as the base case. First, we will discuss the linear models associated with VH analysis and their effects on the prediction of thermodynamic properties and replication of data. This will be followed by an analysis on the robust nature of the CF-CEF by analyzing 20 additional ground truth models. The additional ground truth models are constructed in the same fashion as was done with the Model 1 case albeit a different random selection of controlling excess terms therefore creating 20 unique models with different thermodynamic trends and properties.
Table 5 shows the statistical values of intercept variance, slope variance, slope/intercept covariance, correlation, and number of points for each fit
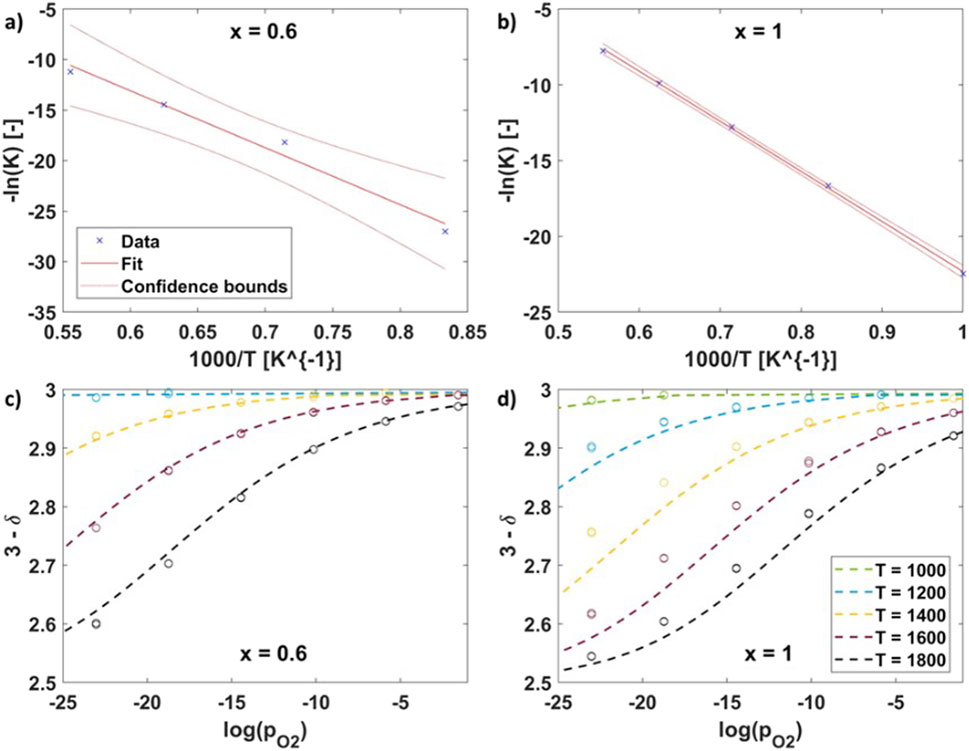
Figure 9. (A, B) linear regression of defect model to find KT for x = 0.6 and x = 1.0 respectively) and (C, D) defect models (dashed lines) based on extracted KT for x = 0.6 and x = 1.0 respectively.
The CF-CEF method was evaluated on 20 additional variations of Model 1. The enthalpy and entropy of reduction error is evaluated across an extremely fine mesh of 125,000 TpOX points derived from the same T, P, and X bounds of Model 1. The cumulative distribution function (CDF) of each model is plotted in Figure 10. The CDF is a fundamental concept in probability and statistics that applies to any type of distribution, whether unimodal, bimodal, or multimodal. The CDF indicates probabilities F(X) of finding value X at or below F(X). We apply the CDF to the mean absolute error (MAE) of enthalpy and entropy of reduction as well as the precited δ value at all 125,000 TpOX points. We show that the MAE across 125,000 data points for each of the 20 CF-CEF has an error ranging 3.35–10.95 kJ/mol O and 2.52–8.97 J/mol O K of enthalpy and entropy of reduction respectively. Furthermore, 90% of the MAE is ≤20 kJ/mol O for reduction enthalpy and ≤17 J/mol O K for reduction entropy. The long tails of the CDF exist due to some outlier points of the model predicting incorrect values at the large delta extremes of the ground truth model (i.e., δ > 0.48). The outliers represent <1% of the total 125,000 data points. Similarly, the CDF of the CF-CEF error in predicting δ for each of these models is very low where over 99.99% of the predicted δ values is <1 × 10⁻², as shown in Figure 10C inlay. Note these errors are near the imposed noise level of 1 × 10⁻³ indicating that the CF-CEF method has a superior ability in predicting reduction thermodynamics and delta values accurately.
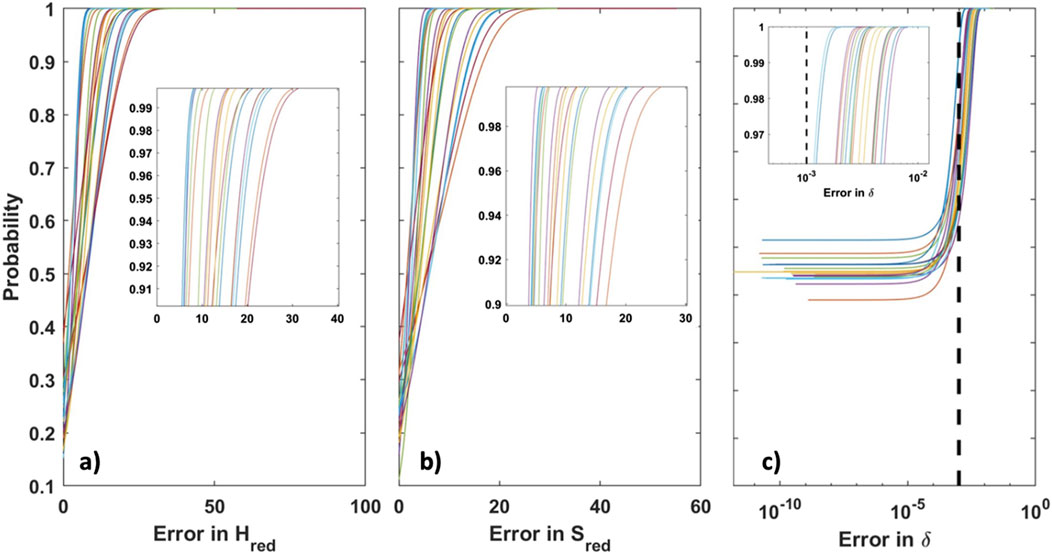
Figure 10. (A) CDF of MAE of enthalpy of reduction (Hred) for 20 models. (B) CDF of MAE of entropy of reduction (Sred) for 20 models. (C) CDF of MAE of predicted δ for 20 models plotted on a log scale. Blacked dash line represents the imposed noise in δ. Inlays are included for each plot for ease of visualization of probability values 0.9–1.0.
Conclusion
Overall, this work demonstrates that the linearized VH approach is insufficient for reliably extracting thermodynamic information from TGA data. In contrast, the CF-CEF method proves to be highly accurate, offering a comprehensive thermodynamic picture (i.e.,
Associated content
Contains Cp model comparisons. A list of Redlich-Kister expansion of
Data availability statement
The datasets presented in this study can be found in online repositories in online repositories found on GitHub on the MuhichLab repositories. The names of the repository/repositories and accession number(s) can be found in the article/Supplementary Material.
Author contributions
SW: Conceptualization, Data curation, Formal Analysis, Investigation, Writing–original draft. PS: Formal Analysis, Writing–original draft. ES: Writing–review and editing. CM: Writing–review and editing, Supervision.
Funding
The author(s) declare that financial support was received for the research, authorship, and/or publication of this article. This material is based upon work supported by the U.S. Department of Energy, Office of Science, Office of Advanced Scientific Computing Research, Department of Energy Computational Science Graduate Fellowship under Award Number DE-SC0022158. This work is also supported by the U.S. Department of Energy’s Energy Efficiency & Renewable Energy office under Award Number DE-EEDE-EE0010732. This material is partially based upon work supported by the U.S. Department of Energy, Office of Energy Efficiency and Renewable Energy, specifically the Hydrogen and Fuel Cell Technologies Office through the HydroGEN Advanced Water Splitting Materials Consortium as well grant DE-EE0010733.
Acknowledgments
All fitting calculations were conducted in MATLAB© 2021a. The authors gratefully acknowledge Research Computing at Arizona State University (Jennewein et al., 2023) for providing HPC resources that have contributed to the research results reported within this paper.
Conflict of interest
The authors declare that the research was conducted in the absence of any commercial or financial relationships that could be construed as a potential conflict of interest.
The author(s) declared that they were an editorial board member of Frontiers, at the time of submission. This had no impact on the peer review process and the final decision.
Publisher’s note
All claims expressed in this article are solely those of the authors and do not necessarily represent those of their affiliated organizations, or those of the publisher, the editors and the reviewers. Any product that may be evaluated in this article, or claim that may be made by its manufacturer, is not guaranteed or endorsed by the publisher.
Supplementary material
The Supplementary Material for this article can be found online at: https://www.frontiersin.org/articles/10.3389/fenrg.2024.1470010/full#supplementary-material
Refernces
Abraham, A., Schoenitz, M., and Dreizin, E. L. (2016). Energy storage materials with oxide-encapsulated inclusions of low melting metal. Acta Mater. 107, 254–260. doi:10.1016/j.actamat.2016.01.074
Ahmad, Y. H., Mohamed, A. T., Kumar, A., and Al-Qaradawi, S. Y. (2021). Solution combustion synthesis of Ni/La2O3 for dry reforming of methane: tuning the basicity via alkali and alkaline earth metal oxide promoters. RSC Adv. 11, 33734–33743. doi:10.1039/D1RA05511A
Arifin, D., Ambrosini, A., Wilson, S. A., Mandal, B., Muhich, C. L., and Weimer, A. W. (2020). Investigation of Zr, Gd/Zr, and Pr/Zr – doped ceria for the redox splitting of water. Int. J. Hydrogen Energy 45, 160–174. doi:10.1016/j.ijhydene.2019.10.177
Babiniec, S. M., Coker, E. N., Miller, J. E., and Ambrosini, A. (2015). Investigation of La Sr1−Co M1−O3− (M = Mn, Fe) perovskite materials as thermochemical energy storage media. Sol. Energy 118, 451–459. doi:10.1016/j.solener.2015.05.040
Barry, T. I., Dinsdale, A. T., Gisby, J. A., Hallstedt, B., Hillert, M., Jansson, B., et al. (1992). The compound energy model for ionic solutions with applications to solid oxides. J. Phase Equilibria 13, 459–475. doi:10.1007/BF02665760
Bayon, A., Hashimoto, J., and Muhich, C. (2021a). Advances in chemical engineering. Editor W. Lipiński (Academic Press), 58, 55–90.
Bayon, A., Hashimoto, J., and Muhich, C. (2021b). “Fundamentals of solar thermochemical gas splitting materials,” in Advances in chemical engineering, 58. Elsevier, 55–90. doi:10.1016/bs.ache.2021.10.006
Bergeson-Keller, A. M., Sanders, M. D., and O’Hayre, R. P. (2022). Reduction thermodynamics of SrxCexMnO3 and CexSrxMnO4 perovskites for solar thermochemical hydrogen production. Energy Technol. 10, 2100515. doi:10.1002/ente.202100515
Bork, A. H., Povoden-Karadeniz, E., Carrillo, A. J., and Rupp, J. L. M. (2019). Thermodynamic assessment of the solar-to-fuel performance of La0.6Sr0.4Mn1-yCryO3-δ perovskite solid solution series. Acta Mater. 178, 163–172. doi:10.1016/j.actamat.2019.07.022
Brendelberger, S., Vieten, J., Roeb, M., and Sattler, C. (2019). Thermochemical oxygen pumping for improved hydrogen production in solar redox cycles. Int. J. Hydrogen Energy 44, 9802–9810. doi:10.1016/j.ijhydene.2018.12.135
Bulfin, B., Lapp, J., Richter, S., Gubàn, D., Vieten, J., Brendelberger, S., et al. (2019). Air separation and selective oxygen pumping via temperature and pressure swing oxygen adsorption using a redox cycle of SrFeO3 perovskite. Chem. Eng. Sci. 203, 68–75. doi:10.1016/j.ces.2019.03.057
Bulfin, B., Vieten, J., Starr, D. E., Azarpira, A., Zachäus, C., Hävecker, M., et al. (2017). Redox chemistry of CaMnO 3 and Ca 0.8 Sr 0.2 MnO 3 oxygen storage perovskites. J. Mater. Chem. A 5, 7912–7919. doi:10.1039/c7ta00822h
Bush, H. E., Nguyen, N. P., Farr, T., Loutzenhiser, P. G., and Ambrosini, A. (2021). Air separation via a two-step solar thermochemical cycle based on (Ba,La)xSr1-xFeO3-δ: thermodynamic analysis. Solid State Ionics 368, 115692. doi:10.1016/j.ssi.2021.115692
Cacciamani, G. (2016) An introduction to the calphad method and the compound energy formalism (CEF). Tecnologia em Metalurgia, Materiais e Mineração 13 (1), 16–24.
Cai, R., Dou, J., Krzystowczyk, E., Richard, A., and Li, F. (2022). Chemical looping air separation with Sr0.8Ca0.2Fe0.9Co0.1O3-δ perovskite sorbent: packed bed modeling, verification, and optimization. Chem. Eng. J. 429, 132370. doi:10.1016/j.cej.2021.132370
Chaires, J. B. (1997). Possible origin of differences between van't Hoff and calorimetric enthalpy estimates. Biophys. Chem. 64, 15–23. doi:10.1016/S0301-4622(96)02205-3
Chen, X., Kubota, M., Yamashita, S., and Kita, H. (2021). Investigation of Sr-based perovskites for redox-type thermochemical energy storage media at medium-high temperature. J. Energy Storage 38, 102501. doi:10.1016/j.est.2021.102501
De Souza, R. A. (2015). Oxygen diffusion in SrTiO3 and related perovskite oxides. Adv. Funct. Mater. 25, 6326–6342. doi:10.1002/adfm.201500827
Fuks, D., Mastrikov, Y., Kotomin, E., and Maier, J. (2013). Ab initio thermodynamic study of (Ba, Sr)(Co, Fe) O 3 perovskite solid solutions for fuel cell applications. J. Mater. Chem. A 1, 14320–14328. doi:10.1039/c3ta12874a
Gu, X.-K., Samira, S., and Nikolla, E. (2018). Oxygen sponges for electrocatalysis: oxygen reduction/evolution on nonstoichiometric, mixed metal oxides. Chem. Mater. 30, 2860–2872. doi:10.1021/acs.chemmater.8b00694
Guo, Q., Geng, J., Pan, J., Zou, L., Tian, Y., Chi, B., et al. (2023). Brief review of hydrocarbon-reforming catalysts map for hydrogen production. Energy Rev. 2, 100037. doi:10.1016/j.enrev.2023.100037
Hashimoto, J., Bayon, A., Tamburro, O., and Muhich, C. L. (2023). Thermodynamic and structural effects of Fe doping in magnesium manganese oxides for thermochemical energy storage. Energy and Fuels 37, 4692–4700. doi:10.1021/acs.energyfuels.2c04266
Hillert, M. (1996). Some properties of the compound energy model. Calphad 20, 333–341. doi:10.1016/S0364-5916(96)00035-1
Hillert, M. (2001). The compound energy formalism. J. Alloys Compd. 320, 161–176. doi:10.1016/S0925-8388(00)01481-X
Hillert, M., and Staffansson, L. (1970). The regular solution model for stoichiometric phases and ionic melts. Acta Chem. Scand. 24, 3618–3626. doi:10.3891/acta.chem.scand.24-3618
Hoes, M., Muhich, C. L., Jacot, R., Patzke, G. R., and Steinfeld, A. (2017). Thermodynamics of paired charge-compensating doped ceria with superior redox performance for solar thermochemical splitting of H2O and CO2. J. Mater. Chem. A 5, 19476–19484. doi:10.1039/C7TA05824A
Jennewein, D. M., Lee, J., Kurtz, C., Dizon, W., Shaeffer, I., Chapman, A., et al. (2023). in The Sol Supercomputer at Arizona State University (NY, USA: Association for Computing Machinery).
Ji, Y., Abernathy, H. W., and Chen, L.-Q. (2022). Thermodynamic models of multicomponent nonstoichiometric solution phases using internal process order parameters. Acta Mater. 223, 117462. doi:10.1016/j.actamat.2021.117462
Jin, F., Xu, C., Yu, H., Xia, X., Ye, F., Li, X., et al. (2021). CaCo0.05Mn0.95O3−δ: a promising perovskite solid solution for solar thermochemical energy storage. ACS Appl. Mater. and Interfaces 13, 3856–3866. doi:10.1021/acsami.0c18207
Kolodiazhnyi, T., Sakurai, H., Belik, A., and Gornostaeva, O. (2016). Unusual lattice evolution and magnetochemistry of Nb doped CeO2. Acta Mater. 113, 116–123. doi:10.1016/j.actamat.2016.04.052
Kröger, F. A., and Vink, H. J. (1956). “Frederick seitz and david turnbull,” in Solid state physics, 3. Academic Press, 307–435.
Krug, R. R., Hunter, W. G., and Grieger, R. A. (1976). Enthalpy-entropy compensation. 1. Some fundamental statistical problems associated with the analysis of van't Hoff and Arrhenius data. J. Phys. Chem. 80, 2335–2341. doi:10.1021/j100562a006
Krzystowczyk, E., Haribal, V., Dou, J., and Li, F. (2021). Chemical looping air separation using a perovskite-based oxygen sorbent: system design and process analysis. ACS Sustain. Chem. and Eng. 9, 12185–12195. doi:10.1021/acssuschemeng.1c03612
LeValley, T. L., Richard, A. R., and Fan, M. (2014). The progress in water gas shift and steam reforming hydrogen production technologies – a review. Int. J. Hydrogen Energy 39, 16983–17000. doi:10.1016/j.ijhydene.2014.08.041
Liu, D., Dou, Y., Xia, T., Li, Q., Sun, L., Huo, L., et al. (2021). B-site La, Ce, and Pr-doped Ba0.5Sr0.5Co0.7Fe0.3O3-δ perovskite cathodes for intermediate-temperature solid oxide fuel cells: effectively promoted oxygen reduction activity and operating stability. J. Power Sources 494, 229778. doi:10.1016/j.jpowsour.2021.229778
Liu, Y., and Sturtevant, J. M. (1997). Significant discrepancies between van't Hoff and calorimetric enthalpies. III. Biophys. Chem. 64, 121–126. doi:10.1016/S0301-4622(96)02229-6
Mane, R., Kim, H., Han, K., Kim, H., Lee, S. S., Roh, H. S., et al. (2023). Important factors of the A-site deficient Mn perovskites design affecting the CO oxidation activity. Catal. Today 114347, 114347. doi:10.1016/j.cattod.2023.114347
Mastronardo, E., Qian, X., Coronado, J. M., and Haile, S. M. (2020). The favourable thermodynamic properties of Fe-doped CaMnO3 for thermochemical heat storage. J. Mater. Chem. A 8, 8503–8517. doi:10.1039/D0TA02031A
Moore, E., Guéneau, C., and Crocombette, J.-P. (2013). Diffusion model of the non-stoichiometric uranium dioxide. J. Solid State Chem. 203, 145–153. doi:10.1016/j.jssc.2013.04.006
Muhich, C., Hoes, M., and Steinfeld, A. (2018). Mimicking tetravalent dopant behavior using paired charge compensating dopants to improve the redox performance of ceria for thermochemically splitting H2O and CO2. Acta Mater. 144, 728–737. doi:10.1016/j.actamat.2017.11.022
Panlener, R. J., Blumenthal, R. N., and Garnier, J. E. (1975). A THERMODYNAMIC STUDY OF NONSTOICHIOMETRIC CERIUM DIOXIDE. J. Phys. Chem. Solids 36, 1213–1222. doi:10.1016/0022-3697(75)90192-4
Park, J., Xu, B., Pan, J., Zhang, D., Lany, S., Liu, X., et al. (2023). Accurate prediction of oxygen vacancy concentration with disordered A-site cations in high-entropy perovskite oxides. npj Comput. Mater. 9, 29. doi:10.1038/s41524-023-00981-1
Qian, X., He, J., Mastronardo, E., Baldassarri, B., Yuan, W., Wolverton, C., et al. (2021). Outstanding properties and performance of CaTi0.5Mn0.5O3–δ for solar-driven thermochemical hydrogen production. Matter 4, 688–708. doi:10.1016/j.matt.2020.11.016
Redlich, O., and Kister, A. T. (1948). Algebraic representation of thermodynamic properties and the classification of solutions. Industrial and Eng. Chem. 40, 345–348. doi:10.1021/ie50458a036
Rogers, D. (2005). Einstein's other theory: the Planck-Bose-Einstein theory of heat capacity. Princeton University Press.
Rousseau, R., Glezakou, V.-A., and Selloni, A. (2020). Theoretical insights into the surface physics and chemistry of redox-active oxides. Nat. Rev. Mater. 5, 460–475. doi:10.1038/s41578-020-0198-9
Sai Gautam, G., Stechel, E. B., and Carter, E. A. (2020a). Exploring Ca–Ce–M–O (M = 3d transition metal) oxide perovskites for solar thermochemical applications. Chem. Mater. 32, 9964–9982. doi:10.1021/acs.chemmater.0c02912
Sai Gautam, G., Stechel, E. B., and Carter, E. A. (2020b). A first-principles-based sub-lattice formalism for predicting off-stoichiometry in materials for solar thermochemical applications: the example of ceria. Adv. Theory Simulations 3, 2000112. doi:10.1002/adts.202000112
Singh, A. K., AuYeung, N. J., Randhir, K., Mishra, R., Allen, K. M., Petrasch, J., et al. (2015). Thermal reduction of iron oxide under reduced pressure and implications on thermal conversion efficiency for solar thermochemical fuel production. Industrial and Eng. Chem. Res. 54, 6793–6803. doi:10.1021/ie504402x
Sundman, B., Guéneau, C., and Dupin, N. (2011). Modeling multiple defects in ionic phases like UO2± using the compound energy formalism. Acta Mater. 59, 6039–6047. doi:10.1016/j.actamat.2011.06.012
Tahir, F., Saeed, M. A., and Ali, U. (2023). Biomass energy perspective in Pakistan based on chemical looping gasification for hydrogen production and power generation. Int. J. Hydrogen Energy 48, 18211–18232. doi:10.1016/j.ijhydene.2023.01.247
Takacs, M., Hoes, M., Caduff, M., Cooper, T., Scheffe, J., and Steinfeld, A. (2016). Oxygen nonstoichiometry, defect equilibria, and thermodynamic characterization of LaMnO3 perovskites with Ca/Sr A-site and Al B-site doping. Acta Mater. 103, 700–710. doi:10.1016/j.actamat.2015.10.026
Teh, L. P., Setiabudi, H., Timmiati, S., Aziz, M., Annuar, N., and Ruslan, N. (2021). Recent progress in ceria-based catalysts for the dry reforming of methane: a review. Chem. Eng. Sci. 242, 116606. doi:10.1016/j.ces.2021.116606
Tran, J. T., Warren, K. J., Wilson, S. A., Muhich, C. L., Musgrave, C. B., and Weimer, A. W. (2024). An updated review and perspective on efficient hydrogen generation via solar thermal water splitting. WIREs Energy Environ. 13, e528. doi:10.1002/wene.528
van de Krol, R., Liang, Y., and Schoonman, J. (2008). Solar hydrogen production with nanostructured metal oxides. J. Mater. Chem. 18, 2311–2320. doi:10.1039/B718969A
Vieten, J., Bulfin, B., Call, F., Lange, M., Schmücker, M., Francke, A., et al. (2016). Perovskite oxides for application in thermochemical air separation and oxygen storage. J. Mater. Chem. A 4, 13652–13659. doi:10.1039/c6ta04867f
Wexler, R. B., Sai Gautam, G., Bell, R. T., Shulda, S., Strange, N. A., Trindell, J. A., et al. (2023). Multiple and nonlocal cation redox in Ca–Ce–Ti–Mn oxide perovskites for solar thermochemical applications. Energy and Environ. Sci. 16, 2550–2560. doi:10.1039/D3EE00234A
Wilson, S. A., and Muhich, C. L. (2024). A Bayesian method for selecting data points for thermodynamic modeling of off-stoichiometric metal oxides. J. Mater. Chem. A, 13328–13337. doi:10.1039/D3TA06627D
Wilson, S. A., Stechel, E. B., and Muhich, C. L. (2023). Overcoming significant challenges in extracting off-stoichiometric thermodynamics using the compound energy formalism through complementary use of experimental and first principles data: a case study of Ba1-xSrxFeO3-δ. Solid State Ionics 390, 116115. doi:10.1016/j.ssi.2022.116115
Xu, M., Ermanoski, I., Stechel, E. B., and Deng, S. (2020). Oxygen pumping characteristics of YBaCo4O7+δ for solar thermochemical cycles. Chem. Eng. J. 389, 124026. doi:10.1016/j.cej.2020.124026
Yoo, J., Yoo, C.-Y., Yu, J.-H., and Jacobson, A. J. (2017). Determination of oxygen nonstoichiometry in SrFeO3−δ by solid-state Coulometric titration. J. Am. Ceram. Soc. 100, 2690–2699. doi:10.1111/jace.14755
Young, S. D., Chen, J., Sun, W., Goldsmith, B. R., and Pilania, G. (2023). Thermodynamic stability and anion ordering of perovskite oxynitrides. Chem. Mater. 35, 5975–5987. doi:10.1021/acs.chemmater.3c00943
Zhang, D., De Santiago, H. A., Xu, B., Liu, C., Trindell, J. A., Li, W., et al. (2023). Compositionally complex perovskite oxides for solar thermochemical water splitting. Chem. Mater. 35, 1901–1915. doi:10.1021/acs.chemmater.2c03054
Zhu, J.-Y., Park, T., Isola, P., and Efros, A. A. (2002). in Proceedings of the IEEE international conference on computer vision, 2223–2232.
Keywords: chemical looping, reduction thermodynamics, solar thermochemical, density funcational theory, van ’t Hoff, compound energy formalism, thermodynamic modeling
Citation: Wilson SA, Sarsam PW, Stechel EB and Muhich CL (2024) Extracting metal oxide redox thermodynamics from TGA measurements requires moving beyond the linearized van ‘t Hoff approach. Front. Energy Res. 12:1470010. doi: 10.3389/fenrg.2024.1470010
Received: 24 July 2024; Accepted: 19 September 2024;
Published: 22 October 2024.
Edited by:
Rahul R. Bhosale, University of Tennessee at Chattanooga, United StatesReviewed by:
Brendan Bulfin, University College Cork, IrelandVinod Singh Amar, South Dakota School of Mines and Technology, United States
Copyright © 2024 Wilson, Sarsam, Stechel and Muhich. This is an open-access article distributed under the terms of the Creative Commons Attribution License (CC BY). The use, distribution or reproduction in other forums is permitted, provided the original author(s) and the copyright owner(s) are credited and that the original publication in this journal is cited, in accordance with accepted academic practice. No use, distribution or reproduction is permitted which does not comply with these terms.
*Correspondence: Christopher L. Muhich, Y2hyaXN0b3BoZXIubXVoaWNoQGFzdS5lZHU=
 Steven A. Wilson
 Paul W. Sarsam
 Ellen B. Stechel
 Christopher L. Muhich