- 1State Grid Inner Mongolia East Electric Power Company Economic and Technological Research Institute, Hohhot, China
- 2College of Economic and Management, North China Electric PowerUniversity, Beijing, China
Compared to traditional resources, user-side resources are of various types and have more significant uncertainty about their regulatory capacity, leading to difficulties in coordinating decisions about their simultaneous participation in the electric energy and peaking ancillary services markets. This paper proposes a joint bidding decision-making method for the day-ahead electricity energy and peak shaving auxiliary service market based on distributed robust opportunity constraints, which addresses the problem of difficulty in using an accurate probability density distribution to represent the uncertainty process of user-side resources. Firstly, a data-driven method for characterizing the uncertainty of load regulation capacity is investigated, and fuzzy sets are constructed without assuming specific probability distributions of random variables. Then, to minimize the risk expectation of the joint bidding cost on the customer side, a bidding strategy that considers the uncertainty is proposed. Finally, an example simulation verifies the reasonableness and effectiveness of the proposed joint bidding method, and the results show that the constructed model overcomes the problem of over-conservatism of the robust model, and the computational adaptability is better than that of the stochastic model, which achieves a better balance between robustness and economy.
1 Introduction
Proposals for “carbon peak and carbon neutrality” have promoted the use of new energy sources, such as wind power, as the main power source in new power systems of the future (Xie et al., 2023). However, the integration of large-scale new energy sources into the grid has resulted in serious challenges to the flexible peaking of the power grid (Hasan et al., 2023). In addition, the proportion of traditional regulation resources, such as thermal power, in the grid is decreasing gradually such that it has become difficult to meet system demands by relying only on traditional regulation resources (Li et al., 2023a). Given the continuous improvements in user-side automation, user-side distributed energy storage and other adjustable resources have gradually become a new type of flexible resource to alleviate the pressure of power system peaking (Zhang et al., 2022). User-side adjustable resources not only respond to the demands of grid peak shaving and valley filling but also provide diversified services such as electrical energy, peak shifting, and improvement of new energy consumption through their flexible and adjustable characteristics (Lin et al., 2023).
At present, experts and scholars have conducted numerous studies on the participation of customer-side adjustable resources in electricity market transactions. Khodadadi et al. (2022) proposed bidding and auctioning strategies for flexible load aggregators to participate in the day-ahead and real-time markets, in addition to using stochastic scenarios and robust optimization methods to study the uncertainties in electricity prices and new energy sources, respectively. Bai et al. (2023) noted that customer-side adjustable resources not only participate in the electrical energy market to promote new energy consumption but also provide peaking auxiliary services as flexible interactive resources.
At present, some regions in China, such as North China, Shanghai, and Central China, have issued trading rules for the participation of user-side resources in the peaking market, thus encouraging the participation of user-side resources in flexible peaking through a market-based approach (Cao and Zhang, 2023). Datta and Das (2023) proposed an optimal peak shifting bidding strategy for charging operators by considering the adjustable characteristics of different types of charging stations, with the optimization objectives of minimizing the net operating costs as well as allocation errors. Zhang and Liu (2023) designed a trading strategy for a virtual power plant (VPP) to participate in the peaking market based on the regional trading mechanism in North China. VPP is a special kind of load integrator that can aggregate distributed energy sources, especially energy storage and distributed power sources, to participate in market trading (Alahyari et al., 2019).
Among the power spot pilot units, Gansu, Northeast, Shanxi, and other regions in China are exploring methods to jointly optimize the operations of the peaking auxiliary service and power spot markets (Guo et al., 2020). For example, Shanxi Power Grid now has a preliminary mechanism for integrating the peaking auxiliary service with the spot market and has carried out a settlement trial run (Qin et al., 2023). Customer-side resources often interact with each other when participating in energy trading and flexible peaking auxiliary services, based on which the bidding strategies for their simultaneous participation in both the energy and peaking markets needs to be investigated (Khorasany et al., 2022). A few studies have explored this issue; for example, Li et al. (2023b) investigated a joint trading strategy for VPP participation in the electrical energy and peaking markets, where the VPP participates in peak shaving and peak filling through distributed energy storage and flexible loads. However, this approach ignores the impacts of user-side adjustable resource uncertainties on the decision-making behaviors of the VPPs. Alabi et al. (2021) and Mei et al. (2023) explored VPP participation in direct power trading and flexible peaking operation modes. Here, Alabi et al. (2021) describe the tariffs and new energy output uncertainties using stochastic and robust optimization methods, respectively. Mei et al. (2023) proposed a VPP day-ahead bidding strategy based on the conditional value-at-risk theory by considering wind power uncertainties. Customer-side adjustable resources include not only new energy but also several temperature-controlled loads, electric vehicles, and other adjustable loads (Cheng et al., 2023). Owing to multiple uncertainties such as market tariffs, environment, and customer participation willingness, the actual and predicted customer-side regulation capacities may have large deviations, and the bidding strategies must consider the revenue expectations under these deviated responses; however, none of the above works have considered the impacts of uncertainty of customer-side regulation capacity on the bidding strategy.
Current optimization methods for handling user-side regulation capacity uncertainties mainly include stochastic optimization (SO) and robust optimization (RO), among others. SO generally entails scenario generation through a probability distribution function, which ensures that the random variables satisfy the set constraints in each scenario, such as maximum or minimum response capacity limits (Sarfarazi et al., 2023).
Roald et al. (2023) assumed that the actual regulation capacities of incentive-based demand–response loads obey a truncated normal distribution, and they used a scenario-based SO approach to analyze the impact of user-side regulation capacity uncertainty on the economic dispatch of the system. Chassin and Rondeau (2016) proposed an electric energy market bidding strategy that takes into account the demand–response load uncertainty by assuming that the residential demand–response load participation rates obey normal, uniform, and skewed distributions. The performance of an SO method is determined by the accuracy of the probability distribution function of uncertain variables. However, given the diverse types of customer-side resources and large differences in their uncertainty characteristics, it is difficult to accurately describe the probability distribution of the actual regulation capacities of different types of customer-side resources. RO generally describes the range of variation of user-side response capacity through the uncertainty set and makes decisions based on the worst-case scenario (Li et al., 2023c). Du et al. (2024) investigated the demand–response load uncertainty based on real-time tariffs using an RO approach. The difficulty of RO lies in the construction of a suitable uncertainty set, and the commonly used uncertainty sets are the box, polyhedron, and ellipsoid sets, among others (Zhang et al., 2023). The customer-side regulation capacity uncertainty is related to multiple factors, such as the load participation rate, load type, and weather, while the uncertainty set is difficult to determine, leading to overly conservative results and lack of economy if the RO method is used directly.
In recent years, the distributionally robust chance constrained (DRCC) optimization method has garnered attention as it neither assumes a probability distribution function nor completely ignores information on probability distributions (Schwidtal et al., 2023). The DRCC model is based on a data-driven approach to construct a fuzzy set containing all possible probability distributions that is then solved on the basis of the worst probability distribution fuzzy set and worst-case probability distribution (Al-Jabouri et al., 2024). Compared with SO and chance constraints, the DRCC model does not assume that the uncertain variables obey specific probability distributions, which is more robust; compared with RO, the DRCC method considers all possible probability distribution data, which is less conservative (Liang et al., 2023). At present, DRCC methods have been studied for unit combination and economic dispatch; it is mostly used to handle the uncertainties of wind power, photovoltaic output, and load demand (Pan et al., 2023). There are very few studies on the application of the DRCC method to solve the bidding decision problem by considering uncertainty. For example, Jin et al. (2023) used the DRCC method to describe electric vehicle regulation capability uncertainty and proposed a bid-allocation decision method for electric vehicle aggregators. However, there are not many studies on applying the DRCC method to cope with user-side regulation capacity uncertainty in the user-side bidding decision problem. The use of the DRCC approach to handle user-side response uncertainty enables characterization of not only the uncertainty features of multiple types of user-side resources but also the variability of the uncertainty features. The constructed data-driven fuzzy set based on DRCC covers the uncertainty features of different types of loads and can solve the multitype user-side regulation capacity uncertainty problem more effectively.
This paper presents an integrated study of the joint optimization bidding strategy for user-side resources in both the day-ahead energy market and peaking ancillary services market. Initially, the DRCC method is used to establish an uncertainty model for user-side regulation capacity. In addressing the issue of diverse user-side resource types with significant differences in the uncertainty characteristics, which cannot be accurately described with a precise probability density function, this study employs a data-driven approach to construct fuzzy sets that characterize the load uncertainties without assuming a specific probability distribution for the random variables. Subsequently, to tackle the bidding risks arising from the user-side regulation capacity uncertainty, a risk-aware trading decision-making method is proposed that incorporates risk expectations and opportunity constraints. This method transforms the problem into a linear programming problem by applying a strong duality theory with a conditional value approximation method that can be solved using a commercial solver. Finally, the effectiveness of the risk-based bidding strategy grounded in the DRCC model is validated through numerical simulation.
2 User-side load modeling
Loads can participate in market transactions through tariff-based demand–response; they can independently choose the time to participate in regulation and the corresponding regulation capacity based on the tariff signal. Given the uncertainties in the response behaviors of different types of loads at different tariff levels, there are large deviations between the regulation capacities of the loads, i.e., the actual regulation capacity available for participating in the market and predicted value, which in turn pose revenue risks to the design of customer-side bidding strategies. Accordingly, the uncertainty in customer-side regulation capacity is modeled first. Section 2.1 provides an overview of the load deterministic model to measure the regulation capacities of loads participating in the market bidding, and Section 2.2 portrays the load regulation capacity uncertainty characteristics using the data-driven DRCC approach.
2.1 Load deterministic modeling
Tariff-based demand–response shifts the load demand by differentiating the purchase price of electricity, e.g., by increasing the price of electricity during peak hours and lowering it in the trough, thereby achieving peak shaving, valley filling, and smoothing of the load curve. The sensitivity of a load to changes in the electricity price is generally described by the elasticity coefficient. To reflect the sensitivities of different types of loads to price changes, we model the uncertainties of the user-side resources through the opportunity constraints of the SemBleu samples and construct the load deterministic model using the dynamic elastic coefficient to represent the variation in electricity prices during different periods. Assuming that the load demand
where in Equations (1, 2),
Based on the dynamic elasticity factor, the load regulation capacity is expressed as
where
2.2 Load regulation capacity uncertainty modeling
Based on the deterministic model given in Equations (3–5), the uncertainty model based on the DRCC method is explored herein.
Considering that the load regulation capacity is related to multiple influencing factors, such as user participation rate and price, the regulation capacity is difficult to accurately predict in reality; hence, the actual regulation capacity of the load is expressed as
where in Equation (6),
There are various types of loads, including industrial loads (e.g., steel industry) and residential loads (e.g., electric vehicles). In practice, it is difficult to accurately describe the specific probability distribution of the load prediction errors owing to the stochastic nature of their response behaviors and differing sensitivities of different types of loads to different influencing factors. To address this issue, we use a data-driven DRCC model to regulate the capacity uncertainties of multiple types of loads. The basic idea of this method is to construct a fuzzy uncertainty set containing all possible probability distributions based on historical data to describe the load regulation capacity differentiation uncertainty. The method not only utilizes the probability distribution information characterized by real historical data of the loads fully but also avoids the arbitrariness of setting a particular probability distribution directly.
2.2.1 Fuzzy sets based on Wasserstein distance
The Equation (7) based on the historical load-regulated capacity data, the set of samples of
The probability distance between the empirical and true distributions, i.e., the Wasserstein distance can be expressed as
where in Equations (8, 9),
A spherical fuzzy set
where in Equation (10),
2.2.2 Uncertainty sets based on the data-driven approach
In practical scenarios, the uncertainty set is constructed by analyzing the boundaries of the load forecast error; first, the sample set of historical data is normalized as
where in Equation (11),
where in Equation (12),
where
where
3 Modeling of joint bidding for user-side participation in the electrical energy and peaking ancillary services markets
This section presents the construction of a joint bidding decision optimization model for customer-side participation in the day-ahead electrical energy and peaking ancillary services markets to improve the market returns from customer-side resources. First, we construct a user-side preparticipation market deterministic bidding model and study the relevant constraints. Then, we construct a user-side preparticipation market risk bidding model by accounting for uncertainty and the risk bidding strategy of user-side participation in the joint market. The model effectively handles the uncertainty of user-side resources and reflects the changes in the user-side returns by adjusting the risk parameters and confidence levels.
3.1 Deterministic bidding model for the market before the day of user-side participation
3.1.1 Objective function
Customer-side resources, including distributed generation resources, distributed energy storage, and demand–response loads, can gain revenue by participating in the electrical energy and peaking ancillary services markets; however, they also have to bear the costs for purchasing electricity from the grid and operations. In this work, the optimization objective is to minimize the bidding cost for the user side to participate in the joint market a few days prior, and the bidding cost F includes the cost of purchasing and selling electricity in the energy market
The cost for participating in electricity purchase and sale transactions in the electricity energy market
where in Equation (16),
The operating cost for distributed energy storage
where in Equation (17),
The peak shifting revenue
where in Equations (18)–(20),
3.1.2 Constraints
The constraints are formulated using the internal power and bid capacity limits for new energy and storage.
The following constraints need to be met for the user side to participate in the joint market trading of day-ahead energy and peaking ancillary services:
3.1.2.1 Internal power balance constraints
where in Equation (21),
3.1.2.2 New energy bidding constraints
where Equations (22, 23) represent the bidding capacity constraints for new energy to participate in both the electrical energy and peaking ancillary services markets, i.e., the upward change of the new energy is no more than the maximum projected output on a generation basis and the downward change is no less than 0.
3.1.2.3 Distributed energy storage bidding constraints
Here, Equation (24) represents the charging and discharging power limitation constraints for distributed energy storage, and
3.1.2.4 Demand–response load bidding constraints
Here, Equation (31) indicates that the demand–response load
3.2 Market risk bidding model for day-ahead markets taking uncertainty into account
Based on the previous analysis, load uncertainty poses a revenue risk to decision-makers when formulating bidding strategies. To address this problem, we constructed a risky bidding decision model for user-side participation in the day-ahead market based on the distributional robust opportunity constrained optimization method. To construct the user-side day-ahead market risk bidding model that accounts for uncertainty, we first reconstructed the objective function by considering risk expectation and then analyzed the uncertainty of load capacity regulation with opportunity constraints to build the model.
3.2.1 Objective function reconstruction considering risk expectations
The load uncertainty variable error is set to
By substituting Equation (37) into the objective function of Equation (15), we get Equation (38):
The objective function of the risky bidding decision model is as shown in Equation (39) and consists of two components: the bidding cost of participating in the joint market and the expected cost of coping with the risks associated with uncertainty.
where
For convenience, the objective function of the DRCC model is written in the following abstract form:
where in Equation (40),
3.2.2 Opportunity constraint construction
Owing to uncertainty in the load regulation capacity, the bidding process for load participation in the joint electricity markets (i.e., electrical energy, peak shaving and peaking, and valley filling and peaking markets) has the same uncertainty. We introduce chance constraints to handle optimization problems containing random variables and increase the model robustness by setting a confidence level that allows the constraints to remain unsatisfied under a certain probability. There is also uncertainty in the capacity for handling load regulation. Specifically, this work uses opportunity constraints to model and analyze these uncertainties, as shown in Equations (41–45):
Here, Equations (41–45) denote the load bidding opportunity constraints for the electrical energy, peak shaving, and peak filling markets that are guaranteed to fail in the fuzzy set
4 Model solution
In the DRCC model considering risk expectation, the objective function contains a min–max two-layer structure and non-linear chance constraints that make it difficult to solve directly. First, we transformed the inner max problem of the model into a min problem based on the strong duality theory and then transformed the two-layer optimization to a single-layer optimization problem before solving the model using the fuzzy uncertainty set of load regulation capacity.
4.1 Objective function pairwise transformation
The objective function of the risk expectation DRCC model contains a min–max two-layer structure, which makes it difficult to solve directly. According to Slater’s theorem, the strong duality theory describes a special relationship between the primal and duality problems; if the primal and duality problems both have feasible solutions, then as long as one problem has an optimal solution, the other problem must also have an optimal solution, where the objective function values of the two optimal solutions are equal. Conditional value at risk refers to the average loss of the portfolio under the condition that this loss exceeds a given VaR value; it is known that the strong duality of the model holds, so we transformed the inner max problem to a min problem using the strong duality theory; further, we transformed the double-layer optimization to a single-layer optimization problem. The specific process is as follows:
where the random variable
According to the fuzzy uncertainty set of the load regulation capacity constructed in Section 2.2, the specific expression of the probability distribution space
where
The constraint inner layer function in Equation (46) can only take its maximum value at the boundary of the load uncertainty set, which can be obtained by substituting Equation (47) into Equation (46):
where in Equation (48),
In summary, considering the risk expectation DRCC model, the objective function can be pairwise transformed into a single-layer optimization model, as shown in Equation (49):
Then, the objective function is transformed into the expression of Equation (50) as Equation (55):
4.2 Conditional value-at-risk approximation
The general form of the opportunity constraints in Equations (41–45) of the model can be expressed as
where
The opportunity constraints are non-linear inequality constraints and are difficult to solve directly. In this work, the conditional value-at-risk concept is used to approximate the opportunity constraints, which are then transformed into a linear programming model for processing. The specific process is as follows.
The chance constraint inequality of Equation (51) can be expressed as
According to Theorem 1 in Ordoudis et al. (2021), the conditional value-at-risk not only considers the potential maximum loss at a given confidence level but also measures the average loss exceeding this threshold. By introducing appropriate variables and constraints, the risk measure of the conditional VaR is transformed to a part of the linear programming model, which is then solved using the standard linear programming technique; thus, Equation (52) can be transformed into the linear constraint given in Equation (53):
where
By taking Equation (41) as an example, we have
Then, the constraint Equation (54) is transformed into the expression of Equation (53) as Equation (55):
5 Example analysis
5.1 Parameter settings
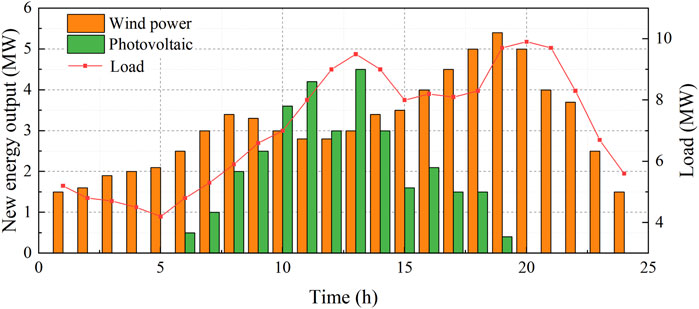
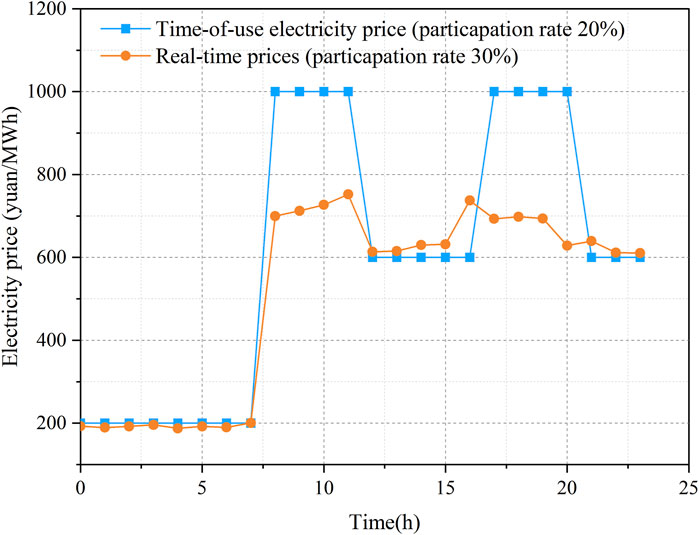
The customer-side resources mainly include wind power, photovoltaic output, distributed energy storage, and demand–response loads, among which wind power, photovoltaic output, and load demand forecast are as shown in Figure 1. The relevant parameters of the distributed energy storage are shown in Table 1 (Fan et al., 2023b). The maximum adjustment of the demand–response load at each moment in time does not exceed 10% of the base load value. The dynamic elasticity coefficient of the tariff-based demand–response is referred from Tan et al. (2017), and the parameters are set as shown in Figure 2. Load-side participation in the electricity market purchase and sale of the peak and valley prices of the electricity transactions for each time period are shown in Table 2. The peaking market peak filling, peak shaving/peaking time division, and tariffs are shown in Table 3. Our parameters are set on the basis of the forecast outputs of distributed energy storage and demand–response load mentioned in literature, while utilizing the relevant electricity price data published by the grid company.
5.2 Analysis of optimized bidding decisions in the previous day’s market
To verify the effectiveness of the bidding model constructed herein, the following four scenarios are established for comparative analysis. The purpose of Scenario 1 is to establish a baseline case that does not consider the uncertainty of user-side adjustment capacity; based on Scenario 1, Scenario 2 additionally includes the case that the user-side participates in the auxiliary service market for peak regulation at the same time. Scenario 3 focuses on user-side resources when only participating in the electricity market bidding, and the uncertainty of user-side regulation capacity is considered. Scenario 4 entails simulating the operating environment closest to the actual scenario and evaluates the effectiveness and robustness of the proposed strategy under dual uncertainty from market and regulatory capacities.
Scenario 1: The user side participates only in the electrical energy market bidding and does not account for the uncertainty of the user-side regulation capacity.
Scenario 2: The user side participates in both the electrical energy and peaking ancillary services markets while adopting the strategy devised herein, but does not account for the user-side regulation capacity uncertainty.
Scenario 3: The user side participates only in the electrical energy market bidding, and the uncertainty of the user-side regulation capacity is considered.
Scenario 4: The user side participates in both the electrical energy and peaking ancillary services markets while adopting the strategy devised herein and taking into account the user-side regulation capacity uncertainty.
Comparisons of the market returns on the customer side for different scenarios are shown in Table 4. The negative electrical energy market gains indicate that the costs of purchasing electricity on the load side are greater than the gains from selling electricity. From Table 4, it is seen that participating in the peak load balancing auxiliary service market (Scenarios 2 and 4) can significantly improve the total revenue of users compared to participating only in the electricity and energy markets (Scenarios 1 and 3). The operating costs of energy storage are relatively high in Scenarios 2 and 4, and Scenario 4 achieves the best total benefit through the strategy proposed herein when considering the uncertainty of user-side regulation capacity. It can be seen that the benefits are greatest in the scenario where the customer side participates in both the electrical energy and peak shaving auxiliary service markets. The customer side calls adjustable resources to participate in peak shaving and peak shifting to obtain peak shifting benefits while reducing the cost of purchasing electricity in the electrical energy market.
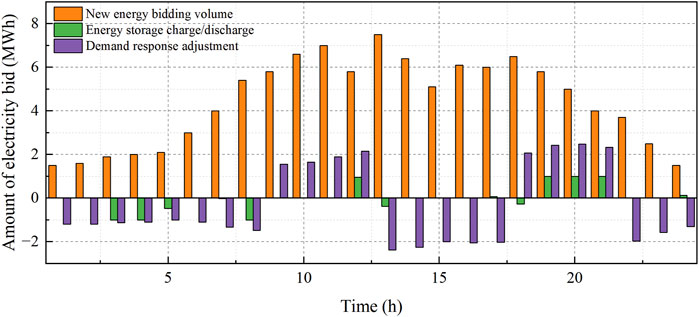
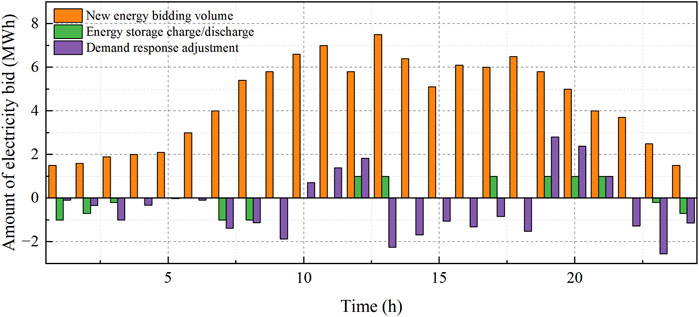
Figure 3 shows the trading strategy for the participation of user-side resources in the electrical energy market of Scenario 1, where the positive and negative values of the distributed energy storage represent the discharging and charging processes, while the positive and negative values of demand–response load adjustment represent the load curtailment and load increase, respectively. From the figure, it is seen that the user side reduces the power purchase costs through coordinated scheduling of the internal adjustable resources. Considering the high purchase prices of power in the market, the internal load supply source on the user side is mainly new energy. The energy storage is charged during the valley hours of 3:00–5:00 and discharged during the peak hours of 19:00–21:00, thus reducing the amount of power purchased during the high-price hours. As seen from the demand–response bidding bar chart, the demand–response load cuts the loads during the peak hours of 9:00–12:00 and 18:00–21:00 while increasing the loads during the valley hours of 0:00–8:00 and 22:00–24:00 to achieve peak cutting and valley filling that reduce the cost of purchasing power on the customer side.
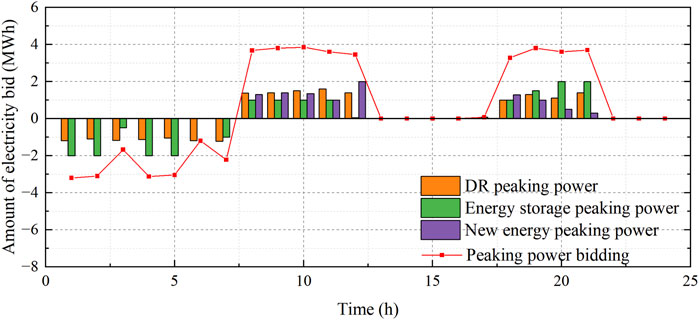
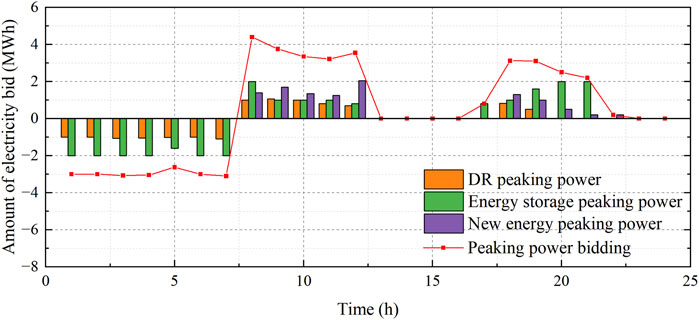
Figure 4 shows the bidding results of Scenarios 1 and 2 for user-side participation in electrical energy trading, where a positive bidding power indicates that the user side purchases power from the electrical energy market, and a negative value indicates that the user side sells power to the market. From the figure, it is seen that the user side mainly focuses on selling electricity to the grid from 8:00 to 12:00 because the market price of electricity is higher at this time. In addition, compared with Scenario 1, the user side purchases less power in the valley time, sells more power in the peak time, and purchases more power in the normal time in Scenario 2. Figure 5 shows the optimization strategy for Scenario 2 with adjustable loads for participating in the peaking auxiliary service market. The results show that when the customer side participates in both the electrical energy and peaking auxiliary service markets, the adjustable resources will preferentially participate in the market with higher returns. For example, the participation of adjustable resources in valley filling and peaking during the valley hours of 01:00–08:00 not only increases the peaking revenue but also reduces the amount of power purchased in the electrical energy market. The energy storage discharges to participate in peak shaving and peak regulation during the peak hours of 9:00–12:00 and 18:00–21:00, while charging during the flat hours. Demand–response loads participate in valley filling and peak shaving by increasing their electricity consumption during the valley hours and load curtailment during the peak hours as the benefits gained from participating in peak shaving at this time are greater than the cost reductions from participating in electrical energy trading.
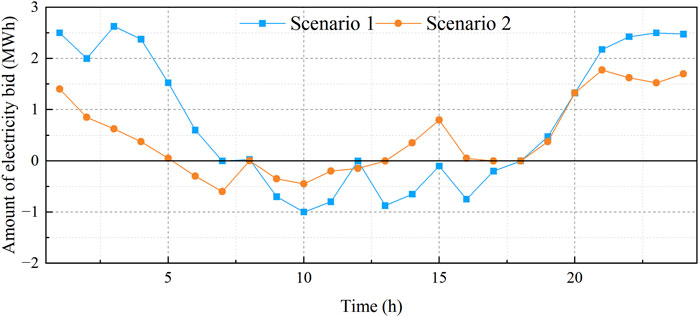
Figure 4. Bidding results for user-side participation in the electricity market under Scenarios 1 and 2
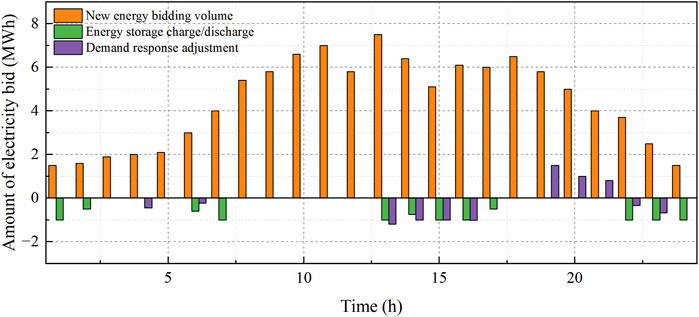
The optimization results for Scenarios 3 and 4 involve adjustable resources participating in the day-ahead energy market, as shown in Figures 6, 7, respectively. The bidding results for adjustable resource participation in the peaking ancillary services market for Scenario 4 are shown in Figure 8. Compared to Scenarios 1 and 2, the demand–response load participation in the market is lower in the uncertainty scenarios, while the amount of electricity purchased in the energy market increases, thus leading to lower customer-side revenues. This is because the customer-side bidding strategy is more conservative when considering the risk of demand–response uncertainty on bidding revenues, which is preferably compensated by purchasing power in the electrical energy market or calling other flexible resources with higher controllability. In addition, the results of the comparisons between Scenarios 3 and 4 show that when more uncertainty is considered, the bidding strategy of the customer side is more conservative and capacity of the demand–response load to participate in market bidding is reduced.
5.3 Comparative analysis of uncertain optimization methods
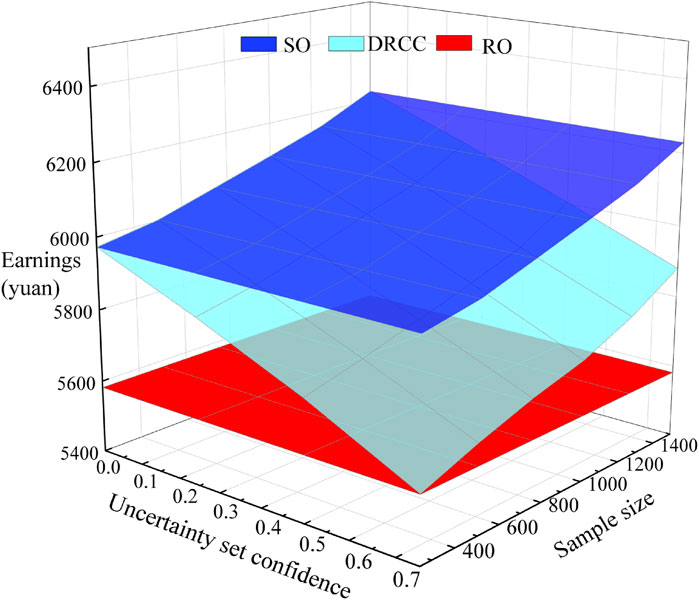
To verify the DRCC model proposed herein under consideration of risk expectation, SO is used for comparison and analysis against RO. The SO-based decision-making method assumes that the prediction error of the demand–response load obeys a Gaussian distribution with a mean of 0 and standard deviation of 0.2; accordingly, 1,500 sets of data are sampled by the Monte Carlo method selected for analysis.
Figure 9 shows how the load-side gains vary with confidence levels and sample numbers across the models. The SO model yields the highest gains, while the RO model yields the lowest. The DRCC model’s gains fall in between these and increase with more samples as the estimated distribution becomes more accurate, thus reducing decision conservatism. Moreover, the gains obtained by the user side based on the DRCC model increase with the number of samples; as more samples are included, the fuzzy centralized probability distribution tends to be closer to the true distribution, and the decision conservatism decreases. In addition, it is seen from the figure that the user-side gain decreases gradually with increase in confidence level. When the confidence level is low, the gain obtained by the DRCC model tends to be close to that of the SO model, and when the confidence level is high, the results gradually converge to those of the RO model. This is because, when the confidence level is 0, the uncertainty set includes only the empirical distribution such that the DRCC model degenerates into the SO model. As the confidence level increases, the uncertainty in the system increases, which makes the model more robust and bidding strategy on the user side more conservative, thereby decreasing the corresponding gain and converging toward the RO model. The SO-based approach assumes that the demand–response prediction error obeys a given probability distribution in the fuzzy set of the DRCC model, so the conservatism is low and the user-side gains are higher. The RO-based approach considers the worst-case scenario in the demand–response uncertainty set, resulting in overly conservative RO decision results and lowest user-side gains. The DRCC model in this work does not require a specific probability distribution of the demand–response uncertainty variable and considers all possible probability distribution information to make an optimization decision based on the worst probability distribution, such that the conservatism is between those of the RO and SO approaches.
Table 5 shows the computation times of the RO, SO, and DRCC models for different numbers of samples; the results show that as the number of samples increases, the solution times of all three models increase. The computation time of the DRCC model is within 15 s and does not change drastically with a change in the number of samples, indicating that the model has good computational adaptability.
5.4 Analysis of the impact of model parameters
The confidence level
6 Conclusion
In the context of the electricity market, this work proposes a joint bidding method for user-side resources to participate in both the electrical energy and peaking auxiliary service markets; we constructed a day-ahead market bidding decision model based on risk expectation and distributional robust opportunity constraints in response to load uncertainties. The main conclusions of this study based on numerical validation are as follows:
1) The user-side joint bidding strategy for participation in the electrical energy and peaking auxiliary service markets based on the distributional robust opportunity constraints proposed herein can effectively cope with the bidding risk caused by user-side resource uncertainty. The user side can balance the economy and reliability of decision-making by adjusting the confidence level and risk coefficient of the fuzzy uncertainty set, which provides a high degree of flexibility. This promotes optimal allocation of power resources in the market and improves the overall energy efficiency; effective management of the user-side resource uncertainty thus helps reduce market volatility and promote long-term market stability.
2) The DRCC model constructed herein by considering risk expectation achieves better balance between robustness and economy. Compared with the RO and SO models, the DRCC model overcomes the problem of the RO model that is too conservative and has better computational adaptability than the SO model. The DRCC model reduces conservatism, avoids the problem of over-conservatism, and improves the computational adaptability. At the same time, in the power system, it enables better dispatch of the power resources, balanced supply and demand, reduction of the cost problem caused by uncertainty, enhanced adaptability of the system to different situations, and improved robustness of the entire system.
3) The present study focuses on the impacts of demand–response load uncertainties on user-side revenue; however, incorporating uncertainties regarding different types of user-side resources into the user-side bidding decision models will be the focus of subsequent research efforts. We intend to handle the uncertainty of user-side resources through SemBleu stick optimization and opportunity constraints as well as address the problems thereof using conditional risk-based approximation; we will also incorporate the uncertainties of different types of user-side resources into the user-side bidding decision model.
Data availability statement
The original contributions presented in this study are included in the article/supplementary material, and any further inquiries may be directed to the corresponding author.
Author contributions
JW: Conceptualization, Data curation, Formal Analysis, Funding acquisition, Methodology, Project administration, Resources, Software, Validation, Writing–original draft, Writing–review and editing. JH: formal Analysis, Funding Acquisition, Resources, Writing–original draft, Writing–review and editing. ZB: Investigation, Methodology, Project administration, Writing–original draft, Writing–review and editing. HH: Software, Supervision, Visualization, Writing–original draft. MT: Formal Analysis, Methodology, Writing–original draft.
Funding
The authors declare that financial support was received for the research, authorship, and/or publication of this article. This work was supported by the State Grid Inner Mongolia East Electric Power Company Economic and Technological Research Institute (Research on the benefit mechanism of source, grid, load and energy storage multi-body cooperative power transmission of energy bases in large desert, Gobi and wasteland; No. 526606230001).
Conflict of interest
The authors declare that the research was conducted in the absence of any commercial or financial relationships that could be construed as a potential conflict of interest.
The authors declare that this study received funding from State Grid Inner Mongolia East Electric Power Company Economic and Technological Research Institute. The funder had the following involvement in the study: collection, analysis, interpretation of data, the writing of this article, the decision to submit it for publication.
Publisher’s note
All claims expressed in this article are solely those of the authors and do not necessarily represent those of their affiliated organizations, or those of the publisher, the editors and the reviewers. Any product that may be evaluated in this article, or claim that may be made by its manufacturer, is not guaranteed or endorsed by the publisher.
References
Alabi, T. M., Lu, L., and Yang, Z. (2021). Improved hybrid inexact optimal scheduling of virtual powerplant (VPP) for zero-carbon multi-energy system (ZCMES) incorporating Electric Vehicle (EV) multi-flexible approach. J. Clean. Prod. 326, 129294. doi:10.1016/j.jclepro.2021.129294
Alahyari, A., Ehsan, M., and Mousavizadeh, M. (2019). A hybrid storage-wind virtual power plant (VPP) participation in the electricity markets: a self-scheduling optimization considering price, renewable generation, and electric vehicles uncertainties. J. Energy Storage 25, 100812. doi:10.1016/j.est.2019.100812
Al-Jabouri, H., Saif, A., Diallo, C., and Khatab, A. (2024). Distributionally-robust chance-constrained optimization of selective maintenance under uncertain repair duration. Expert Syst. Appl. 239, 122303. doi:10.1016/j.eswa.2023.122303
Bai, Y., Zhang, W., Yu, T., Wang, J., Deng, G., Yan, J., et al. (2023). Flexibility quantification and enhancement of flexible electric energy systems in buildings. J. Build. Eng. 68, 106114. doi:10.1016/j.jobe.2023.106114
Cao, Y., and Zhang, S. (2023). Facilitating the provision of load flexibility to the power system by data centers: a hybrid research method applied to China. Util. Policy 84, 101636. doi:10.1016/j.jup.2023.101636
Chassin, D. P., and Rondeau, D. (2016). Aggregate modeling of fast-acting demand response and control under real-time pricing. Appl. Energy 181, 288–298. doi:10.1016/j.apenergy.2016.08.071
Cheng, Y., Zheng, H., Juanatas, R. A., and Golkar, M. J. (2023). Profitably scheduling the energy hub of inhabitable houses considering electric vehicles, storage systems, revival provenances and demand side management through a modified particle swarm optimization. Sustain. Cities Soc. 92, 104487. doi:10.1016/j.scs.2023.104487
Datta, J., and Das, D. (2023). Energy management of multi-microgrids with renewables and electric vehicles considering price-elasticity based demand response: a bi-level hybrid optimization approach. Sustain. Cities Soc. 99, 104908. doi:10.1016/j.scs.2023.104908
Du, J., Han, X., and Wang, J. (2024). Distributed cooperation optimization of multi-microgrids under grid tariff uncertainty: a nash bargaining game approach with cheating behaviors. Int. J. Electr. Power and Energy Syst. 155, 109644. doi:10.1016/j.ijepes.2023.109644
Fan, W., Ju, L., Tan, Z., Li, X., Zhang, A., Li, X., et al. (2023a). Two-stage distributionally robust optimization model of integrated energy system group considering energy sharing and carbon transfer. Appl. Energy 331, 120426. doi:10.1016/j.apenergy.2022.120426
Fan, W., Tan, Z., Li, F., Zhang, A., Ju, L., Wang, Y., et al. (2023b). A two-stage optimal scheduling model of integrated energy system based on CVaR theory implementing integrated demand response. Energy 263, 125783. doi:10.1016/j.energy.2022.125783
Guo, H., Davidson, M. R., Chen, Q., Zhang, D., Jiang, N., Xia, Q., et al. (2020). Power market reform in China: motivations, progress, and recommendations. Energy Policy 145, 111717. doi:10.1016/j.enpol.2020.111717
Hasan, M., Mifta, Z., Salsabil, N. A., Papiya, S. J., Hossain, M., Roy, P., et al. (2023). A critical review on control mechanisms, supporting measures, and monitoring systems of microgrids considering large scale integration of renewable energy sources. Energy Rep. 10, 4582–4603. doi:10.1016/j.egyr.2023.11.025
Jin, Y., Amoasi Acquah, M., Seo, M., Ghorbanpour, S., Han, S., and Jyung, T. (2023). Optimal EV scheduling and voltage security via an online bi-layer steady-state assessment method considering uncertainties. Appl. Energy 347, 121356. doi:10.1016/j.apenergy.2023.121356
Khodadadi, A., Söder, L., and Amelin, M. (2022). Stochastic adaptive robust approach for day-ahead energy market bidding strategies in hydro dominated sequential electricity markets. Sustain. Energy, Grids Netw. 32, 100827. doi:10.1016/j.segan.2022.100827
Khorasany, M., Shokri Gazafroudi, A., Razzaghi, R., Morstyn, T., and Shafie-khah, M. (2022). A framework for participation of prosumers in peer-to-peer energy trading and flexibility markets. Appl. Energy 314, 118907. doi:10.1016/j.apenergy.2022.118907
Li, C., Wang, X., Li, J., Zhu, X., Yan, G., and Jia, C. (2023a). Multi-constrained optimal control of energy storage combined thermal power participating in frequency regulation based on life model of energy storage. J. Energy Storage 73, 109050. doi:10.1016/j.est.2023.109050
Li, Y., Deng, Y., Wang, Y., Jiang, L., and Shahidehpour, M. (2023b). Robust bidding strategy for multi-energy virtual power plant in peak-regulation ancillary service market considering uncertainties. Int. J. Electr. Power and Energy Syst. 151, 109101. doi:10.1016/j.ijepes.2023.109101
Li, Y., Zhang, J., Wu, X., Shen, J., and Maréchal, F. (2023c). Stochastic-robust planning optimization method based on tracking-economy extreme scenario tradeoff for CCHP multi-energy system. Energy 283, 129025. doi:10.1016/j.energy.2023.129025
Liang, Y., Lin, S., Feng, X., Liu, M., Su, L., and Zhang, B. (2023). Optimal resilience enhancement dispatch of a power system with multiple offshore wind farms considering uncertain typhoon parameters. Int. J. Electr. Power and Energy Syst. 153, 109337. doi:10.1016/j.ijepes.2023.109337
Lin, Q., Lu, S., Yue, L., and Guo, T. (2023). A two-stage optimization method for improving the load flexibility of existing district energy systems. Energy Build. 301, 113680. doi:10.1016/j.enbuild.2023.113680
Mei, S., Tan, Q., Liu, Y., Trivedi, A., and Srinivasan, D. (2023). Optimal bidding strategy for virtual power plant participating in combined electricity and ancillary services market considering dynamic demand response price and integrated consumption satisfaction. Energy 284, 128592. doi:10.1016/j.energy.2023.128592
Ordoudis, C., Nguyen, V. A., Kuhn, D., and Pinson, P. (2021). Energy and reserve dispatch with distributionally robust joint chance constraints. Operations Res. Lett. 49, 291–299. doi:10.1016/j.orl.2021.01.012
Pan, L., Xu, X., Yang, Y., Liu, J., and Hu, W. (2023). Distributionally robust economic scheduling of a hybrid hydro/solar/pumped-storage system considering the bilateral contract flexible decomposition and day-ahead market bidding. J. Clean. Prod. 428, 139344. doi:10.1016/j.jclepro.2023.139344
Qin, Y., Rao, Y., Xu, Z., Lin, X., Cui, K., Du, J., et al. (2023). Toward flexibility of user side in China: virtual power plant (VPP) and vehicle-to-grid (V2G) interaction. eTransportation 18, 100291. doi:10.1016/j.etran.2023.100291
Roald, L. A., Pozo, D., Papavasiliou, A., Molzahn, D. K., Kazempour, J., and Conejo, A. (2023). Power systems optimization under uncertainty: a review of methods and applications. Electr. Power Syst. Res. 214, 108725. doi:10.1016/j.epsr.2022.108725
Sarfarazi, S., Mohammadi, S., Khastieva, D., Hesamzadeh, M. R., Bertsch, V., and Bunn, D. (2023). An optimal real-time pricing strategy for aggregating distributed generation and battery storage systems in energy communities: a stochastic bilevel optimization approach. Int. J. Electr. Power and Energy Syst. 147, 108770. doi:10.1016/j.ijepes.2022.108770
Schwidtal, J. M., Agostini, M., Coppo, M., Bignucolo, F., and Lorenzoni, A. (2023). Optimized operation of distributed energy resources: the opportunities of value stacking for Power-to-Gas aggregated with PV. Appl. Energy 334, 120646. doi:10.1016/j.apenergy.2023.120646
Tan, Z., Wang, G., Ju, L., Tan, Q., and Yang, W. (2017). Application of CVaR risk aversion approach in the dynamical scheduling optimization model for virtual power plant connected with wind-photovoltaic-energy storage system with uncertainties and demand response. Energy 124, 198–213. doi:10.1016/j.energy.2017.02.063
Xie, Y., Wu, X., Hou, Z., Li, Z., Luo, J., Lüddeke, C. T., et al. (2023). Gleaning insights from German energy transition and large-scale underground energy storage for China’s carbon neutrality. Int. J. Min. Sci. Technol. 33, 529–553. doi:10.1016/j.ijmst.2023.04.001
Zhang, G., Jia, N., Zhu, N., He, L., and Adulyasak, Y. (2023). Humanitarian transportation network design via two-stage distributionally robust optimization. Transp. Res. Part B Methodol. 176, 102805. doi:10.1016/j.trb.2023.102805
Zhang, J., and Liu, Z. (2023). Low carbon economic dispatching model for a virtual power plant connected to carbon capture system considering green certificates-carbon trading mechanism. Sustain. Energy Technol. Assessments 60, 103575. doi:10.1016/j.seta.2023.103575
Keywords: user-side resource, auxiliary service for peak load balancing, distributionally robust chance constraints, fuzzy set, robustness and economic balance
Citation: Wang J, Hu J, Bai Z, He H and Tang M (2024) Robust optimization bidding strategy for user-side resource-side participation in the market distribution of electrical energy and peaking ancillary services considering risk expectations and opportunity constraints. Front. Energy Res. 12:1469739. doi: 10.3389/fenrg.2024.1469739
Received: 24 July 2024; Accepted: 26 September 2024;
Published: 29 October 2024.
Edited by:
Duo Li, Newcastle University, United KingdomReviewed by:
Shenbo Yang, Beijing University of Technology, ChinaXiaolong Yang, Northeast Electric Power University, China
Hongye Wang, Dalian University of Technology, China
Copyright © 2024 Wang, Hu, Bai, He and Tang. This is an open-access article distributed under the terms of the Creative Commons Attribution License (CC BY). The use, distribution or reproduction in other forums is permitted, provided the original author(s) and the copyright owner(s) are credited and that the original publication in this journal is cited, in accordance with accepted academic practice. No use, distribution or reproduction is permitted which does not comply with these terms.
*Correspondence: Jiao Wang, MTY3NzUxMjcxNEBxcS5jb20=
 Jiao Wang1*
 Hao He