- 1School of Electrical Engineering, China University of Mining and Technology, Xuzhou, China
- 2State Grid Lianyungang Power Supply Company, Lianyungang, China
- 3School of Cyber Science and Engineering, Southeast University, Nanjing, China
- 4School of Automation, Nanjing Institute of Technology, Nanjing, China
In the field of renewable energy, accurate long-term time series forecasting is crucial for optimizing the operation of power systems and reducing risks. Due to the intermittency of renewable energy sources, traditional data-driven deep learning methods face challenges in capturing long-term dependencies. This paper proposes a hybrid model that combines Sparse Identification (SI) with Convolutional Neural Networks (CNN) to enhance the interpretability and generalization of predictions. The SI method is utilized to extract trends, seasonality, and periodicity, while the deep neural network captures complex relationships. Experimental results demonstrate that the model exhibits high accuracy and practicality in forecasting new energy scenario data, contributing to the advancement of time series prediction methodologies.
1 Introduction
As the global energy landscape undergoes a significant transformation, driven by heightened environmental concerns and the pressing need to transition toward sustainable energy practices, the focus has shifted dramatically from traditional fossil fuel-based systems to renewable energy sources, such as wind and solar power (Pachauri et al., 2014). This transition is motivated not only by the imperative to mitigate climate change and reduce greenhouse gas emissions but also by the pursuit of sustainable energy development and the enhancement of energy security.
Renewable energy sources are characterized by their cleanliness and low carbon footprint, but their volatility and unpredictability present new challenges to the stability and reliability of power systems. The power generation of wind and solar energy is influenced by various factors, including geographical location, seasonal changes, and weather conditions. The uncertainty of these factors increases the complexity of power system scheduling (Denholm and Hand, 2011). Therefore, the development of accurate long-term time series forecasting technology is of great significance for optimizing the allocation of electrical resources, reducing operational costs, improving system efficiency, and ensuring the stability of power supply. Accurate forecasting can not only assist electricity operators in formulating more reasonable power generation plans and scheduling strategies but also provide decision support for the expansion and upgrading of the power grid. Long-term time series forecasting thus becomes a critical tool in addressing these challenges, enabling grid operators to optimize resource management, reduce operational costs, and ensure the continuous stability of the power supply. Accurate forecasting, particularly for renewable energy sources, helps in crafting informed scheduling strategies and making well-founded decisions for grid expansion.
Conventional forecasting methodologies, such as ARIMA models and exponential smoothing, are often predicated on linear relationships and statistical assumptions, which may limit their efficacy in addressing the complex dynamics characteristic of renewable energy data (Box et al., 2015); (Wei et al., 2024). These methods frequently fall short in capturing the nonlinear patterns and long-term dependencies present in the data, thereby compromising the accuracy of predictions in practical scenarios (Liu et al., 2024b). The advent of deep learning has heralded new opportunities for enhancing the accuracy of time series forecasts. Recurrent Neural Networks (RNNs), and specifically Long Short-Term Memory Networks (LSTMs), have risen to prominence due to their capacity to capture long-range dependencies in sequential data (Hochreiter and Schmidhuber, 1997). LSTMs mitigate the vanishing gradient issue associated with standard RNNs through the incorporation of gating mechanisms, thereby enhancing the model’s proficiency in time series forecasting tasks. Despite these advancements, LSTMs encounter challenges when processing extremely lengthy sequences, and their “black box” nature can obfuscate the interpretability of the model. In the pursuit of excellence in forecasting models, recent studies have also explored the potential of models such as autoformer Wu et al. (2021) and DLinear Zeng et al. (2023) as benchmarks for evaluating the performance of new forecasting models.
Sparse Identification (SI) is utilized in this study as a method to extract primary temporal patterns, such as seasonality and periodicity, which are essential in renewable energy systems where dependencies extend across both short and long-term horizons. Although SI has traditionally been applied in dynamic system modeling, recent research has demonstrated its applicability in long-term forecasting. For instance, Liu et al. (2024a) showed that SI can provide interpretable and effective long-term predictions by distilling key components of time series signals, thereby offering a compact structure suitable for extended forecasting tasks in time-series data (Liu et al., 2024a). Moreover, the prowess of CNN in the realm of image recognition, where it has demonstrated an adeptness at capturing local features and spatial relationships, can be harnessed in time series forecasting to effectively seize local patterns and temporal dependencies within the data, thus refining the accuracy of forecasts (LeCun et al., 2015). The hybrid model framework outlined in this study endeavors to augment the precision and reliability of renewable energy power generation forecasting. It synergizes the feature selection prowess of SI with the local feature capture capabilities of CNN, bolstered by an innovative fine-tuning strategy that optimizes the coefficient matrix during the SI process.
The importance of our research in renewable energy is further highlighted by the recent innovative achievements within the field. For instance, Liu and Zhang have reviewed the development and trends in deep learning methods for wind power predictions, highlighting the importance of accurate forecasting in wind energy management (Liu and Zhang, 2024). Zhang et al. have proposed a wind power forecasting system with data enhancement and algorithmic improvements, emphasizing the role of advanced algorithms in improving predictive accuracy (Zhang et al., 2024). Furthermore, Liu and Zhang introduced a bi-party engaged modeling framework for renewable power predictions with privacy-preserving features, showcasing the potential of collaborative models in ensuring data security while maintaining forecasting efficacy (Liu and Zhang, 2022). The innovative work by Kang et al. on cross-modal generative adversarial networks (CM-GAN) further underscores the potential for scenario generation in renewable energy contexts, marking new frontiers in energy forecasting (Kang et al., 2023). Additionally, Kang et al. presented CM-GAN as a solution for imputing completely missing data in digital industries, highlighting the versatility and robustness of such models in handling data challenges (Kang et al., 2024). Zheng and Zhang have introduced a stochastic recurrent encoder-decoder network for multistep probabilistic wind power predictions, underlining the growing interest in probabilistic forecasting to better manage the inherent uncertainty in renewable energy sources (Zheng and Zhang, 2023). As we delve into the intricacies of our proposed hybrid model, we acknowledge the foundational contributions of these studies. Our work builds upon these advancements, integrating the strengths of deep learning and sparse identification to enhance the accuracy and interpretability of long-term renewable energy forecasts. Through continuous innovation and collaboration, we aim to further refine the reliability of renewable energy power generation forecasting, thereby contributing to a more sustainable and secure energy future.
With proven effectiveness in managing complex time series data, these models provide a strong foundation for developing our hybrid model framework. To improve forecast precision and interpretability, we propose a hybrid framework that combines Sparse Identification (SI) with Convolutional Neural Networks (CNN). This approach leverages SI’s feature selection capabilities alongside CNN’s ability to capture local temporal and spatial patterns, significantly enhancing the accuracy and robustness of renewable energy power generation forecasts. Additionally, we introduce a fine-tuning strategy that optimizes the SI coefficient matrix, further adapting the model to specific datasets and improving predictive performance. The main contributions of this work are as follows:
1) Innovative Hybrid Forecasting Model: This paper introduces a novel hybrid model that integrates Sparse Identification (SI) with Convolutional Neural Networks (CNN), specifically tailored for electrical energy data, particularly long-term time series forecasting of wind power generation. This integration not only enhances the accuracy of predictions but also strengthens the model’s adaptability to the characteristics of new energy data.
2) New Framework for Mechanism and Data Fusion: We have developed a computational framework that merges mechanism and data, combining the powerful learning capabilities of deep learning with the mechanistic interpretation of sparse identification to address complex forecasting issues in power systems. This fusion method enhances the model’s interpretability and generalization ability, especially in dealing with the nonlinearity and randomness of wind power data.
3) Innovative Fine-Tuning Strategy: We introduce an innovative fine-tuning strategy aimed at optimizing the coefficient matrix obtained during the sparse identification process to adapt to specific tasks or datasets. This fine-tuning is implemented through learnable parameters within the neural network, typically involving minor adjustments, thereby significantly improving the model’s adaptability and predictive performance for specific datasets.
2 Problem definition
Recognizing the profound impact of physical mechanisms on engineering systems within the realm of renewable energy, we have redefined time series prediction from the perspective of physical dynamics. In the context of renewable energy systems, each node’s features evolve according to dynamic mechanisms that can be described by ordinary differential equations. Specifically, for a system with
In this equation,
Traditional single-channel sparse identification methods can determine
3 Methodology
3.1 Sparse identification of fusion neural network model
This section provides a detailed exposition of the Sparse Identification Fusion Neural Network Model (SINN) designed for forecasting in the domain of electric power energy data. SINN represents an innovative hybrid model that integrates Sparse Identification (SI) with a Three-Dimensional Convolutional Neural Network (3D CNN), with the aim of enhancing the accuracy and efficiency of time series predictions.
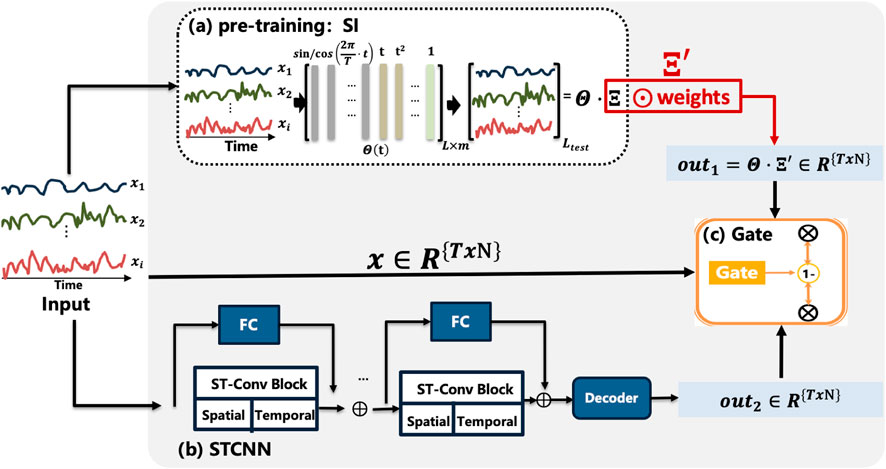
As depicted in Figure 1, the core concept of this model is to utilize SI as a pre-training step. Initially, the input multivariate time series data is represented as
Subsequently, a tailored 3D CNN is employed to further extract features from the multivariate time series data. This CNN architecture includes convolutional layers designed to capture both spatial and temporal dependencies, enhancing the model’s ability to learn complex relationships within the data. To adapt the sparse identification (SI) results to the nuances of the input data, a learnable parameter matrix
Overall, the SINN model integrates the interpretability of sparse identification (SI) with the precision of a 3D CNN, forming a robust architecture for time series prediction in energy systems. Initially, SI pre-training captures the fundamental dynamics of the data, setting a strong foundation (Section 3.1.1). The 3D CNN then extracts complex spatial and temporal features, while a learnable parameter matrix
3.1.1 Sparse identification model
In the context of time series forecasting for electric power energy data, we transform the observed wind power output variables into their time derivatives to better capture their dynamic variations. For a time series
here,
here,
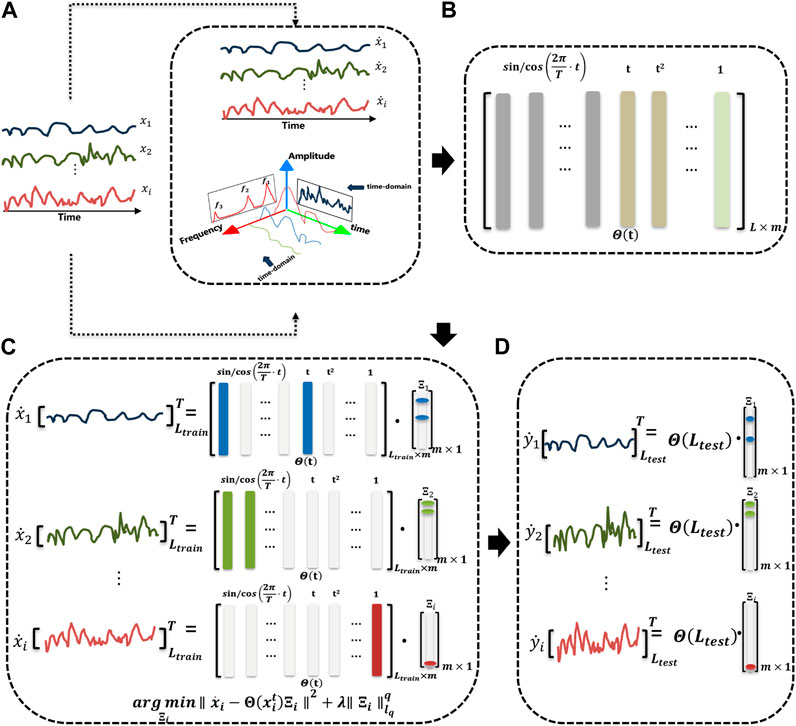
Figure 2. Sparse identification model. (A) Observed data analysis. (B) Construct library of candidate basis. (C) Solve the optimization equation for the sparse matrix. (D) Predict.
3.1.2 Neural network
In this research, we harness the power of a Three-Dimensional Convolutional Neural Network (3D CNN) to enhance the sparse identification model’s predictive accuracy for electric power energy data. Specifically, we enhance the predictive capability of the sparse identification (SI) model for electric power forecasting by embedding geographic dependencies inherent in spatially distributed wind turbines directly into a 3D CNN framework. Each turbine’s geographic coordinates, specifically longitude and latitude, are first normalized and then embedded into a 2D coordinate grid to match the spatial layout of the turbines, thereby encoding relative positions in a spatial grid
Additionally, a learnable parameter matrix
This embedding of geographic information enables the model to capture the complex spatial and temporal interactions among turbines, advancing forecasting performance by effectively adapting to both spatially and temporally dependent dynamics in renewable energy generation. The integration of these advanced techniques positions our model at the forefront of renewable energy forecasting, offering a nuanced and robust framework capable of adapting to the intricate dynamics of power generation from renewable sources.
3.1.3 Fusion Gate
Fusion Gate represents the culmination of our approach, seamlessly integrating the outputs of the neural network and the sparse identification model to forge a more precise forecasting model. This synthesis is facilitated by a gating mechanism that is learned through the neural network, harnessing average pooling to extract global average input data, which then serves as input to the network for generating gating signals. The fusion process is encapsulated by the Equation 4:
here, “gate” signifies the gating information derived from the neural network, FC denotes the fully connected layer that processes the pooled features, Pool represents the pooling operation that condenses input data to its essential average values, and “
Expanding on this, the Fusion Gate is a critical component that allows for the dynamic weighting of the contributions from both models, ensuring that the final prediction benefits from the strengths of each while mitigating their individual weaknesses. The gating mechanism itself is a sophisticated construct that adjusts based on the learned patterns within the data, effectively balancing the predictive power of the CNN’s spatial-temporal insights with the SI model’s ability to capture underlying trends and seasonality.
The fully connected layer within this mechanism plays a pivotal role in the final stage of the fusion process, translating the pooled, averaged data into a gating signal that dictates the influence of each model’s output on the final prediction. This signal, a continuous value between 0 and 1, dynamically adjusts to the predictive context, ensuring that the combined output is not only an aggregation but a thoughtful integration of the two models’ insights.
The resulting fusion of expertise from both the CNN and SI models through the gating mechanism is a testament to our approach’s adaptability and robustness. It is this strategic integration that propels our forecasting model to new heights of accuracy and reliability in the complex domain of renewable energy prediction, where the interplay of various factors must be precisely understood and forecasted. Here, “gate” represents the computed gating information, FC denotes the fully connected layer, Pool represents the pooling operation, and “
4 Experiment
4.1 Description of datasets
4.1.1 Wind power dataset
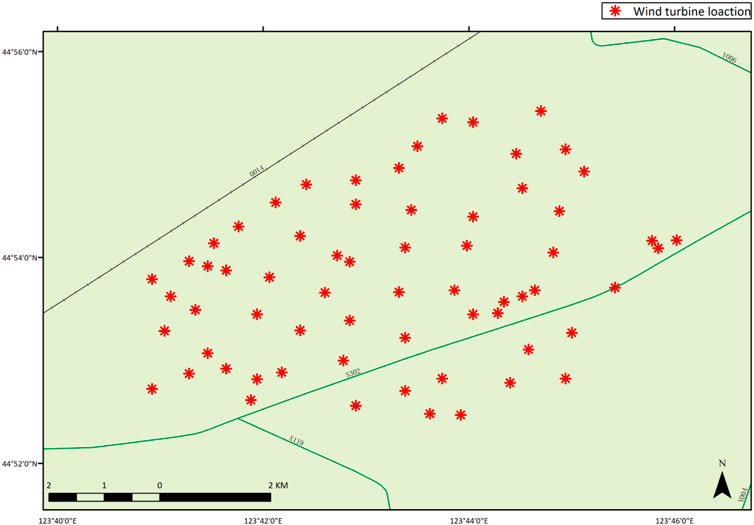
The dataset utilized in this experiment is derived from public data of a wind farm located in Jilin Province, China. Comprising 66 wind turbines (WTs), each with a standard rated power output of 1,500 kW, the dataset provides a rich source of information for our analysis. To balance representativeness with computational tractability for the purposes of this study, a random sampling method was employed to select 7 wind turbines as the subjects of our research. Each wind turbine is treated as an independent power generation unit within the scope of this study.
The dataset spans a period of 10 months and includes a variety of meteorological and power production parameters such as wind speed, wind direction, temperature, and corresponding power output. All data have been aggregated at a 1-h granularity, providing sufficient temporal resolution for analyzing both short-term fluctuations and long-term trends of the wind farm. Additionally, the spatial resolution of the dataset is defined by the GPS coordinates of the wind turbines within the farm, which are illustrated in Figure 3 of the document.
To ensure the quality and accuracy of the data, preprocessing steps were undertaken, encompassing the treatment of missing values, detection of outliers, and standardization of data. Missing values were imputed using interpolation methods, while outliers were identified and corrected based on statistical tests. The standardization process ensures the comparability of different parameters and enhances the model’s ability to generalize across various conditions.
4.2 Metrics
In our experimental assessment, we employed three standard metrics for evaluating time series prediction:
MAE (Mean Absolute Error) measures the average absolute deviation between predicted and actual values. It is calculated using Equation 5:
where
MSE (Mean Squared Error) measures the average squared difference between the predicted values and the actual values. It’s calculated using Equation 6:
MAPE (Mean Absolute Percentage Error) quantifies the average relative difference between predicted and observed values, typically expressed as a percentage, and is computed by Equation 7:
4.3 Renewable energy generation forecasting
The central objective of this study is to substantiate the efficacy of the proposed hybrid model, termed the Sparse Identification Fusion Neural Network (SINN), in practical tasks of renewable energy generation forecasting. To achieve this, extensive experiments were conducted on a wind power generation dataset, sampled at an hourly granularity over a total duration of 7,288 h. The dataset was meticulously partitioned into training, validation, and testing sets in an 8:1:1 ratio, ensuring the model demonstrates commendable stability and generalization across various data phases.
In the forecasting task, a prediction time window of 96 steps was established, and predictions spanning up to 336 steps were performed on the test set to evaluate the model’s capability to capture long-term trends. The assessment criteria selected for evaluation encompass Mean Squared Error (MSE), Mean Absolute Error (MAE), and Mean Absolute Percentage Error (MAPE), which collectively provide a comprehensive reflection of the model’s predictive accuracy and error distribution.
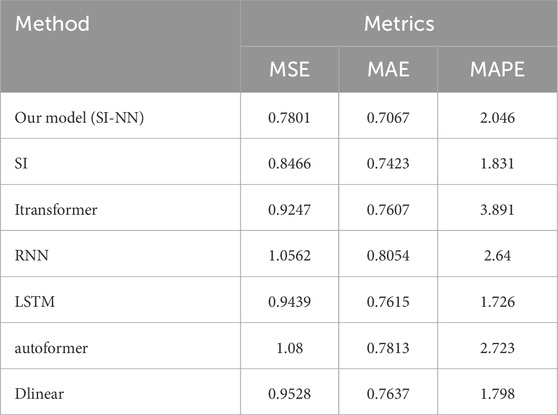
The experimental outcomes shown in Table 1 demonstrate the SINN model’s superiority across all evaluation metrics compared to other comparative models. Specifically, the SINN model yielded an MSE of 0.7801, MAE of 0.7067, and MAPE of
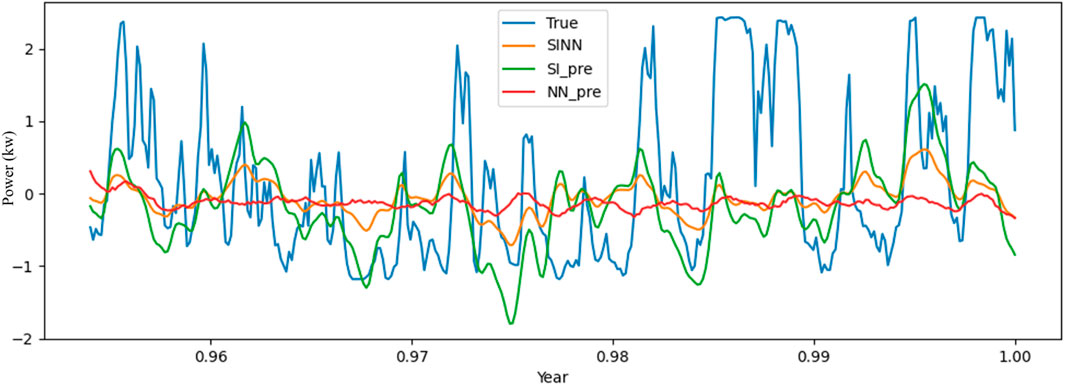
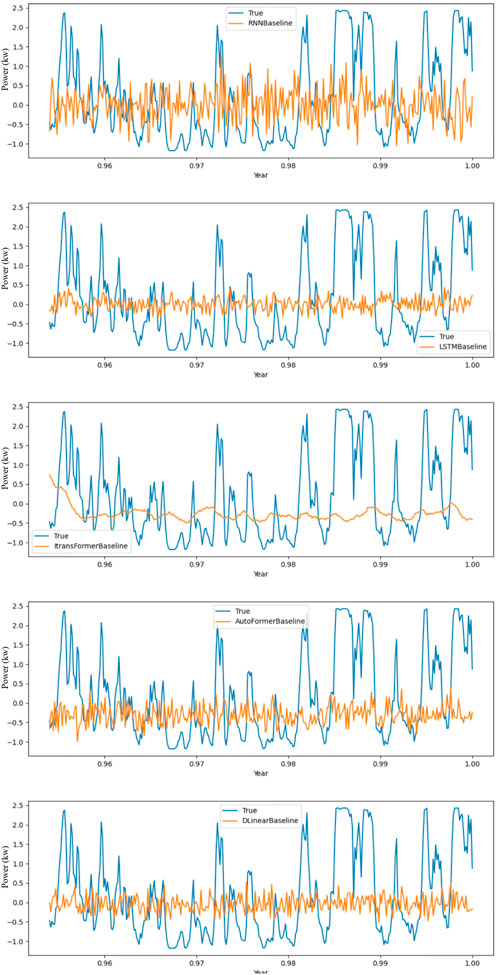
Expanding on this, as shown in Figure 4, the SINN model’s exceptional performance is attributed to its hybrid nature, which synergistically merges the sparse identification’s ability to capture underlying trends and seasonality with the CNN’s prowess in recognizing intricate spatial-temporal patterns. This amalgamation results in a model that not only excels in precision but also offers enhanced interpretability and adaptability to the nuances of renewable energy data. This disparity in performance suggests that the SINN model’s ability to capture complex, nonlinear relationships and long-term dependencies within the data is more pronounced than that of the traditional SI model, which may struggle to fully encapsulate the dynamic nature of renewable energy data.
By combining it with other core model objects, as shown in Figure 5, the experimental results unequivocally highlight the SINN model’s preeminence, setting a new benchmark for renewable energy forecasting. The model’s lower MSE, MAE, and MAPE signify its ability to closely align with actual energy generation values, translating to more reliable and actionable forecasts for stakeholders in the renewable energy sector.
4.4 Ensemble experiments
To further validate the applicability of the proposed hybrid model (SINN) across various prediction tasks, we designed a series of ensemble experiments that combine Sparse Identification (SI) with classical deep learning models such as LSTM, DLinear, and Autoformer. The core objective of these experiments is to investigate how the SI model, when used as an initial feature extraction module, complements other deep learning models, thereby improving overall predictive performance.
In these experiments, the SI model first performs sparsification of the input time series data, generating a sparse matrix
As shown in the table, all ensemble models demonstrated strong performance across the 96-step, 336-step, and 720-step prediction tasks. Overall, the SI-NN model exhibited the lowest mean squared error (MSE) and mean absolute error (MAE) in long-term prediction tasks, with its mean absolute percentage error (MAPE) also remaining at a lower level. This indicates that the SI-NN model is particularly accurate in handling long-term forecasts.
The SI-DLinear model performed notably well in short-term prediction tasks (96 steps), with its MSE and MAPE lower than those of other linear models, demonstrating its stronger adaptability to short-term local patterns. The SI-Autoformer model exhibited better generalization in handling high-dimensional time series data.
4.5 Analysis and discussion
To further validate the applicability of the proposed hybrid model (SINN) across various prediction tasks, we designed a series of ensemble experiments that combine Sparse Identification (SI) with classical deep learning models such as LSTM, DLinear, and Autoformer. The core objective of these experiments is to investigate how the SI model, when used as an initial feature extraction module, complements other deep learning models, thereby improving overall predictive performance.
4.5.1 Results analysis
Tables 1, 2 clearly show that the fusion model combining Sparse Identification (SI) with neural networks (SI-NN) outperforms both the standalone traditional SI model and other deep learning models (e.g., LSTM, iTransformer, Autoformer) in several metrics, such as MSE, MAE, and MAPE. This demonstrates the effectiveness of integrating these techniques for prediction tasks. As shown in Table 1, SI-NN consistently outperforms traditional SI and other deep learning models across metrics like MSE and MAE. SI-NN successfully combines the strengths of the SI module and neural networks, capturing both global and local features of wind power data. This integration proves particularly effective in long-term prediction tasks (e.g., 720-step predictions), where SI-NN exhibits stronger adaptability to complex time series data, accurately capturing fluctuations and trends. This fusion is key to SI-NN’s superior performance in handling non-stationary and stochastic wind power data. However, LSTM’s superiority in the MAPE metric raises a noteworthy point. LSTM outperforms SI-NN in MAPE, likely due to its ability to capture long-term dependencies more effectively, particularly in time-series data with strong temporal correlations. Moreover, MAPE is more sensitive to small actual values, which could result in higher values when small actual values but large errors occur. SI-NN relies on the sparse matrix
The shortcomings of iTransformer and Autoformer are also evident in the experimental results. As shown in Figure 5, these models fail to capture dynamic features in wind power data, particularly during periods of high-frequency fluctuation. While these models perform well with structured or stationary data, wind power data’s non-stationary and volatile nature causes them to underperform in MSE and MAPE metrics. Their predictive curves are overly smooth, suggesting underfitting when dealing with high-frequency variations in wind power data. While baseline models such as iTransformer and Autoformer handle temporal dependencies in a linear fashion, the SI layer in SINN pre-filters time series data to isolate primary temporal patterns, which are then refined by CNN for complex spatiotemporal dependencies. SI’s sparse processing enables effective global feature extraction, while DLinear excels in capturing local linear trends. Therefore, both LSTM and DLinear show limitations when dealing with complex nonlinear fluctuations.
When discussing the generalizability of the model, the Sparse Identification Fusion Neural Network (SINN) model is also highly renewable for other renewable energy sources, especially photovoltaic (PV) energy. PV generation data, like wind power, involves periodic and nonlinear characteristics influenced by meteorological factors, but it exhibits a more regular daily cycle driven by solar irradiance variations. The SI component in SINN can capture these recurring patterns efficiently, while the CNN component is effective at detecting long-term changes caused by fluctuations in irradiance, temperature, and cloud cover. To adapt SINN for PV forecasting, additional features such as solar irradiance, ambient temperature, and cloud cover can be integrated into the model, enhancing its ability to capture the unique influences in PV energy data. Further validation of SINN’s versatility in these different energy types through future experimental testing supports its potential as a general framework for renewable energy forecasting, not only for wind and solar but also potentially extending to hydropower and geothermal energy.
4.5.2 Waveform discussion
Figure 4 showcases SI-NN’s strength in capturing overall trends. The model’s predictive curve (red) closely follows actual data, particularly in stable regions. However, in areas with sharp fluctuations, SI-NN’s predictions appear somewhat smooth. This could be due to the neural network’s limited sensitivity to extreme fluctuations, leading to a delayed response in such regions. Figure 5 further highlights the deficiencies of iTransformer and Autoformer. Their predictive curves remain smooth and fail to capture sharp variations in wind power data, indicating an inability to adequately fit complex nonlinear features. This discrepancy is especially pronounced in high-frequency fluctuation regions, where their predictions diverge significantly from actual values, resulting in large errors. Although DLinear performs relatively well in capturing local linear trends, its accuracy diminishes when confronted with global nonlinear fluctuations. This indicates that while DLinear excels in short-term prediction, it struggles with longer time series data.
4.5.3 Fusion discussion
We integrated sparse identification (SI) with several classic deep learning models, including LSTM, DLinear, and Autoformer, to evaluate their adaptability and performance in different forecasting tasks. The experimental results demonstrate that all integrated models exhibit strong adaptability across 96-step, 336-step, and 720-step forecasting tasks. The SI-NN model excels in long-term forecasting, particularly in the 720-step task, achieving MSE of 0.95, MAE of 0.78, and MAPE of
5 Conclusion
In this paper, we have developed the Sparse Identification Fusion Neural Network (SINN), a hybrid model that integrates sparse identification and convolutional neural networks to improve long-term forecasting accuracy and interpretability in renewable energy prediction. Our results on wind power generation data show that SINN significantly reduces forecasting errors compared to traditional methods. This model not only advances renewable energy forecasting but also establishes a novel approach to combining deep learning and sparse identification techniques.
In summary, this work offers a new, effective tool for renewable energy prediction while paving the way for further research into integrating advanced machine learning techniques. Future directions include enhancing SINN’s generalization, optimizing the model’s structure, expanding its application in multi-task and ensemble learning, and improving its real-time forecasting capability and robustness to noisy data. The potential of SINN for broader applications across various domains will also be explored, contributing to the growth of intelligent, sustainable energy systems and the ongoing global energy transition.
Looking to the future, we aim to investigate ways to refine the SINN model for even greater scalability and adaptability, particularly in diverse renewable energy contexts such as solar and hydroelectric power forecasting. Moreover, efforts will be directed toward improving the interpretability of the model, making it more accessible for real-time decision-making in energy management systems. We also plan to explore SINN’s potential in integrating with advanced energy storage systems and smart grids, helping to optimize energy distribution and consumption, and ultimately supporting the global shift toward a more resilient and sustainable energy infrastructure.
Data availability statement
The raw data supporting the conclusions of this article will be made available by the authors, without undue reservation.
Author contributions
JH: Conceptualization, Data curation, Formal Analysis, Investigation, Methodology, Software, Validation, Visualization, Writing–original draft. TT: Data curation, Formal Analysis, Methodology, Resources, Software, Visualization, Writing–original draft. YW: Conceptualization, Investigation, Methodology, Writing–original draft. XL: Conceptualization, Data curation, Funding acquisition, Investigation, Project administration, Supervision, Writing–review and editing. MW: Conceptualization, Methodology, Software, Supervision, Writing–review and editing.
Funding
The author(s) declare that financial support was received for the research, authorship, and/or publication of this article. This work is supported by the National Natural Science Foundation of China under Grants No. 62203210, the Jiangsu Postdoctoral Science Foundation (2021K397C), the Natural Science Foundation of Jiangsu Province of China (BK20210929), and the Scientific Research Foundation for the introduction of talents of NJIT (YKJ202015).
Conflict of interest
Authors JH and TT were employed by State Grid Lianyungang Power Supply Company.
The remaining authors declare that the research was conducted in the absence of any commercial or financial relationships that could be construed as a potential conflict of interest.
Publisher’s note
All claims expressed in this article are solely those of the authors and do not necessarily represent those of their affiliated organizations, or those of the publisher, the editors and the reviewers. Any product that may be evaluated in this article, or claim that may be made by its manufacturer, is not guaranteed or endorsed by the publisher.
References
Box, G. E., Jenkins, G. M., Reinsel, G. C., and Ljung, G. M. (2015). Time series analysis: forecasting and control. John Wiley and Sons.
Chen, S. S., Donoho, D. L., and Saunders, M. A. (2001). Atomic decomposition by basis pursuit. SIAM Rev. 43, 129–159. doi:10.1137/s003614450037906x
Denholm, P., and Hand, M. (2011). Grid flexibility and storage required to achieve very high penetration of variable renewable electricity. Energy Policy 39, 1817–1830. doi:10.1016/j.enpol.2011.01.019
Hochreiter, S., and Schmidhuber, J. (1997). Long short-term memory. Neural Comput. 9, 1735–1780. doi:10.1162/neco.1997.9.8.1735
James, G., Witten, D., Hastie, T., Tibshirani, R., and Taylor, J. (2013) An introduction to statistical learning, 112. Springer.
Kang, M., Zhu, R., Chen, D., Li, C., Gu, W., Qian, X., et al. (2023). A cross-modal generative adversarial network for scenarios generation of renewable energy. IEEE Trans. Power Syst. 39, 2630–2640. doi:10.1109/tpwrs.2023.3277698
Kang, M., Zhu, R., Chen, D., Liu, X., and Yu, W. (2024). Cm-gan: a cross-modal generative adversarial network for imputing completely missing data in digital industry. IEEE Trans. Neural Netw. Learn. Syst. 35, 2917–2926. doi:10.1109/TNNLS.2023.3284666
LeCun, Y., Bengio, Y., and Hinton, G. (2015). Deep learning. nature 521, 436–444. doi:10.1038/nature14539
Liu, H., and Zhang, Z. (2022). A bi-party engaged modeling framework for renewable power predictions with privacy-preserving. IEEE Trans. Power Syst. 38, 5794–5805. doi:10.1109/tpwrs.2022.3224006
Liu, H., and Zhang, Z. (2024). Development and trending of deep learning methods for wind power predictions. Artif. Intell. Rev. 57, 112. doi:10.1007/s10462-024-10728-z
Liu, X., Chen, D., Wei, W., Zhu, X., and Yu, W. (2024a). “Interpretable sparse system identification: beyond recent deep learning techniques on time-series prediction,” in The twelfth international conference on learning representations.
Liu, X., Shao, Q., and Chen, D. (2024b). Long-term prediction on graph data with causal network construction. IEEE Trans. Artif. Intell. 5, 3445–3455. doi:10.1109/tai.2024.3351105
Pachauri, R. K., Allen, M. R., Barros, V. R., Broome, J., Cramer, W., Christ, R., et al. (2014). Climate change 2014: synthesis report. Contribution of Working Groups I, II and III to the fifth assessment report of the. Copenhagen, Denmark: Intergovernmental Panel on Climate Change Ipcc.
Tibshirani, R. (1996). Regression shrinkage and selection via the lasso. J. R. Stat. Soc. Ser. B Stat. Methodol. 58, 267–288. doi:10.1111/j.2517-6161.1996.tb02080.x
Wei, M., Yang, J., Zhao, Z., Zhang, X., Li, J., and Deng, Z. (2024). Defedhdp: fully decentralized online federated learning for heart disease prediction in computational health systems. IEEE Trans. Comput. Soc. Syst. 11, 6854–6867. doi:10.1109/tcss.2024.3406528
Wu, H., Xu, J., Wang, J., and Long, M. (2021). Autoformer: decomposition transformers with auto-correlation for long-term series forecasting. Adv. neural Inf. Process. Syst. 34, 22419–22430.
Zeng, A., Chen, M., Zhang, L., and Xu, Q. (2023). Are transformers effective for time series forecasting? Proc. AAAI Conf. Artif. Intell. 37, 11121–11128. doi:10.1609/aaai.v37i9.26317
Zhang, Y., Kong, X., Wang, J., Wang, H., and Cheng, X. (2024). Wind power forecasting system with data enhancement and algorithm improvement. Renew. Sustain. Energy Rev. 196, 114349. doi:10.1016/j.rser.2024.114349
Keywords: time series forecasting, long-term prediction, sparse identification, convolutional neural networks, renewable energy
Citation: He J, Tian T, Wu Y, Liu X and Wei M (2024) A hybrid sparse identification and convolutional neural network framework for renewable energy forecasting. Front. Energy Res. 12:1461410. doi: 10.3389/fenrg.2024.1461410
Received: 08 July 2024; Accepted: 15 November 2024;
Published: 19 December 2024.
Edited by:
Zijun Zhang, City University of Hong Kong, Hong Kong SAR, ChinaReviewed by:
Hong Liu, City University of Hong Kong, Hong Kong SAR, ChinaPengxiang Liu, City University of Hong Kong, Hong Kong SAR, China
Copyright © 2024 He, Tian, Wu, Liu and Wei. This is an open-access article distributed under the terms of the Creative Commons Attribution License (CC BY). The use, distribution or reproduction in other forums is permitted, provided the original author(s) and the copyright owner(s) are credited and that the original publication in this journal is cited, in accordance with accepted academic practice. No use, distribution or reproduction is permitted which does not comply with these terms.
*Correspondence: Xiaolu Liu, ZW1zcGNAMTI2LmNvbQ==; Mengli Wei, d2VpbWx5QHFxLmNvbQ==
 Junchi He1,2
 Xiaolu Liu
 Mengli Wei