- Department of Electrical Engineering, University of National Cheng-Kung (NCKU), Tainan, Taiwan
Photovoltaic (PV) systems offer cost-effective power solutions for outlying islands but often compromise system stability due to reduced inertia. This study introduces a Virtual Synchronous Generator (VSG) control strategy, integrated with Energy Storage Systems (ESS) and PV, to enhance system inertia. By optimizing coordination between these energy sources, the proposed method mitigates oscillations and improves grid stability. However, PV-VSG systems are generally not favored by energy providers due to the requirement for pre-curtailment of power output. To address this, the paper proposes a parameter design method for VSG control of ESS and PV, utilizing multi-objective genetic algorithm (MOGA) optimization to simultaneously increase the frequency nadir and minimize the settling time after disturbances. Additionally, an adaptive curtailment decision and parameter design method based on artificial neural networks is introduced to enhance the feasibility of PV-VSG systems by reducing PV pre-curtailment and prioritizing PV power release and ESS charging during frequency oscillations. Real data from the Penghu Archipelago in Taiwan are used to build a dynamic model in DIgSILENT, enabling interaction with MOGA. The Value at Risk (VaR) method with dual stochastic variables is employed to assess the allowable PV installed capacity. The results show that when VaR is set at 1%, the proposed PV-VSG method can increase PV penetration by 57.5% compared to scenarios without VSG. Furthermore, compared to traditional PV-VSG methods, the proposed approach achieves a 16.8% increase in PV penetration and reduces annual PV curtailment by 25 MWh. This study also evaluates the economic impact of planners choosing different risk levels, offering valuable insights for grid development in remote or island regions.
1 Introduction
In recent years, heightened awareness of the greenhouse effect’s environmental impact has prompted global governments to prioritize carbon reduction policies. Renewable energy (RE) is a leading solution for reducing carbon emissions due to technological advancements and cost reductions.
Installing green energy is not solely about emissions reduction but is increasingly seen as a feasible investment. For instance, outlying islands heavily reliant on diesel generators (DG) for power face high supply costs due to resource transportation. Consequently, many countries aim to install RE on outlying islands to reduce the cost of electricity supply.
However, integrating RE into an island microgrid, characterized by low inertia, can make the power system more susceptible to sudden disturbances, leading to power outages. RE sources like photovoltaic (PV) and wind power are typically inverter-based resources (IBRs), lacking the inertia and damping properties of traditional synchronous generators (SG). In island power grids with inherently low inertia, high penetration of RE may result in more frequent power outages.
Therefore, it is important to enhance the reliability of island power grids to accommodate more RE. Currently, the most common practice is to install energy storage systems (ESS) (Sun et al., 2020; Joung et al., 2019). In isolated microgrids, due to unstable communication lines, frequency and voltage droop control (Liu et al., 2020; Ullah et al., 2021; Sivaranjani et al., 2021; Bijaieh et al., 2020) is often preferred for parallel inverter coordination. However, droop control is typically non-inertial and sensitive to faults (Liu et al., 2017), making it challenging to provide inertial support to microgrids.
Recent studies have focused on virtual synchronous generator (VSG) control to provide IBRs with inertia that mimics (Fawzy et al., 2021; Xu et al., 2020; Xu et al., 2021). VSGs differ from traditional SGs by allowing adaptable virtual inertia and damping coefficients, optimizing microgrid operations. While energy storage system (ESS) are vital for suppressing system oscillations, their high installation costs limit development. Integrating inexpensive green energy through ESS can reduce overall cost-effectiveness.
To address this, recent studies have proposed PV-VSG systems that integrate VSG control into PV systems (Li Z. et al., 2021; Sonawane and Umarikar, 2022a; Wang et al., 2022; Sonawane and Umarikar, 2022b). PV-VSG systems emulate SG behavior, provide system inertia and mitigate the rate of change of frequency (RoCoF). However, conventional PV operates at the maximum power point (MPP) to maximize investment returns, which conflicts with the objectives of PV-VSG control.
To provide virtual inertia, a typical PV-VSG system can reduce power output to support frequency during sudden increases, but it cannot increase output to stabilize frequency dips. As a result, PV power must be pre-curtailed for upward regulation (Li X. et al., 2021; Sonawane and Umarikar, 2022a; Wang et al., 2022; Sonawane and Umarikar, 2022b), diverging from MPP operation. This inevitably results in some solar energy wastage and impacts the return on investment for PV owners.
Currently, there is limited research on determining appropriate pre-curtailment levels, which are crucial for maximizing investment returns in the PV industry. Consequently, this factor significantly impacts the widespread adoption of PV-VSG. In (Hasabelrasul et al., 2022), an independent power supply system integrating PV and ESS was proposed. This system achieves VSG functionality without the need for pre-curtailment, although its regulatory capability remains constrained by ESS capacity.
Another approach (Liu et al., 2023) integrates a supercapacitor (SC) with PV for VSG control. This method optimizes PV curtailment to manage SC charging and discharging, while considering the energy costs associated with SC investments and PV curtailment. However, practical operational optimization does not sufficiently account for the randomness of oscillation events.
Reference (Zhang et al., 2021) proposed an H-bridge converter for PV-VSG, segregating reserved and non-reserved cells to achieve VSG functionality without additional storage. Pre-curtailment levels are often set between 10% and 20% (Liu et al., 2022). Related studies have specified PV-VSG curtailment at 10% (Hua et al., 2017; Zhang et al., 2020) and 20% (Zhong et al., 2022; Tarraso et al., 2017) primarily based on empirical knowledge rather than comprehensive considerations.
Multiple VSGs operating in parallel can potentially induce oscillations (Qu and Wang., 2021). Therefore, selecting appropriate parameters for VSG-controlled hybrid energy systems is critical. In (Chen et al., 2023), Lyapunov’s method was employed to determine feasible parameters ensuring transient stability and compliance with RoCoF. However, this study primarily focused on a single VSG unit and neglected the mutual influence of multiple interconnected power sources within a microgrid.
Reference (Pournazarian et al., 2021; Pournazarian et al., 2022) present small-signal stability analysis for islanded microgrids. It defines VSG parameter ranges and utilizes particle swarm optimization to optimize these parameters while considering stability, reactive power, and frequency nadir. However, combining multiple objectives into a single objective poses challenges in determining appropriate weighting factors. Current studies also lack methods that simultaneously consider parameter design for both ESS-VSG and PV-VSG systems.
Based on the above discussion, it is evident that existing PV-VSG technologies face challenges such as control stability, solar energy wastage, and a lack of economic feasibility analysis. To address these issues, this paper proposes a methodology for designing control parameter and evaluates the economic benefits of implementing PV-VSG technology in islanded power systems. The primary contributions of this paper are as follows:
• This paper proposes an optimal parameter design method for ESS-VSG and PV-VSG. The selection process utilizes a multi-objective genetic algorithm (MOGA) optimization to simultaneously improve the frequency nadir and minimize the settling time following disturbance. Additionally, a dynamic model built in DIgSILENT ensures that the chosen parameters effectively coordinate with PV and ESS to mitigate abnormal oscillations.
• By designing control deadband, the hybrid PV-ESS system can prioritize PV power release and ESS charging during frequency oscillations, thereby improving energy efficiency.
• The paper identifies the level of pre-curtailment in PV-VSG as a critical factor affecting economic benefits. A two-stage artificial neural network (ANN)-based adaptive curtailment decision (ACD) is proposed to predict the necessary amount of PV curtailment. This approach aims to minimize solar energy wastage and enhance profitability.
• A risk management approach using Value at Risk (VaR) (Shen et al., 2020) with dual stochastic variables is employed to assess the permissible PV installed capacity in islanded systems. This method ensures that, at a defined confidence level, fluctuations in load and PV power do not result in the frequency nadir dropping below acceptable limits.
• This study utilizes engineering economic theory to evaluate the economic advantages of PV-VSG systems. It contrasts the cost implications of implementing PV-VSG versus conventional approaches, considering various risk levels and pre-curtailment strategies. The results offer practical insights for planners managing isolated microgrids.
The remainder of this paper is organized as follows. Section 2 introduces VSG control and multi-objective parameter optimization model. The detailed PV-VSG ACD model is presented in Section 3. The simulation and computation results are illustrated in Section 4. Finally, Section 5 concludes the paper.
2 VSG control and multi-objective parameters optimization
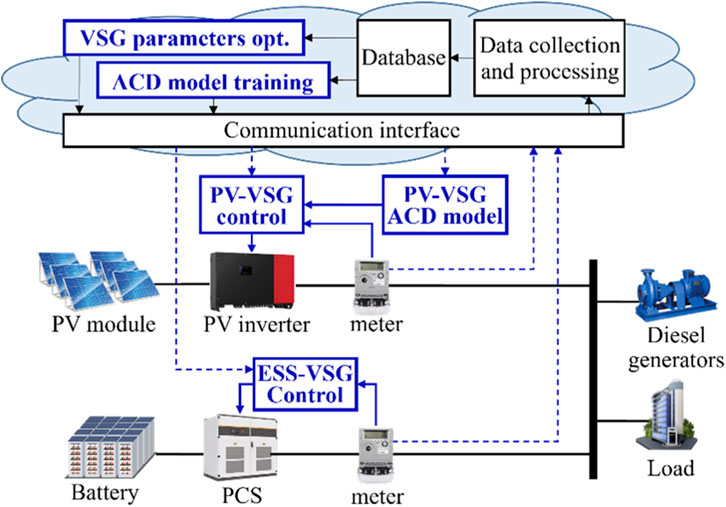
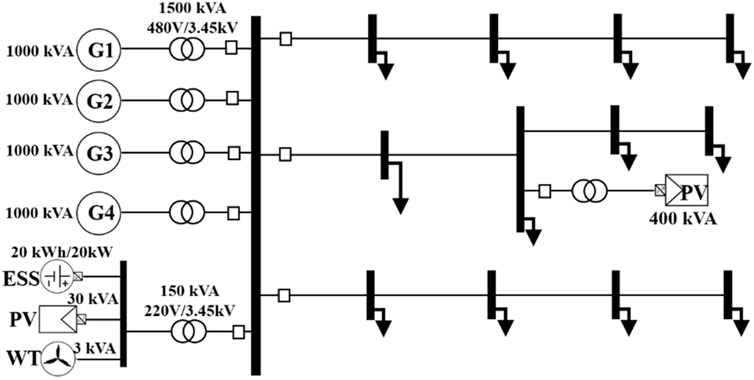
The system considered in this study is an island power grid with high RE penetration, including various electricity loads, DG, PVs, and ESS, as depicted in Figure 1. One of the main challenges in such grids is managing unexpected frequency fluctuations, which can destabilize the system. To mitigate unexpected frequency fluctuations, VSG technology is incorporated into ESS and PV systems. VSG technology is designed to mimic the inertia of traditional synchronous generators, thereby improving the system’s stability by increasing its inertia.
To enhance the system’s frequency response, a multi-objective optimization method is applied. This method determines the optimal VSG control parameters for both ESS and PV systems. However, using PV with VSG requires intentional power curtailment. This means that PV does not operate at MPP. Instead, its output is reduced to help stabilize the grid during sudden frequency drops, thereby exhibiting characteristics of virtual inertia.
The disadvantage of PV-VSG is the financial loss for solar energy providers due to the intentional power curtailment. To mitigate these losses, this study proposes an ACD method. The ACD method calculates the optimal generation reserve levels in real-time, aiming to minimize financial losses while maintaining stable frequency oscillations. The details of this method are discussed further in Section 3.
2.1 Multi-objective optimization
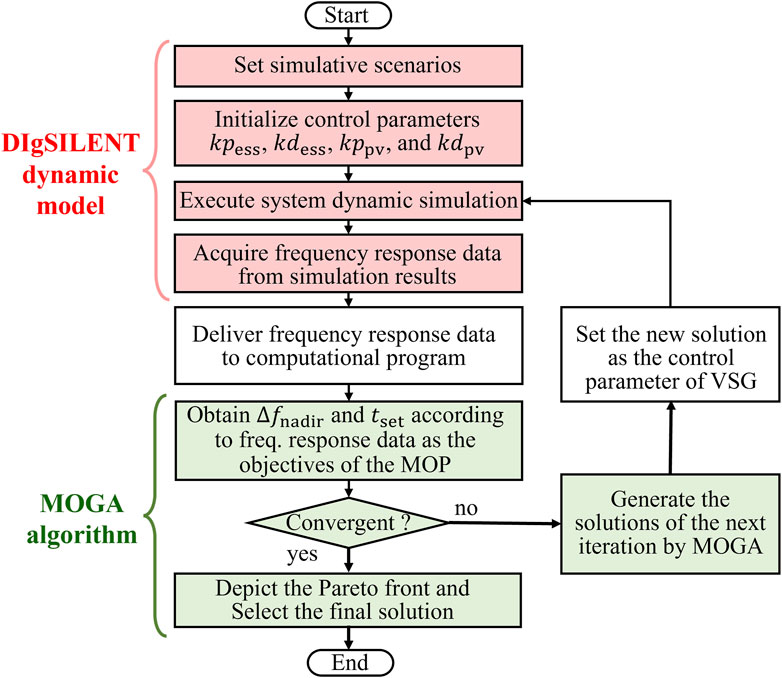
The proposed process for optimizing VSG control parameters is illustrated in Figure 2. This optimization problem is not only a multi-objective problem (MOP) but also requires the use of the power simulation tool DIgSILENT for its solution. DIgSILENT is used to simulate the system frequency after applying VSG control, while the VSG control parameters are obtained through optimization.
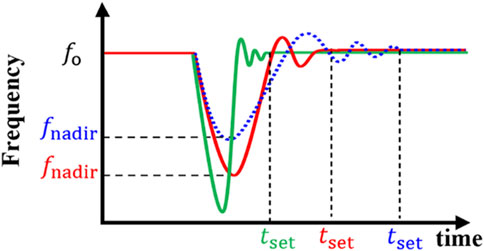
The objective of optimizing ESS-VSG and PV-VSG control is to reduce system frequency oscillations. The effectiveness of this control can be evaluated by the degree of frequency oscillations under conditions of instantaneous power imbalance. Typically, the focus is on both the amplitude and duration of frequency oscillation, namely maximal frequency deviation,
Reducing
MOGA is an optimization technique designed to simultaneously optimize multiple conflicting objectives. It leverages principles of natural selection and genetics to explore a wide solution space, generating a diverse set of potential solutions. MOGA evaluates the fitness of each solution based on the defined objectives, iterating until the algorithm converges to a set of optimal solutions known as the Pareto front, which represents the best trade-offs between objectives.
In the proposed VSG control, a proportional–integral–derivative (PID) control method is used to reduce system frequency oscillations. Since system frequency is a continuous signal, PID control method is widely applied in industrial control systems and other applications requiring continuous modulation control. PID controller continuously calculates an error value (
However, this study focuses on addressing short-term frequency oscillations through VSG regulation, without emphasizing long-term frequency error. Therefore, the proposed VSG control method uses only Proportional-Derivative (PD) control, where
In view of this, the effectiveness of the proposed control can be evaluated through the frequency response curve under system instantaneous power imbalance. The MOGA objective function optimizes the two evaluation factors,
The decision variables of the MOGA are VSG control parameters for both ESS-VSG and PV-VSG, which are
First, the system to be controlled is established using the power simulation software DIgSILENT. This includes not only system topology and power equipment but also the implementation of VSG control strategies for both PV and ESS. During each iteration, the solutions for the control parameters
After DIgSILENT simulation, the frequency response results, recorded every 0.01 s, are fed into MOGA. MOGA subsequently calculates
Consequently, MOGA objective function is reformulated as shown in Equation 5. If any condition in (4) is met, indicating system instability, the constraint violation indicator,
Finally, MOGA searches for better control parameters based on DIgSILENT simulation results through multiple iterations, continuing until the iteration limit is reached. The Pareto front generated by the optimization model allows operators to select the appropriate control parameters according to system requirements.
2.2 Dynamic modeling
In the power grid, combining inertial effects from the rotor and governor, along with damping effects from the demand, mitigates frequency fluctuations. The swing Equation 7 exemplifies the frequency variations during power disturbances in an equivalent single-machine system (Meng et al., 2021).
where
A power system is a complex nonlinear dynamic system comprising multiple SGs and IBRs. Figure 4 shows the considered structure in this paper, where IBRs include PV and ESS. The SGs and IBRs are connected to the point of common coupling through transmission line resistance (R) and inductance (L).
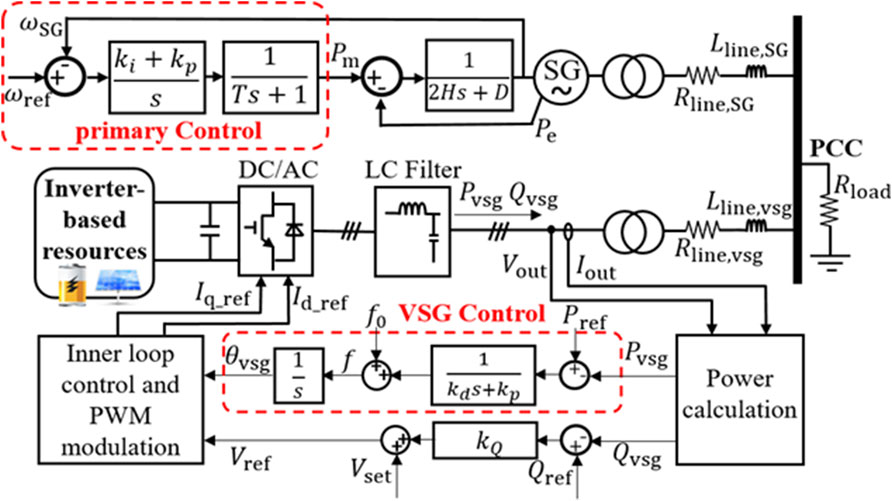
Figure 4. Power system control model (Li Z. et al., 2021).
VSG-based converters enable IBRs to regulate the frequency by adjusting their output power during disturbances (Barać et al., 2021). Unlike SGs, VSG parameters are not machine-defined and can be adapted during operation. However, these parameters must meet design constraints to ensure converter stability and proper dynamic performance (Li Z. et al., 2021).
2.2.1 Synchronous generator
The inertia for a traditional generator is mainly based on Equation 8 and the frequency response under power disturbance can be obtained as Equation 9 (Barać et al., 2021).
where
In addition, the line impedance and load characteristics in power grid also affect the frequency response. Therefore, dynamic model of the entire islanded grid is constructed in DIgSILENT to simulate more realistic frequency responses.
2.2.2 VSG control of energy storage system (ESS-VSG)
The ESS actively regulates system frequency through charge/discharge actions, adhering to equipment specifications such as energy and capacity constraints, losses, and time delays. This study incorporates the characteristics of these actual devices into the ESS model in DIgSILENT (Alhejaj and Gonzalez-Longatt, 2016).
The system frequency (
In addition to optimizing the control parameters of ESS-VSG, this study also incorporates the design of a deadband to prevent system oscillations. VSG control is applied not only to ESS but also to PV systems. When the system frequency rises abruptly, the strategy prioritizes charging ESS rather than reducing PV generation. This objective is achieved by designing different upper and lower bounds for frequency dead zones,
The practical impact of frequency deviation on power output is described in Equation 12 and Equation 13.
2.2.3 VSG control of photovoltaic system (PV-VSG)
Both PV and ESS operate as IBRs, thus their control concepts are fundamentally similar. The dynamic models of these devices are established based on the PV model of DIgSILENT (Marinopoulos et al., 2011). The main distinction in P-f control loop between PV and ESS lies in PV-VSG requiring pre-curtailment,
Similarly, during frequency fluctuations, adjusting PV output power using virtual inertia
According to the deadband design, slight increases in frequency are initially managed by ESS. However, significant frequency increases may require curtailing PV output. Therefore, the upper bound of the PV-VSG deadband
As mentioned above, the reference value of PV power output is reduced by pre-curtailment,
3 PV-VSG adaptive curtailment decision method
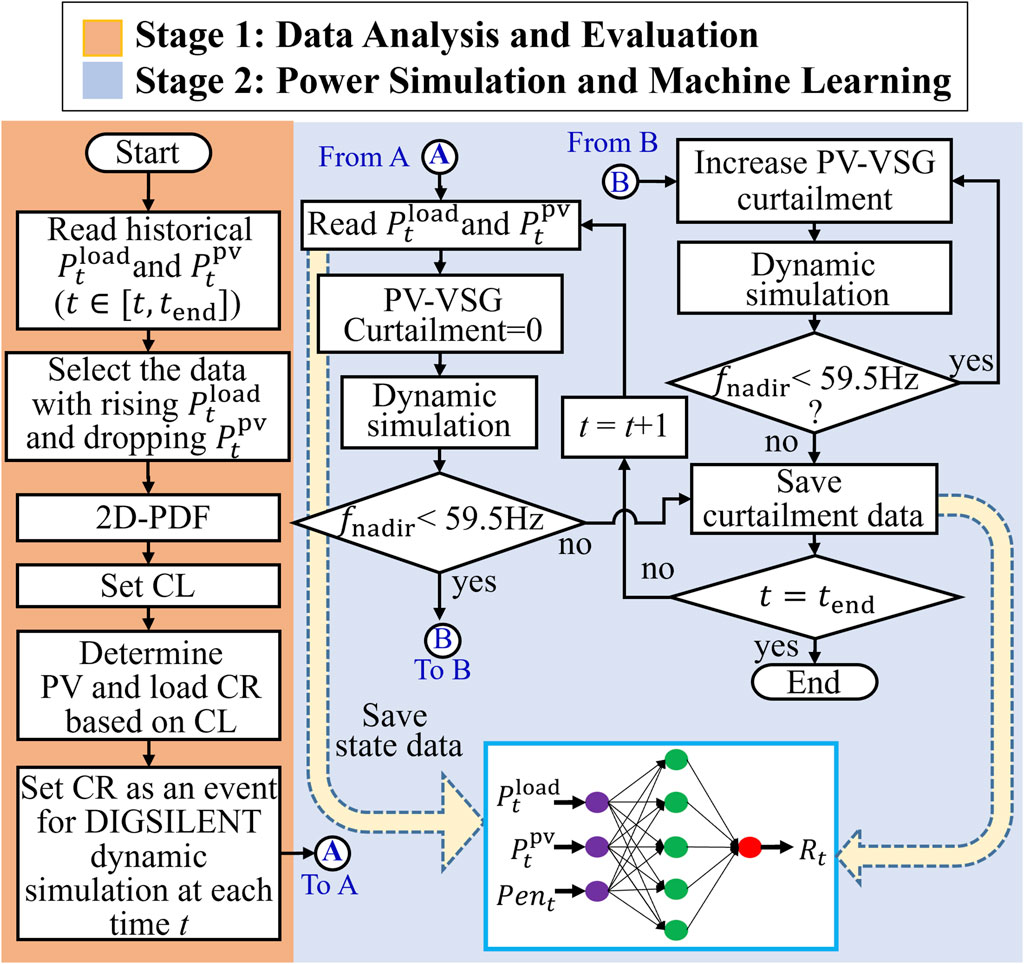
During frequency drop events, PV-VSG supports frequency stability but requires additional energy, which may affect the interests of PV operators. This paper introduces a two-stage ANN-based ACD method for PV-VSG. The proposed ACD model aims at minimizing power curtailment and reducing frequency oscillations, as shown in Figure 5.
In the first stage, the power change rate (CR) of the system is analyzed using historical data. Since power fluctuations can cause frequency instability, PV-VSG is required to stabilize the system. Once the CR is determined, the process moves to the second stage, where the amount of mitigation required by PV-VSG is determined by the frequency oscillations caused by the CR of both the PV system and the load.
3.1 Data analysis and evaluation
Rapid fluctuations in PV generation can trigger frequency oscillations in low-inertia island power systems. The VaR method evaluates these risks based on event probabilities and specific confidence levels (CL). By using historical data to model probability distributions, VaR effectively assesses short-term PV fluctuation risks and system responses at specific locations.
For instance, Figure 6A depicts the probability density function (PDF) and cumulative distribution function (CDF) illustrating PV power CR, refer to Equation 19. When PV generation abruptly increases, PV-VSG controller can easily reduce PV power output without prior reservation. Therefore, higher negative variations in PV power changes are considered riskier, with larger negative changes indicating higher risk levels.

Figure 6. (A) Schematic diagram of VaR on PV power variation with 90% confidence level (B) The probability distribution of load and PV generation variation.
In addition to PV power fluctuations, variations in load also influence frequency dynamics. Therefore, the VaR method should analyze two-dimensional PDF for both PV and load CR, as illustrated in Equation 20. Figure 6B presents the two-dimensional PDF of the system under consideration. Although PV power variations can reach up to 50%, their occurrence probability is exceedingly low.
In the first stage of the proposed ACD model, a 2D PDF of the system is analyzed based on historical load demand and PV generation data. The operator then determines a CL for system stability. Based on the specified CL, CR for both the load and PV are derived, representing the expected maximum CR.
Figure 6A provides an example where the operator sets the CL at 90%. This means there is a 90% probability that PV’s CR will be less than the PV change rate corresponding to the 90% CDF. In other words, the proposed method regulates PV-VSG frequency based on the worst-case scenario within the 90% probability range. The larger the CR, the more conservative the evaluator is, resulting in a greater amount of power curtailment required by PV-VSG.
Finally, the CRs of the load and PV derived from the data analysis are set as dynamic simulation events in DIgSILENT. These dynamic simulation events are repeatedly simulated in the second stage to verify system stability.
3.2 Power simulation and machine learning
In the second stage, historical data is combined with DIgSILENT simulations to train a feedforward multilayer neural network (NN). First, ACD model imports historical PV generation and load consumption data sequentially, using each demand, PV generation, and the current RE penetration rate as input data for NN. Then, a dynamic simulation is performed in DIgSILENT without curtailing PV generation. The power disturbance in the dynamic simulation corresponds to the PV and load CR analyzed in the first stage.
During the simulation, the frequency nadir is examined to determine whether it drops below 59.5 Hz, which would trigger under-frequency load shedding (UFLS). If the system frequency does not trigger UFLS without the assistance of PV-VSG, a 0% PV curtailment is recorded as the NN’s output data. However, if frequency nadir drops below 59.5 Hz, PV generation is curtailed by 0.1%, and the dynamic simulation is rerun.
The PV curtailment rate is gradually increased until frequency nadir rises above 59.5 Hz. This total PV curtailment rate represents the minimum curtailment amount necessary for PV-VSG to support the frequency and prevent UFLS. This curtailment amount is also recorded as the NN’s output data.
The proposed ACD model applies the above steps to historical data from time t to tend, using the results as a training set for the NN. This allows NN to learn the complex relationship between the inputs and the desired pre-curtailment output. The NN comprised input, output, and hidden layers with five neurons. Inputs from the preceding layer are adjusted using weights and biases before being processed by each neuron. Input signals were weighted and summed to produce the output neuron Equation 21.
where f is the activation function; Wji is the connection weight; Xi and bj are the input and deviation values, respectively.
The NN is trained using years of historical datasets, demonstrating its capability to generalize and predict outcomes similar to those observed in the training data. Training is facilitated by the Levenberg-Marquardt algorithm, chosen for its effectiveness in optimizing neural network parameters. The number of hidden layers is determined empirically based on the model’s performance during training and validation phases.
4 Simulation result
4.1 System parameters
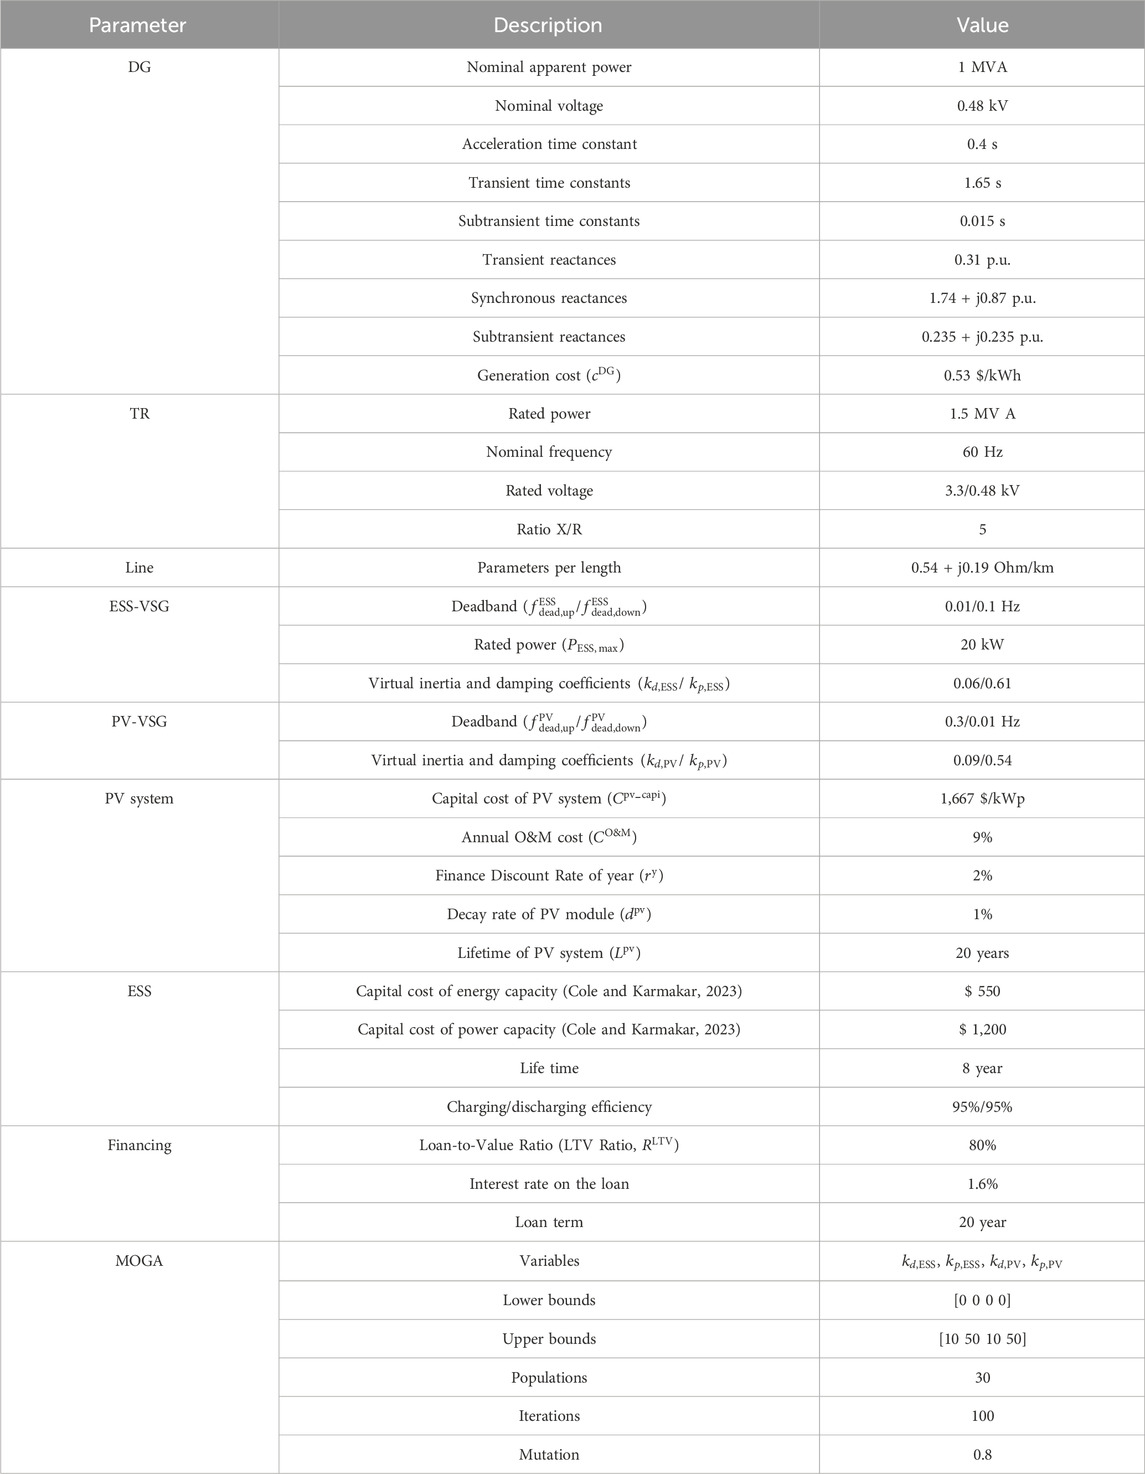
The proposed method is validated for practical feasibility through simulations on Wang-An Island in the Penghu Archipelago, Taiwan. The power system and equipment of Wang-An Island were modeled using DIgSILENT. Figure 7 illustrates the island grid topology with three feeders, primarily powered by four 1 MW DGs. Due to the high cost of power generation, the power company plans to invest in a 400 kWp PV and a 20 kW ESS, as detailed in Table 1.
The actual load and PV generation data from Wang-An Island were used as inputs for the ACD model. This data consists of real historical records taken every 15 min over the years 2018 and 2019. Simulation scenarios were set based on this historical data to perform dynamic simulation under VSG control. Moreover, the analysis results using historical data from Wang-An Island are shown in Figure 6.
Island loads consist mainly of residential and small-scale economic activities, varying from approximately 400 kW to 1,200 kW. On the island, due to high transportation costs, DG generation cost is about $0.53 per kWh. This study further conducts an economic feasibility analysis of the proposed method based on the generation costs on the island.
4.2 PV-VSG dynamic simulation
Integrating VSG with IBR enhances inertia and helps mitigate frequency fluctuations. However, using uncoordinated VSG parameters in hybrid energy systems with multiple power sources can lead to oscillations. Figure 8 illustrates the simulation results of optimized ESS-VSG and PV-VSG parameters when operated individually or simultaneously.
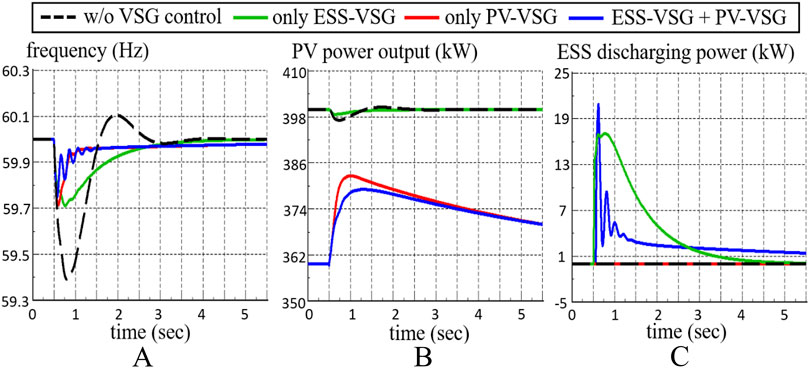
Figure 8. Uncoordinated VSG parameters in hybrid energy systems: (A) frequency (B) PV power output (C) ESS discharging power.
In the event of a sudden load increase, the frequency without VSG experiences a sharp drop, reaching a nadir around 59.4 Hz. Using only ESS-VSG with optimal parameters (green line) significantly improves frequency dip. Conversely, employing only PV-VSG with optimal parameters (red line) initially curtails PV power. When the frequency drops suddenly, PV immediately releases the reserved power to support frequency.
In this scenario, both PV-VSG and ESS-VSG with individually optimized parameters enhance frequency response. However, when ESS-VSG and PV-VSG with their respective optimal parameters are operated together, as shown by the blue line, oscillations occur. This demonstrates the necessity for coordinated VSG control parameters in hybrid energy systems to maintain stability.
The effectiveness of PV-VSG control is validated using two dynamic simulations with different levels of sudden load variations. The event of scenario 1 is a load change of 80 kW, while scenario 2 is a load change of 40 kW, as shown in Figures 9A, B. During the simulation, ESS consistently operated in ESS-VSG mode to compare the impacts with and without PV-VSG control.
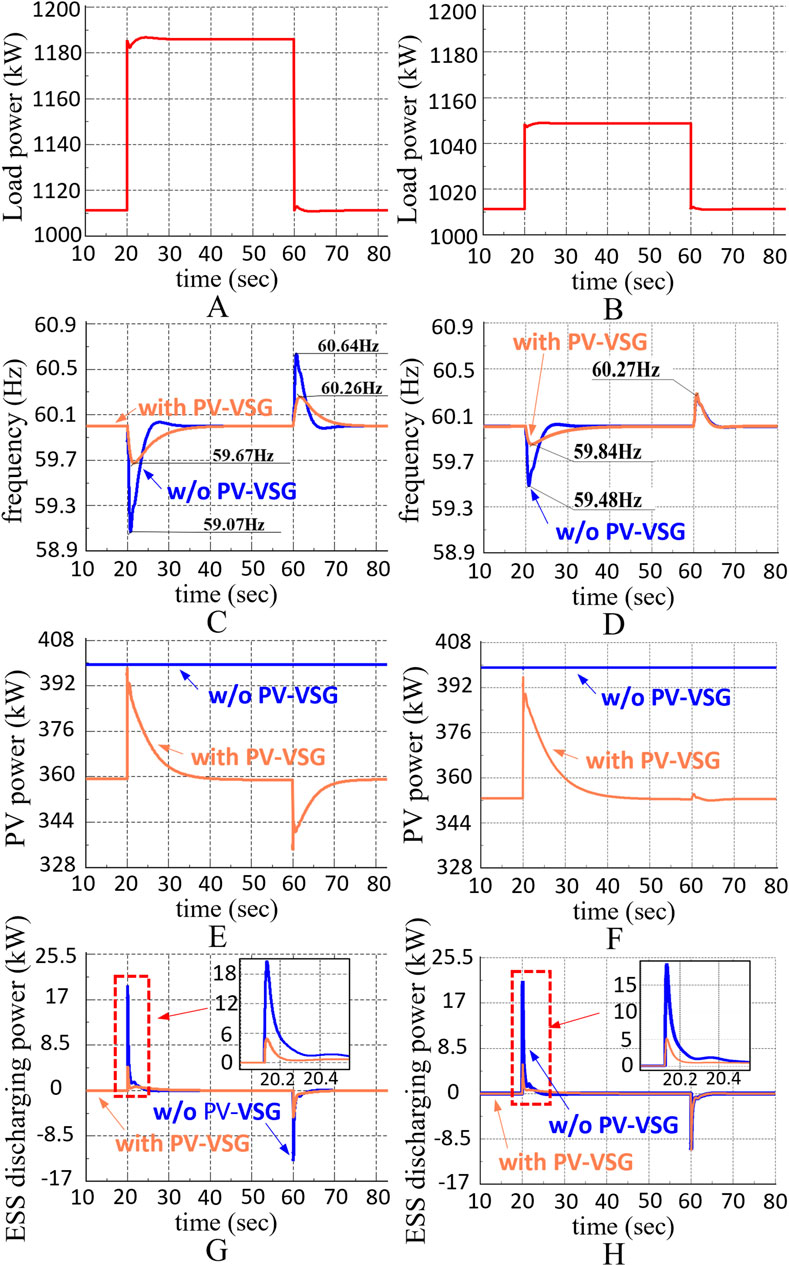
Figure 9. The PV-VSG dynamic simulation results, including (A, B) load power, (C, D) PV power, (E, F) frequency, and (G, H) ESS discharging power under scenarios 1 and 2.
Figures 9C, D show the frequency simulation results for scenarios 1 and 2, respectively. The results demonstrate that with PV-VSG, frequency fluctuations are effectively suppressed, with a maximum improvement of 69% in frequency variation. However, in Scenario 2, where the load drops by 40 kW, PV-VSG has no noticeable effect, as shown in Figure 9D. This is because the upward dead band of PV-VSG (
Figures 9E, F illustrate that the pre-curtailed power for PV-VSG is set to 40 kW. Therefore, when PV-VSG control is activated, the power output decreased from MPP to 360 kW. In both scenarios, when the frequency suddenly drops, the pre-curtailed PV energy is immediately released, providing frequency support. When the frequency increases, PV generation is reduced by 17 kW to suppress the frequency in Scenario 1. However, in scenario 2, since the system frequency lower than 60.3 Hz, PV does not respond to the frequency.
Due to the different dead band settings for ESS-VSG and PV-VSG, their power outputs show different sensitivities to frequency. As shown in Figures 9G, H, when the frequency suddenly drops and additional power support is needed, PV immediately releases the pre-curtailed energy, thereby reducing ESS discharge power.
Conversely, during a frequency increase, the required power is mainly provided by charging ESS rather than reducing PV output, as shown in Figure 9H. This design improves energy efficiency and minimizes ESS charging and discharging losses. However, this phenomenon is only evident when each type of power source effectively suppresses frequency fluctuations. If the frequency deviation exceeds the dead band, PV curtailment and ESS discharge will still be triggered, as shown in Figure 9G.
4.3 Performance of the proposed ACD model
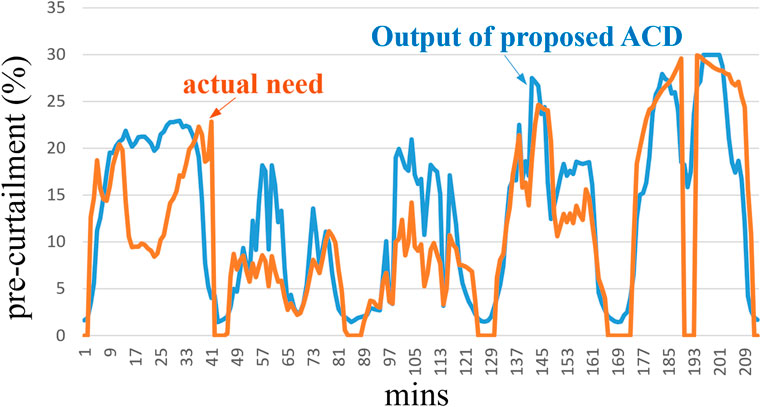
Although PV-VSG can effectively suppress frequency oscillations, it often leads to solar energy wastage. To enhance the utilization of solar energy, this study proposes an ACD model to predict the appropriate pre-curtailment amount. Figure 10 compares the output of ACD model with the actual demand obtained using the aforementioned analysis methods.
The simulation results indicate that the ACD model accurately determines an appropriate reservation amount based on environmental conditions over the tested 5 days. The root mean square error (RMSE) and mean absolute error (MAE), as defended in Equation 22 and Equation 23 (Zhang et al., 2023). For the prediction errors are 1.34% and 0.93%, respectively.
To ensure stable system operation, it is preferable for the ACD output to slightly exceed the actual demand. There may be instances of insufficient reservations during certain periods. However, the ACD calculates curtailment based on the maximum rate of change (key-CR) occurring at a specific confidence level. Therefore, within a manageable risk range, the reserved power determined by ACD ensures that PV-VSG effectively suppresses frequency oscillations while minimizing solar resource wastage.
The pre-curtailment strategy directly impacts the feasibility of the PV-VSG. Excessive curtailment may lead to suboptimal performance, while insufficient curtailment could limit PV hosting capacity due to stability concerns, ultimately affecting power supply cost. As an example from the aforementioned simulation case, Figure 11 illustrates the impact of different pre-curtailment methods on frequency and PV power output.

Figure 11. Numerical simulation results of the different pre-curtailment method (A) frequency (B) PV power output.
As observed from the figure, without the PV-VSG, the PV operates at MPP. During a sudden increase in net load, the PV output not only fails to maintain its power level but also slightly decreases, potentially leading to more severe frequency fluctuations. With the traditional fixed 20% curtailment method, the frequency nadir following the disturbance is relatively high due to the sufficient reserved energy available for frequency support. However, the excessive curtailment adversely affects cost-effectiveness.
With the traditional fixed 10% curtailment method, the energy wastage is halved, but the frequency nadir following the disturbance falls below the permissible lower frequency limit of 59.5 Hz. This highlights the challenge for operators in accurately predicting the required power curtailment for PV-VSG reserve. Utilizing the proposed ACD model, it is determined that the optimal curtailment for this scenario should be 12.5%. This adjustment raises the frequency nadir to 59.54 Hz, which is just above the lower frequency limit, indicating that the curtailment is sufficient without excessive energy waste.
4.4 Optimal VSG parameters
This study employs MOGA to determine the optimal control parameters for a dual-objective function. The parameters used by MOGA are detailed in Table 1. The final Pareto front of all non-dominated solutions is shown in Figure 12A. The frequency response results under the control parameters of the best and compromise solutions for each objective are compared in Figure 12B. The responses correspond to the minimum
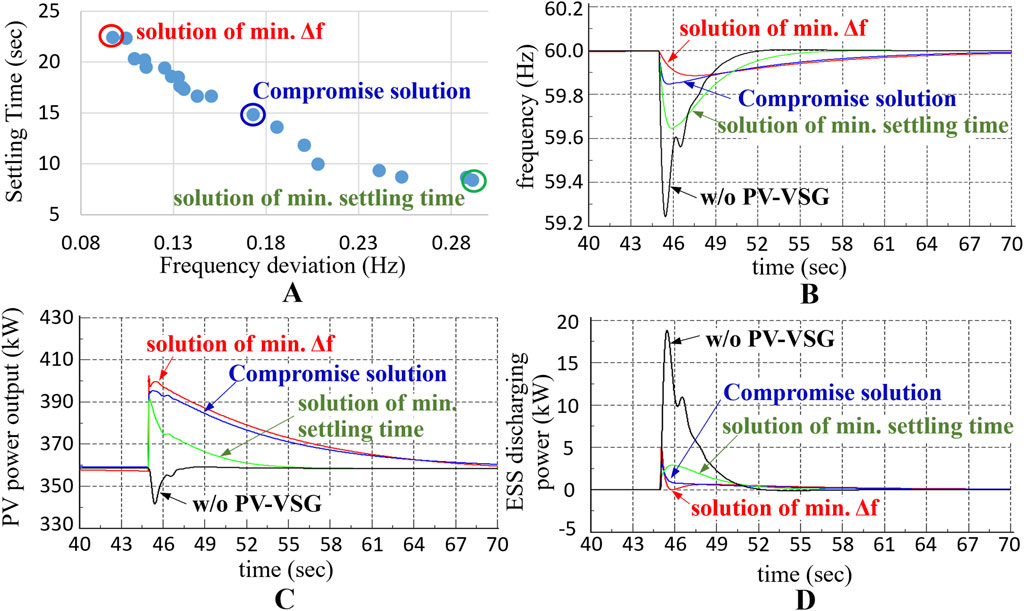
Figure 12. Results of optimal parameters searching (A) Pareto front (B) frequency (C) PV power output (D) ESS power output of different solutions.
From Figure 12B, it can be observed that the red frequency curve achieves the smallest
Figures 12C, D show the active power responses of PV and ESS under different control parameters. It is noteworthy that when PV without VSG control, PV output decreases instantly during the system frequency drop, as shown by the black curve in Figure 12C. This not only fails to support the frequency but also has a counterproductive effect.
4.5 Renewable penetration and utilization
Although PV-VSG effectively suppresses frequency oscillations, PV curtailment results in solar resource wastage, potentially reducing the efficiency of RE investments. However, due to the increased PV hosting capacity contributed by PV-VSG, the power supply cost can be reduced by decreasing the use of diesel power generation. Therefore, this section will analyze the benefits of PV-VSG.
4.5.1 Evolution of PV available hosting capacity
The peak load on Wang-an Island is 1,200 kW. According to local operating instructions, at least one DG is required to be operational. Since the DG’s minimum operating point is 200 kW, the PV installed capacity is limited to less than 1,000 kWp to ensure power balance. In addition, the PV hosting capacity on islands is constrained by the grid’s ability to tolerate fluctuations, which is often related to the risk tolerance of the operator because the variation of PV has randomness.
In principle, the higher the risk the operator is willing to accept, the greater the PV available hosting capacity. For instance, with a VaR of 5%, this means that the environmental fluctuations that the power grid must withstand should cover 95% of the possible scenarios. In the following simulations, VaR is set to 10%, 5%, and 1% for analysis, respectively.
Apart from the allowable risk, the pre-curtailment strategy used for PV-VSG also affects the grid’s ability to withstand fluctuations. Based on the aforementioned dynamic simulations, the following analysis will examine the impact of different VaR settings and pre-curtailment strategies of PV-VSG on the frequency nadir after a fluctuation occurs, in order to estimate the PV available hosting capacity under various scenarios, as shown in Figure 13.
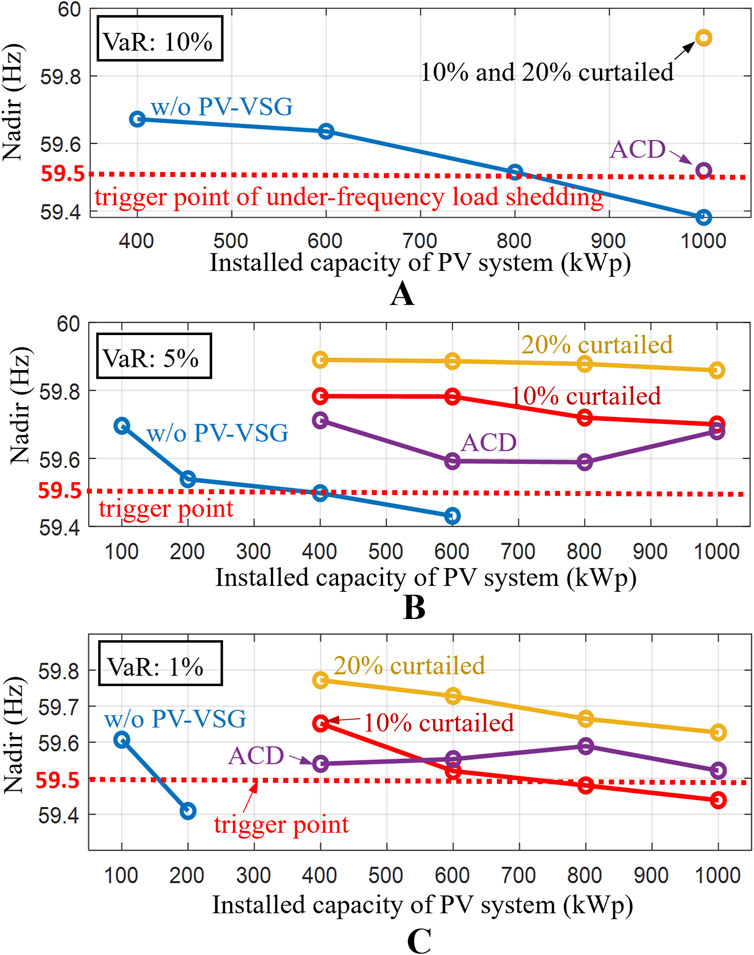
Figure 13. Frequency nadir after system disturbance for different PV installed capacities and VaR of the considered island (A) VaR = 10% (B) VaR = 5% (C) VaR = 1%. (Hua et al., 2017; Zhang et al., 2020; Zhong et al., 2022; Tarraso et al., 2017).
To prevent widespread power outages triggered by low-frequency protection relays, the frequency nadir during oscillations should remain above 59.5 Hz. From Figure 13A, it is evident that with a VaR set to 10%, the maximum allowable installed PV capacity is approximately 820 kWp, even without PV-VSG. With PV pre-curtailment levels set at fixed 10% and 20%, PV-VSG can maintain frequency nadir above 59.9 Hz, even when the installed PV capacity reached the upper limit of 1,000 kWp.
Figure 13A shows that when VaR is set at 10%, using the proposed ACD method no longer improves the hosting capacity, as the traditional method is sufficient to handle 1,000 kWp which considers the upper limit of power balance. However, in this case, the frequency nadir with the ACD method is 59.52 Hz, which is closer to the allowable lower frequency limit of 59.5 Hz compared to the traditional method’s 59.9 Hz. This suggests that the ACD method can make smarter decisions regarding power reservation to reduce solar resource wastage within permissible limits, as will be reflected in the following cost analysis. In Figure 13B, under more stringent conditions such as VaR = 5%, the maximum allowable installed PV capacity decreases to 400 kWp without PV-VSG implementation. This indicates that higher CL requirements lead to a reduction in the allowable installed PV capacity.
As shown in Figure 13C, further increasing the CL to 99% (i.e., VaR = 1%) restricts the PV hosting capacity without PV-VSG to only 150 kWp. In contrast, with PV-VSG, a fixed 10% curtailment allows for an installed capacity of 720 kWp. Both the fixed 20% curtailment and the proposed ACD can still accommodate a 1,000 kWp PV system.
The analysis demonstrates that when the operator selects a lower risk level (i.e., VaR = 1%), the absence of PV-VSG implementation significantly constrains the PV hosting capacity. Conversely, with the implementation of PV-VSG, both the proposed ACD method and the fixed 20% curtailment strategy can achieve the same hosting capacity. However, the proposed ACD method offers adaptive curtailment based on real-time conditions, thereby minimizing solar energy wastage. The impact on cost-effectiveness will be analyzed in the following sections.
4.5.2 Levelized cost of electricity calculation
To evaluate the cost-effectiveness under different scenarios, this study presents the 20-year supply cost using the levelized cost of electricity (LCOE) metric. The LCOE can be calculated by Equation 24. The total cost includes the initial investment and annual expenditure costs, as shown in Equation 25. The initial investment cost is mainly the cost of establishing PV system, which is the product of PV installation capacity,
The partial financing is beneficial to mitigate the initial capital investment. The reduction will be transferred to annual expenditures. Assuming the loan follows principal amortization method, the annual payment of financing
The initial investment also includes the cost of establishing ESS, which can be calculated by the power and energy capacity,
In addition, apart from the PV generation, all the load on the island must be supplied by the DG. Therefore, DG generation can be calculated by Equation 27. The annual DG generation is equal to the load minus the PV available generation and the curtailment required for PV-VSG,
4.5.3 Scenario study
Based on the above analysis, the maximum installed PV capacity corresponding to different VaR values and pre-curtailment methods can be used to further calculate the annual PV and DG generation, as shown in Figures 14A, B. The LCOE for each scenario is shown in Figure 14C. The LCOE for Wangan Island without PV installation was 0.305 (USD/kWh).
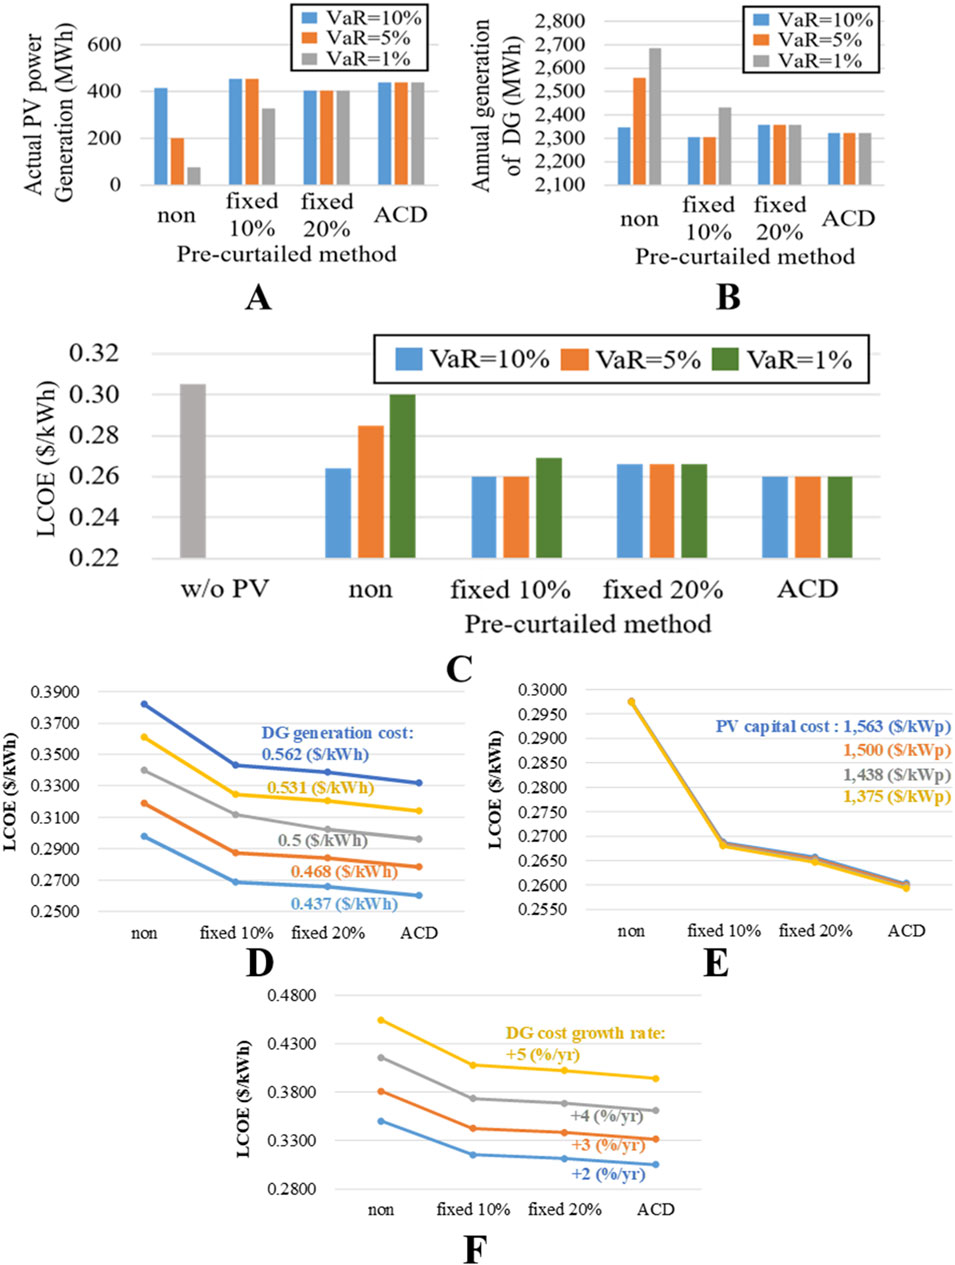
Figure 14. The (A) PV and (B) DG generation under different VaR values and pre-curtailment methods (C) LCOE ($/kWh) of different VaR values and pre-curtailment methods; LCOE of different (D) DG generation cost, (E) PV capital cost, and (F) DG growth rate. (Hua et al., 2017; Zhang et al., 2020; Zhong et al., 2022; Tarraso et al., 2017).
Due to the high transportation costs for islands, installing PV reduces supply costs, regardless of whether PV-VSG is adopted. Furthermore, when the VaR was set to 10%, considering a more lenient assessment of environmental fluctuations, an 820 kWp PV system could be installed even without using PV-VSG. In this case, PV-VSG does not contribute to further cost reduction, despite the increase in allowable PV installed capacity, because the curtailed amount also affects the costs.
If the operator decides to reduce risk by setting VaR at 5%, the scenario without PV-VSG only allowed 400 kWp of PV. Therefore, the advantages of PV-VSG become evident. The pre-curtailment using the proposed ACD showed the most significant difference, reducing LCOE by 8.8% compared with the scenario without PV-VSG. The improvement is significantly better than that of the traditional fixed 20% pre-curtailed method (Zhong et al., 2022; Tarraso et al., 2017), but only shows minor differences compared to the fixed 10% pre-curtailed method (Hua et al., 2017; Zhang et al., 2020).
Furthermore, if the VaR decreases to 1%, which is typically closer to the risk level acceptable to power system operators, the LCOE without PV-VSG is 0.3 (USD/kWh). The LCOE using the fixed 10% (Hua et al., 2017; Zhang et al., 2020) and the fixed 20% (Zhong et al., 2022; Tarraso et al., 2017) pre-curtailed method are 0.27 (USD/kWh) and 0.267 (USD/kWh), respectively. This indicates that although the fixed 20% pre-curtailed method wastes more solar energy, the allowable PV installed capacity is higher, resulting in a decreased LCOE.
The proposed ACD can accommodate 1,000 kWp of PV, similar to the fixed 20% pre-curtailed method. Through intelligent control of pre-curtailment, solar energy wastage is effectively reduced, resulting in LCOE decreases to 0.26 (USD/kWh). Compared to not using PV and not using PV-VSG, the LCOE is reduced by 14.75% and 13.33%, respectively.
The above analysis shows that the lower the risk tolerance, the lower the PV penetration allowed. Through PV-VSG technology, the allowable PV installed capacity can be effectively increased. However, pre-curtailment and associated cost need to be carefully weighed. When risk tolerance is high, PV-VSG may not demonstrate significant benefits. However, when the operator opts for a lower risk level, such as VaR = 1%, the proposed ACD enhances the benefits of PV-VSG, outperforming traditional fixed pre-curtailment methods (Liu et al., 2022).
This paper further examines the effects of certain external variables on the LCOE. The VaR for the simulations is consistently set at 1%. As illustrated in Figure 14D, when DG generation cost increases, in addition to the overall increase in LCOE, the benefits of employing PV-VSG are enhanced. This is attributed to the increased cost of DG-supplied electricity that can be substituted by PV energy. As a result, assuming the cost of DG generation increases from 0.437 ($/kWh) to 0.562 ($/kWh), the reduction in LCOE achieved by employing the PV-VSG with ACD pre-curtailment method can increase from 0.04 ($/kWh) to 0.05 ($/kWh).
In contrast, the sensitivity of the LCOE to changes in PV capital costs is minimal. This is because the cost of PV installation only affects the initial investment, and its proportion of the total cost is limited. As shown in Figure 14E, even when the PV capital cost decreases from 1,563 ($/kWp) to 1,375 ($/kWp), the impact on LCOE is not significant. This suggests that PV installations can proceed immediately without the need to wait for further reductions in PV capital costs.
Moreover, if the DG cost is not a fixed value but increases annually due to inflation, Figure 14F demonstrates that as the DG cost growth rate rises from 2% per year to 5% per year, the reduction in LCOE achieved by employing the PV-VSG with ACD method also increases from 0.05 ($/kWh) to 0.06 ($/kWh), representing a 20% increase. Although the future DG cost growth rate is difficult to predict, the global trend toward carbon reduction suggests that the cost of using fossil fuels may continue to rise, which will also enhance the practical value of the technologies proposed in this paper.
5 Conclusion
This paper proposes a parameter design method for an island hybrid energy system with VSG control in IBRs, including ESS and PV system. The proposed method employs MOGA to optimize control parameters, addressing both the maximum frequency nadir and minimum settling time. During optimization, the method integrates the DIgSILENT dynamic model to ensure stable operation of the multi-source parallel system, preventing abnormal disturbances.
To address the issue of pre-curtailment requirements affecting the benefits of PV-VSG, this paper proposes a two-stage ANN-based ACD method to dynamically assess the pre-curtailment needed for PV-VSG systems. To validate its feasibility, this study combines the VaR method, incorporating two stochastic variables, with dynamic simulations to estimate the maximum allowable PV installed capacity in an islanded system under a specific risk level.
By integrating VaR with LCOE calculations, it is evident that if operators are willing to accept higher risk, the allowable PV penetration can be increased. For an island with high transportation costs, this could help reduce LCOE of electricity but also raises the probability of power outages due to net-load fluctuations.
When VaR is 1% or lower, indicating lower risk tolerance, the proposed ACD method can more accurately determine the required PV pre-curtailment. Therefore, the reduction in PV energy wastage enhances the cost-effectiveness of adopting PV-VSG. Compared to traditional fixed pre-curtailed methods of 10% and 20%, the LCOE savings can be improved by 29.35% and 16.74%, respectively.
Data availability statement
The original contributions presented in the study are included in the article/supplementary material, further inquiries can be directed to the corresponding author.
Author contributions
Y-SW: Conceptualization, Data curation, Formal Analysis, Investigation, Methodology, Resources, Software, Validation, Visualization, Writing–original draft, Writing–review and editing. J-TL: Formal Analysis, Supervision, Visualization, Writing–review and editing. H-TY: Funding acquisition, Project administration, Supervision, Writing–review and editing.
Funding
The author(s) declare that financial support was received for the research, authorship, and/or publication of this article. This work was supported by the National Science and Technology Council, R.O.C, under Grants 113-2218-E-006 -009.
Conflict of interest
The authors declare that the research was conducted in the absence of any commercial or financial relationships that could be construed as a potential conflict of interest.
Publisher’s note
All claims expressed in this article are solely those of the authors and do not necessarily represent those of their affiliated organizations, or those of the publisher, the editors and the reviewers. Any product that may be evaluated in this article, or claim that may be made by its manufacturer, is not guaranteed or endorsed by the publisher.
References
Alhejaj, S. M., and Gonzalez-Longatt, F. M. (2016). “Investigation on grid-scale BESS providing inertial response support,” in IEEE international conference on power system technology (Wollongong, NSW, Australia: IEEE). doi:10.1109/POWERCON.2016.7754049
Barać, B., Krpan, M., Capuder, T., and Kuzle, I. (2021). Modeling and initialization of a virtual synchronous machine for power system fundamental frequency simulations. IEEE Access 9, 160116–160134. doi:10.1109/ACCESS.2021.3130375
Bijaieh, M. M., Weaver, W. W., and Robinett, R. D. (2020). Energy storage requirements for inverter-based microgrids under droop control in d-q coordinates. IEEE Trans. Energy Convers. 35 (2), 611–620. doi:10.1109/TEC.2019.2959189
Chen, S., Sun, Y., Hou, X., Han, H., Fu, S., and Su, M. (2023). Quantitative parameters design of VSG oriented to transient synchronization stability. IEEE Trans. Power Syst. 38 (5), 4978–4981. doi:10.1109/TPWRS.2023.3293016
Cole, W., and Karmakar, A. (2023). Cost projections for utility-scale battery storage: 2023 update. Golden: National Renewable Energy Laboratory. doi:10.1109/PTC.2011.6019324
Fawzy, A., Bakeer, A., Magdy, G., Atawi, I. E., and Roshdy, M. (2021). Adaptive virtual inertia-damping system based on model predictive control for low-inertia microgrids. IEEE Access 9, 109718–109731. doi:10.1109/ACCESS.2021.3101887
Hasabelrasul, H., Cai, Z., Sun, L., Suo, X., and Matraji, I. (2022). Two-stage converter standalone PV-battery system based on VSG control. IEEE Access 10, 39825–39832. doi:10.1109/ACCESS.2022.3165664
Hua, T., Yan, X., and Fan, W. (2017). “Research on power point tracking algorithm considered spinning reserve capacity in grid-connected photovoltaic system based on VSG control strategy,” in IEEE 3rd international future energy electronics conference and ECCE asia, 2059–2063. doi:10.1109/IFEEC.2017.7992368
Joung, K. W., Kim, T., and Park, J.-W. (2019). Decoupled frequency and voltage control for stand-alone microgrid with high renewable penetration. IEEE Trans. Industry Appl. 55 (1), 122–133. doi:10.1109/ICPS.2018.8369983
Li, X., Wang, X., Guo, L., Liu, R., Wang, H., and Xing, J. (2021b). “Application of VSG control in microgrids with unknown frequency dynamic of diesel generator,” in IECON annual conference of the IEEE industrial electronics society (Toronto, ON, Canada: IEEE). doi:10.1109/IECON48115.2021.9589499
Li, Z., Chan, K. W., Hu, J., and Guerrero, J. M. (2021a). Adaptive droop control using adaptive virtual impedance for microgrids with variable PV outputs and load demands. IEEE Trans. Industrial Electron. 68 (10), 9630–9640. doi:10.1109/TIE.2020.3022524
Liu, B., Wu, T., Liu, Z., and Liu, J. (2020). A small-AC-signal injection-based decentralized secondary frequency control for droop-controlled islanded microgrids. IEEE Trans. Power Electron. 35 (11), 11634–11651. doi:10.1109/TPEL.2020.2983878
Liu, J., Hou, Y., Guo, J., Liu, X., and Liu, J. (2023). A cost-efficient virtual synchronous generator system based on coordinated photovoltaic and supercapacitor. IEEE Trans. Power Electron. 38 (12), 16219–16229. doi:10.1109/TPEL.2023.3317497
Liu, J., Miura, Y., Bevrani, H., and Ise, T. (2017). Enhanced virtual synchronous generator control for parallel inverters in micro-grids. IEEE Trans. Smart Grid 8 (5), 2268–2277. doi:10.1109/TSG.2016.2521405
Liu, Z., Qin, L., Yang, S., Zhou, Y., Wang, Q., Zheng, J., et al. (2022). A comprehensive control strategy for photovoltaic virtual synchronous generator considering frequency regulation capability. Energy Rep. 8 (12), 153–163. doi:10.1016/j.egyr.2022.10.131
Marinopoulos, A., Papandrea, F., Reza, M., Norrga, S., Spertino, F., and Napoli, R. (2011). “Grid integration aspects of large solar PV installations: LVRT capability and reactive power/voltage support requirements,” in IEEE trondheim PowerTech (Trondheim, Norway: IEEE). doi:10.1109/PTC.2011.6019324
Meng, Y., Li, X., Liu, X., Cui, X., Xu, P., and Li, S. (2021). A control strategy for battery energy storage systems participating in primary frequency control considering the disturbance type. IEEE Access 9, 102004–102018. doi:10.1109/ACCESS.2021.3094309
Panizo-lledot, A., Pedemonte, M., Bello-orgaz, G., and Camacho, D. (2022). Addressing evolutionary-based dynamic problems: a new methodology for evaluating immigrants strategies in MOGAs. IEEE Access 10, 27611–27629. doi:10.1109/ACCESS.2022.3156944
Pournazarian, B., Sangrody, R., Lehtonen, M., Gharehpetian, G. B., and Pouresmaeil, E. (2022). Simultaneous optimization of virtual synchronous generators parameters and virtual impedances in islanded microgrids. IEEE Trans. Smart Grid 13 (6), 4202–4217. doi:10.1109/TSG.2022.3186165
Pournazarian, B., Sangrody, R., Saeedian, M., Lehtonen, M., and Pouresmaeil, E. (2021). Simultaneous optimization of virtual synchronous generators (VSG) parameters in islanded microgrids supplying induction motors. IEEE Access 9, 124972–124985. doi:10.1109/ACCESS.2021.3111015
Qu, S., and Wang, Z. (2021). Cooperative control strategy of virtual synchronous generator based on optimal damping ratio. IEEE Access 9, 709–719. doi:10.1109/ACCESS.2020.3046626
Shen, F., Wu, Q., Zhao, J., Wei, W., Hatziargyriou, N. D., and Liu, F. (2020). Distributed risk-limiting load restoration in unbalanced distribution systems with networked microgrids. IEEE Trans. Smart Grid 11 (6), 4574–4586. doi:10.1109/TSG.2020.2995099
Sivaranjani, S., Agarwal, E., Gupta, V., Antsaklis, P., and Xie, L. (2021). Distributed mixed voltage angle and frequency droop control of microgrid interconnections with loss of distribution-PMU measurements. IEEE Open Access J. Power Energy 8, 45–56. doi:10.1109/OAJPE.2020.3047639
Sonawane, A. J., and Umarikar, A. C. (2022a). Three-phase single-stage photovoltaic system with synchronverter control: power system simulation studies. IEEE Access 10, 23408–23424. doi:10.1109/ACCESS.2022.3153505
Sonawane, A. J., and Umarikar, A. C. (2022b). Small-signal stability analysis of PV-based synchronverter including PV operating modes and DC-link voltage controller. IEEE Trans. Industrial Electron. 69 (8), 8028–8039. doi:10.1109/TIE.2021.3109506
Standard chartered (2024). Standard chartered website. Available at: https://www.sc.com/tw/personal-loan/articles/about-rate-calculation/ (Accessed July 7, 2024).
Sun, C., Joos, G., and Bouffard, F. (2020). Adaptive coordination for power and SoC limiting control of energy storage in an islanded AC microgrid with impact load. IEEE Trans. Power Deliv. 35 (2), 580–591. doi:10.1109/TPWRD.2019.2916034
Tarraso, A., Candela, J. I., Rocabert, J., and Rodriguez, P. (2017). “Synchronous power control for PV solar inverters with power reserve capability,” in 43rd annual conference of the IEEE industrial electronics society, 2712–2717. doi:10.1109/IECON.2017.8216456
Ullah, S., Khan, L., Sami, I., and Ullah, N. (2021). Consensus-based delay-tolerant distributed secondary control strategy for droop controlled AC microgrids. IEEE Access 9, 6033–6049. doi:10.1109/ACCESS.2020.3048723
Wang, Z., Yi, H., Zhuo, F., Lv, N., Ma, Z., Wang, F., et al. (2022). Active power control of voltage-controlled photovoltaic inverter in supporting islanded microgrid without other energy sources. IEEE J. Emerg. Sel. Top. Power Electron. 10 (1), 424–435. doi:10.1109/JESTPE.2021.3069700
Xu, H., Yu, C., Liu, C., Wang, Q., and Zhang, X. (2020). An improved virtual inertia algorithm of virtual synchronous generator. J. Mod. Power Syst. Clean Energy 8 (2), 377–386. doi:10.35833/MPCE.2018.000472
Xu, Q., Dragicevic, T., Xie, L., and Blaabjerg, F. (2021). Artificial intelligence-based control design for reliable virtual synchronous generators. IEEE Trans. Power Electron. 36 (8), 9453–9464. doi:10.1109/TPEL.2021.3050197
Zhang, M., Zhen, Z., Liu, N., Zhao, H., Sun, Y., Feng, C., et al. (2023). Optimal graph structure based short-term solar PV power forecasting method considering surrounding spatio-temporal correlations. IEEE Trans. Industry Appl. 59 (1), 345–357. doi:10.1109/TIA.2022.3213008
Zhang, X., Gao, Q., Hu, Y., Zhang, H., and Guo, Z. (2020). Active power reserve photovoltaic virtual synchronization control technology. Chin. J. Electr. Eng. 6 (2), 1–6. doi:10.23919/CJEE.2020.000006
Zhang, X., Hu, Y., Mao, W., Zhao, T., Wang, M., Liu, F., et al. (2021). A grid-supporting strategy for cascaded H-bridge PV converter using VSG algorithm with modular active power reserve. IEEE Trans. Industrial Electron. 68 (1), 186–197. doi:10.1109/TIE.2019.2962492
Keywords: artificial neural network, energy storage system, frequency nadir, hybrid energy system, multi-objective optimization, power system dynamic simulation, risk management, virtual synchronous generator
Citation: Wu Y-S, Liao J-T and Yang H-T (2024) Multi-objective parameter design and economic analysis of VSG-controlled hybrid energy systems in islanded grids. Front. Energy Res. 12:1460940. doi: 10.3389/fenrg.2024.1460940
Received: 07 July 2024; Accepted: 05 September 2024;
Published: 19 September 2024.
Edited by:
Xiaoyi Ding, Xi’an University of Technology, ChinaReviewed by:
Xusheng Wang, Shanghai Jiao Tong University, ChinaKai Zhang, Shanghai Jiao Tong University, China
Copyright © 2024 Wu, Liao and Yang. This is an open-access article distributed under the terms of the Creative Commons Attribution License (CC BY). The use, distribution or reproduction in other forums is permitted, provided the original author(s) and the copyright owner(s) are credited and that the original publication in this journal is cited, in accordance with accepted academic practice. No use, distribution or reproduction is permitted which does not comply with these terms.
*Correspondence: Hong-Tzer Yang, aHR5YW5nQG1haWwubmNrdS5lZHUudHc=
 Yi-Syuan Wu
 Jian-Tang Liao
 Hong-Tzer Yang