- 1Institute of Energy Technology, Eastern Switzerland University of Applied Sciences, Rapperswil, Switzerland
- 2Chair of Structural Mechanics and Monitoring, ETH Zürich, Zurich, Switzerland
- 3Octue Ltd., Cambridge, United Kingdom
Digital twins play an ever-increasing role in maximising the value of measurement and synthetic data by providing real-time monitoring of physical systems, integrating predictive models and creating actionable insights. This paper presents the development and implementation of the Aerosense digital twin for aerodynamic monitoring of wind turbine rotor blades. Employing low-cost, easy-to-install microelectromechanical (MEMS) sensors, the Aerosense system collects aerodynamic and acoustic data from rotor blades. This data is analysed through a cloud-based system that enables real-time analytics and predictive modelling. Our methodological approach frames digital twin development as a systems engineering problem and utilises design patterns, design thinking, and a co-design framework from applied category theory to aid in the development process. The paper details the architecture, deployment, and validation of a ‘Digital Shadow’-type twin with simulation/prediction functionalities. The solution pattern is discussed in terms of its implementation challenges and broader applicability. By providing a practical solution to integrating all the digital twin components into a holistic system, we aim to help wind energy specialists learn how to transform a conceptual idea of a digital twin into a functional implementation for any application.
1 Introduction
1.1 Rotor blade aerodynamic monitoring
Due to the increasing size and flexibility of wind turbine rotor blades, it is becoming more and more important to measure and monitor their aerodynamic and acoustic behaviour operation (Schepers and Schreck, 2019). This can help wind turbine manufacturers (OEMs) to improve their aerodynamic models and blade designs, owner/operators to optimise operation and researchers to understand complex aerodynamic phenomena. The complexity of the installation and use of such measurement systems means that there have not yet been a large number of publications on the topic, despite the increasing demand. For example, the DanAERO project from 2013–2016 investigated the aerodynamic and acoustic properties of wind turbine blades in wind tunnel and field tests (Madsen et al., 2016; Troldborg et al., 2013). The field tests included instrumenting a 2 MW wind turbine rotor blade with 50 flush-mounted microphones. It was shown that such aero-acoustic field measurements have the potential to provide a high added value to the wind industry through furthered understanding of three-dimensional effects. Furthermore, the international collaboration IEA Wind Task 47 aims to cooperate and share experiences in aerodynamic measurements on Megawatt-scale wind turbines1. A more detailed study of previous literature can be found in the introduction of a recent paper by the current authors (Barber et al., 2022). It can be summarised that there is a large unmet need for easy-to-install and affordable rotor blade aerodynamic monitoring systems in the sector.
1.2 Digital twins
Digital twins are a promising technology for creating value from wind turbine monitoring, such as rotor blade aerodynamic monitoring, particularly when a scale-up of a single measurement campaign is desired. A “digital twin” is a top-level conceptualisation based on two fundamental principles: “duality” and “strong similarity” (Grieves, 2022). The digital twin paradigm thus spans such a broad range of applications that two particular implementations may share few - or no - technological solutions between them. Recently, the current authors proposed a digital twin classification system based on a Simple Knowledge Organisation System (SKOS) (W3C, 2009) data model, to act as a starting point for the development of digital twins by allowing comparison or solution re-use between implementations (Marykovskiy et al., 2023a). An excerpt from the classification system is presented in Figure 1, referencing some digital twin types that have previously been described in literature, such as DigitalTwinPrototype and DigitalTwinInstance described by Grieves and Vickers (2017), DigitalModel, DigitalShadow, DigitalTwin described by Kritzinger et al. (2018), and various types categorised by their functionalities as described by Wagg et al. (2020).
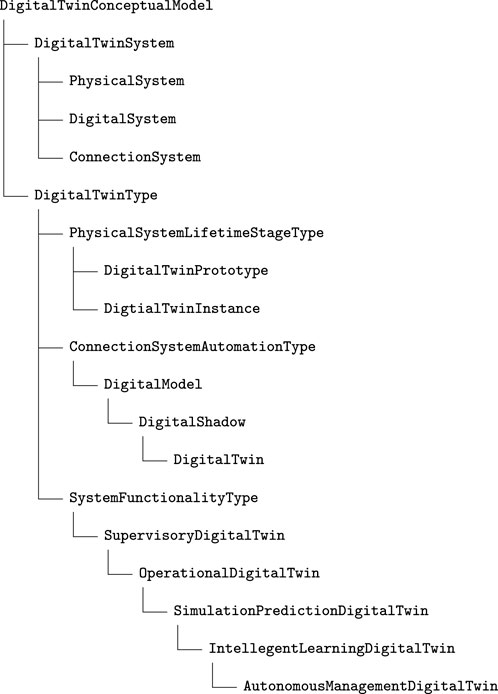
Figure 1. Excerpt from Digital Twin Conceptual Model (DTCM) SKOS taxonomy (Marykovskiy et al., 2023a).
When classified based on their functional capabilities (Wagg et al., 2020), digital twins can range from ‘Supervisory’, in which data from measurements is simply ingested and stored, to ‘Operational’, in which analysis of the operational data is undertaken, to ‘Simulation/Prediction’, in which models, simulations, validation, and verification and uncertainty quantification enhance the measurements, to ‘Intelligent/Learning’, which includes Decision Support Systems (DSS), and finally to ‘Autonomous/Management’, in which autonomous asset control is implemented. According to Wagg et al. (2020), the main transformative aspect of a digital twin is to improve the predictive capability of a system by augmenting computational models with data to create a virtual prediction tool that can evolve over time. ‘Intelligent/Learning’ digital twins have recently been shown to allow accelerated and informed decision-making related to physical systems by representing them virtually and including a continuous feedback loop between the virtual representation and a physical system (Arista et al., 2023; D’Amico et al., 2022; Grieves, 2022; Wagg et al., 2020; Zheng et al., 2021).
1.3 Developing digital twins in the wind energy context
Recently, publications related to digital twins and DSS in wind energy were reviewed by Marykovskiy et al. (2024) in the broader context of artificial intelligence systems and domain semantics. Most digital twin implementations in wind energy were found to belong to the functional levels ‘Supervisory’ (26 out of 111), ‘Operational’ (22) or ‘Simulation-Prediction’ (60). Only three papers belong to the functional levels ‘Intelligent-Learning’ (2) and ‘Autonomous-Management’ (1). For wind energy Operations and Management (O&M), previous ‘Supervisory’ or ‘Operational’ digital twins included continuous structural monitoring of a wind farm (Hines et al., 2023). ‘Simulation/Prediction’ digital twins included an augmented Kalman filter with a reduced mechanical model to estimate tower wind turbine loads (Branlard et al., 2020), integration of degradation processes in a strategic offshore wind farm O&M simulation model using a Markov process for blade degradation (Welte et al., 2017), and modelling the probabilistic characteristics of mooring line fatigue stresses for the purpose of risk-based inspection (Lone et al., 2022). ‘Intelligent/Learning’ digital twins include a probabilistic framework for updating the structural reliability of offshore wind turbine substructures based on digital twin information (Augustyn et al., 2021).
This distinction based on functional capabilities, however, is not the only possible classification of digital twin implementations. As we can see from Section 1.2, it is also possible to distinguish and group digital twins based on the manner in which the connection between the physical object and its digital representation is achieved or based on the fidelity levels of simulations employed. Here, the specific technological solutions used in composing the system into the one whole will highly depend on the use case and its requirements.
The sheer variety of different types and applications of digital twins has left many wind energy domain specialists struggling to clarify development processes that suit their specific needs: the passage from the conceptual idea of a digital twin to a functional implementation is often unclear. There exist a myriad of technology stacks, modelling and simulation tools, algorithms and system integration requirements, the selection of which is nuanced and made more complex by technical and specialised jargon. This is not helped by the focus of previous literature on the physical models, rather than on the system architecture.
In its core, the digital twin conceptual model does not necessarily imply an introduction or development of new modelling techniques or simulation applications. However, practical solutions to integrate all the digital twin components into a holistic system, with all of its constituents interconnected and valorised, remain obscure. For instance, one possibility to enable system orchestration is through the use of semantic artefacts. The term ‘semantic artefact’ is used to denote conceptualisations with various degree of expressiveness, such as controlled vocabularies, taxonomies, schemas and ontologies (Le Franc et al., 2020). However, in the aforementioned review by Marykovskiy et al. (2024), a lack of adoption of semantic artefacts in the research of digital twin and DSS was found, reflected by the low number of publications that refer to them (35 out of 181). This can be attributed to multitude of factors that plague multi- and interdisciplinary developments such as a natural tendency towards knowledge siloing within organisations and communities (wind energy from information technology professionals, industry from academia, etc.) as well as to the overall digitalisation challenges in the areas of data, culture and coopetition (Clifton et al., 2023). There is therefore a high value for the wind energy community to present developed digital twin instances from system architecture and technology implementation points of view.
1.4 The Aerosense system
The Aerosense system was developed to address the high demand for easy-to-use and cost effective rotor blade aerodynamic monitoring systems combined with a high potential of digital twin applications in this field, as mentioned in the previous two sections. Aerosense is a cost-effective microelectromechanical systems (MEMS)-based aerodynamic and acoustic wireless measurement system that is thin, non-intrusive, easy to install, low power, and self-sustaining, which was previously introduced by the authors of this present paper (Barber et al., 2022). The hardware is composed of sensor nodes installed on the blade and a base station receiving and sending the data to the cloud (Figure 2A). Figure 2B shows a sensor node of the Aerosense measurement system installed on a wind turbine blade.
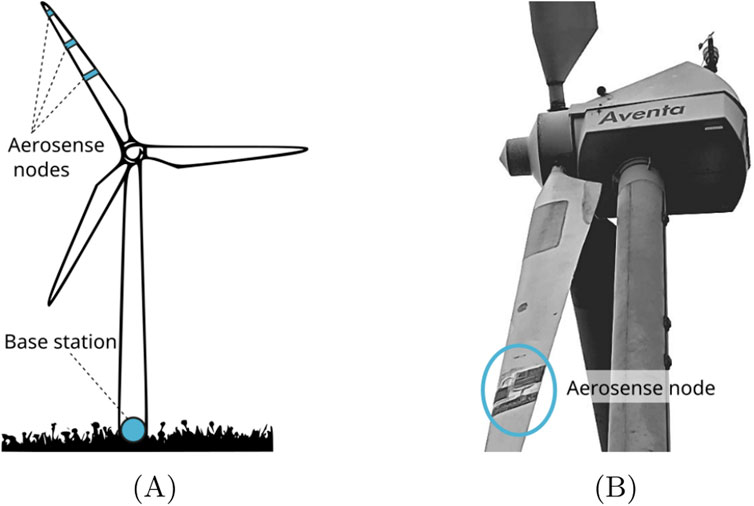
Figure 2. Aerosense system sensor hardware and its placement on a wind turbine blade. (A) General concept of the Aerosense system. (B) View of an Aerosense measurement system installed on a 6 m long wind turbine blade.
Previous publications related to this work have focused strongly on the hardware development, showing that the sensors are capable of delivering relevant results continuously in the wind tunnel (Barber et al., 2022; Polonelli et al., 2023a). Additionally, various methods for using the measurements to provide added value to the wind energy industry have been introduced, including Leading Edge Erosion (LEE) detection and classification (Duthé et al., 2021), inferring angle of attack and wind speed (Marykovskiy et al., 2023c), detecting structural damage (Abdallah et al., 2022) and flow-field reconstruction (Duthé et al., 2023). The overall design of the digital twin, including software integration and the cloud data storage design, has not yet been discussed.
1.5 This contribution
In this paper, we present and demonstrate the top-level system design of a digital twin for wind turbine rotor blade aerodynamic monitoring, which was developed as part of the Aerosense project. By providing a practical solution to integrating all the digital twin components into a holistic system, we aim to help wind energy specialists learn how to transform a conceptual idea of a digital twin into a functional implementation for any application. In Section 2 we present the system architecture of the Aerosense digital twin from a conceptual point of view. Then, we discuss the system design in Section 3, with a focus on the cloud data storage solution and the software integration. In Section 4 we present the results of a field test case, including the test set-up, the measurement results, and the demonstration of added value. In Section 5 we discuss its wider application, and in Section 5.3 we present the conclusions.
2 Architecture of the Aerosense digital twin
A multitude of design methodologies, decision support tools, and optimisation algorithms exist for facilitating design and architecting processes in general. Here we used several well-established methodologies including design thinking (Pearce, 2020), design patterns (Gamma et al., 1994; Tekinerdogan and Verdouw, 2020), decision trees and applied category theory (Censi, 2016; Zardini et al., 2021). According to the design patterns approach, before developing a concrete realisation of a digital twin, it is opportune to establish the desired digital twin type. Type selection is guided by the context in which the development of the digital twin is occurring. Adopting the design thinking methodology, the use case for the Aerosense digital twin is therefore first presented (Section 2.1), followed by digital twin type selection (Section 2.2), which served as a starting point in establishing the overall system architecture (Section 2.3).
2.1 The use case
In order to define the priority use case for the Aerosense project, a design thinking strategy was applied. Design thinking is an iterative methodology for framing problems and co-creating implementable solutions using visual thinking and prototyping (Pearce, 2020). It consists of the phases “Empathise”, “Define”, “Ideate”, “Prototype”, “Test” and “Implement”. For the “Empathise” phase, extensive “user story” interviews were carried out with potential customers from both industry and academia at the beginning of the project, in which several imagined but realistic “user stories” were presented and discussed. The results were used to define and prioritise the most important use cases for the “Define” phase. Through this process, we discovered that the Aerosense system has a high potential to provide OEMs, owner/operators and researchers with added value, including to improve aero-elastic models, detect and classify surface damage, and even detect structural damage. For the remaining phases, we applied a design pattern methodology, as discussed in the next sections.
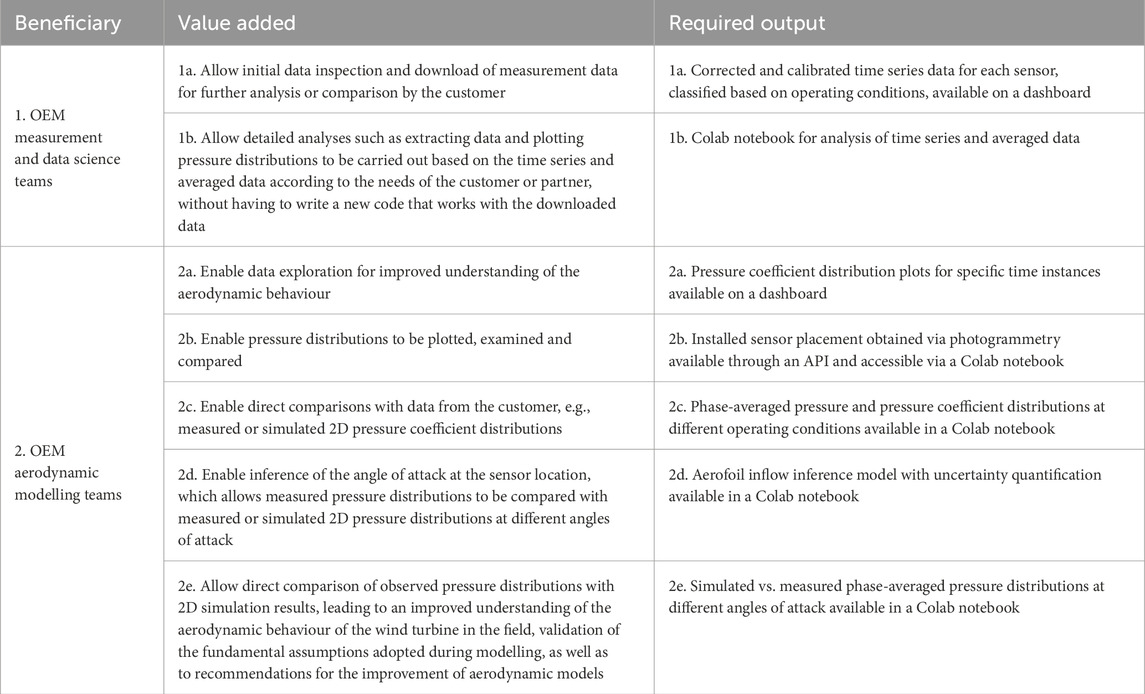
Analysing a variety of use cases revealed one foundational application. Since wind turbines have grown larger and more flexible in recent years, established 2D assumptions used for aerodynamic tools have become less likely to hold valid (Bangga et al., 2017). Thus, one of the use cases, “improving aerodynamic models”, was seen as most important, underpinning further analysis or damage detection methods. The beneficiaries, value statements and required outputs of this use case are given in Table 1. This information was used as a design basis for the system, and will be revisited in Section 4.
The required outputs from Table 1 can be summarised as functionality requirements for interactive dashboards (required outputs indicated by letter ‘a’) and Colab notebooks, which is a cloud-hosted Jupyter notebooks service (required outputs indicated by letters ‘b’ through ‘e’). For dashboards, these functionalities include visualisation, exploration, and inspection of sensors’ time series data and pressure coefficient distributions through interactive plots. Colab notebooks, on the other hand, allow for more flexible and custom uses, more accommodating of the defined user stories. Here, the main functionality to ensure is access to the sensor data, data processing algorithms, and simulations for further data transformation and analysis. The data processed in Colab notebooks can also be visualised, explored, and inspected through interactive plots.
2.2 Type classification
Comparing the digital twin classifications of Figure 1 to the required outputs from the use case exercise in Table 1, the DigitalTwinType of the Aerosense digital twin was classified as follows:
(because the intention is to work with an existing instance of a wind turbine, not, say, a prototype of a turbine not yet in existence)
(because there is a one-way automated connection from physical to digital system, as opposed to two-way, which would enable control or other adaptive behaviour)
(because the extent of the use case outputs include simulation and prediction applications, incorporating operational and supervisory aspects like visualisation of system state)
Each of the aforementioned types is accompanied by a specific design pattern (Tekinerdogan and Verdouw, 2020) reflected in the overall digital twin architecture and system hardware implementations as discussed in the following section.
2.3 Aerosense digital twin conceptual model and related hardware
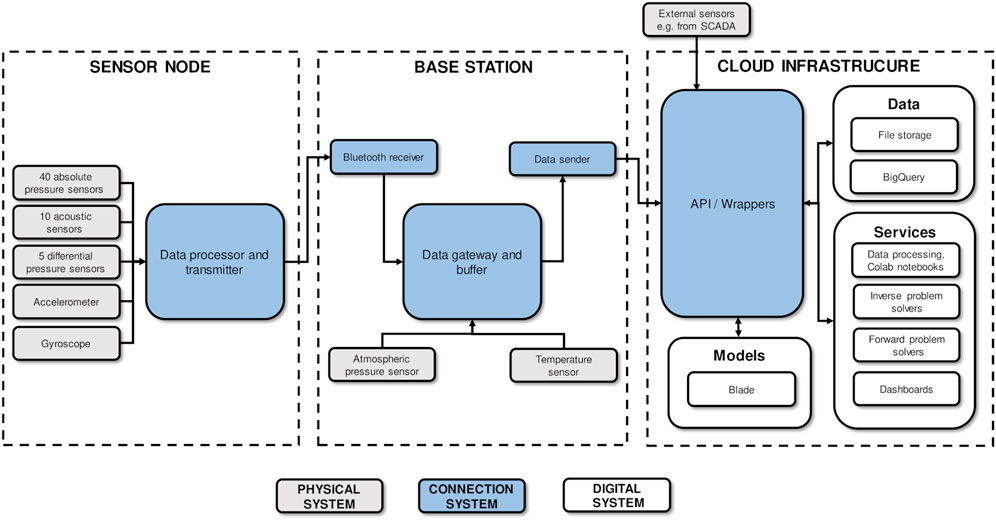
Generally, a digital twin system can be conceptually divided into three main sub-systems: physical system, digital system, and connection system. Sensors, in general, are considered to be a part of the physical system (Singh et al., 2021; Tao et al., 2018) or its interface. However, this conceptual division may not always coincide with the boundaries of the actual physical hardware (a more convenient division) requiring some pragmatism in classifying system components.2 A conceptual diagram of the Aerosense digital twin system and its hardware is shown in Figure 3. It comprises sensor node, base station, and cloud infrastructure sub-systems, which are classified and described below.
2.3.1 Physical system: wind turbine and sensors
As a DigitalTwinInstance the Aerosense system provides a digital twin for a wide range of generic turbines - from small test platforms to massive, multi-Megawatt scale devices. The latter impose demanding design requirements, especially in terms of wireless transmission ranges. Aerosense prototypes were tested on the Aventa AV-7 wind turbine3, a small 6 kW device, located in Taggenberg (CH), with a rotor diameter of 12.8 m: this is the physical instance that is “twinned” here. However, the design specifications enable use with much larger devices.
The Aerosense sensor node pictured in Figure 2 contains a suite of sensors to provide the measurements necessary for the outputs defined by the “improving aerodynamics models” use case. The sensors included in the suite are: absolute pressure senors, differential pressure sensors, acoustic sensors, a 9 Degrees of Freedom (DOF) Inertial Measurement Unit (IMU), and microphones. These sensors are controlled by an in-house data processing and transfer unit equipped with a Bluetooth Low Emission (BLE) wireless interface for data transmission (Polonelli et al., 2023a). Up to five sensor nodes can potentially be installed to allow for measurements at different locations on the rotor (Polonelli et al., 2023b). Section 3.2 discusses the design of the sensor nodes. External data sources such as Supervisory Control and Data Acquisition (SCADA) system data from turbines, weather forecasts, etc., could also be considered part of the physical system interface.
2.3.2 Connection system
The connection system4 forms the infrastructure for data retrieval from the sensor(s) through to the cloud infrastructure. The data flow from physical to digital system in a DigitalShadow is typically unidirectional, as can be seen from Figure 3. The main physical element of this connection system is the base station (see Figure 2), which acts as a gateway and a buffer for sensor data on its way from the node(s) to the data ingress of the cloud infrastructure. It orchestrates sessions of sampling and data download from the node(s), and allows sessions to be controlled remotely (see Section 3.3). The Application Programming Interface (API) serves as a “connecting tissue” between different applications within the digital system. Additionally it serves as an entry point for the sensor data arriving from the gateway (running on the base station) as well as from external sensors including SCADA and other data describing physical system quasi-static properties (e.g., geometry). For the Aerosense system, a project-specific API was developed. The design of the API and software integration is discussed in detail in Section 3.4.
2.3.3 Digital system (data, services and models)
As can be seen in Figure 3, the digital system can be conceptually divided into three sub-systems: Data (for data storage and retrieval), Models (which are the virtual entities representing the physical system) and Services (which run Models for analysis, provide data transformation and support applications like dashboards or other monitoring tools). This classification maps ontologically to the “five-dimension” digital twin model proposed by Tao et al. (2019) and used in the development of a prognostics and health management wind turbine digital twin (Tao et al., 2018). For the specific implementation of this SimulationPredictionDigitalTwin, the Services include forward solvers to provide the simulation capabilities, inverse solvers to infer non-measured quantities, data processing algorithms and Colab notebooks to perform data transformation and analysis, and dashboards for immediate data visualisation, exploration and inspection. The Models include Computer Aided Design (CAD) geometries of the blades, as well as sectional models for the aforementioned forward solvers. The Data sub-system provides data storage through two modalities: file storage (for long term data persistence) and BigQuery tables (for when the data needs to be queried by a user or a service). The design of the digital system is discussed in detail in Section 3.4.
3 Hardware and digital system design
A concrete realisation of the chosen digital twin type requires an implementation of hardware and digital system solutions, which provide the end users with a desired set of functionalities (e.g., supervisory through to intelligent learning functions, fidelity levels, twin synchronisation times, etc.) within the bounds of available resources (e.g., production and operational costs, etc.). Furthermore, when creating complex multi-scale systems such as wind turbine digital twins, it is common for the development process to occur in different teams. In this case, a team may work on a system component that has certain functionalities, which in turn satisfy resource requirements for the other team. For example, an electronics team working on a measurement system development chooses sensors that capture certain data with certain accuracy and precision. This data is later used by a cloud services development team as an input to their solvers. The changes adopted by one team will affect the performance of other, yet the final digital twin should still satisfy the user-defined constraints. This can be seen as an applied category theory collaborative design (or co-design) problem as defined by Censi (2016) and Fong and Spivak (2018). The co-design problem in general, and specifically for the entire Aerosense digital twin system, is presented in Section 3.1, followed by a system-level overview of sensor(s) design in Section 3.2. The base station design is touched upon in Section 3.3, and the cloud infrastructure and digital system implementation is discussed in detail in Section 3.4.
3.1 Co-design problem
Before formally defining a co-design problem, it is necessary to formalise a single design problem with implementation (DPI):
where:
A co-design problem, then, is defined as a multigraph of design problems. This allows to treat an overall design of the system in a compositional manner (i.e., divide the system into its components) and to introduce different levels of abstraction.
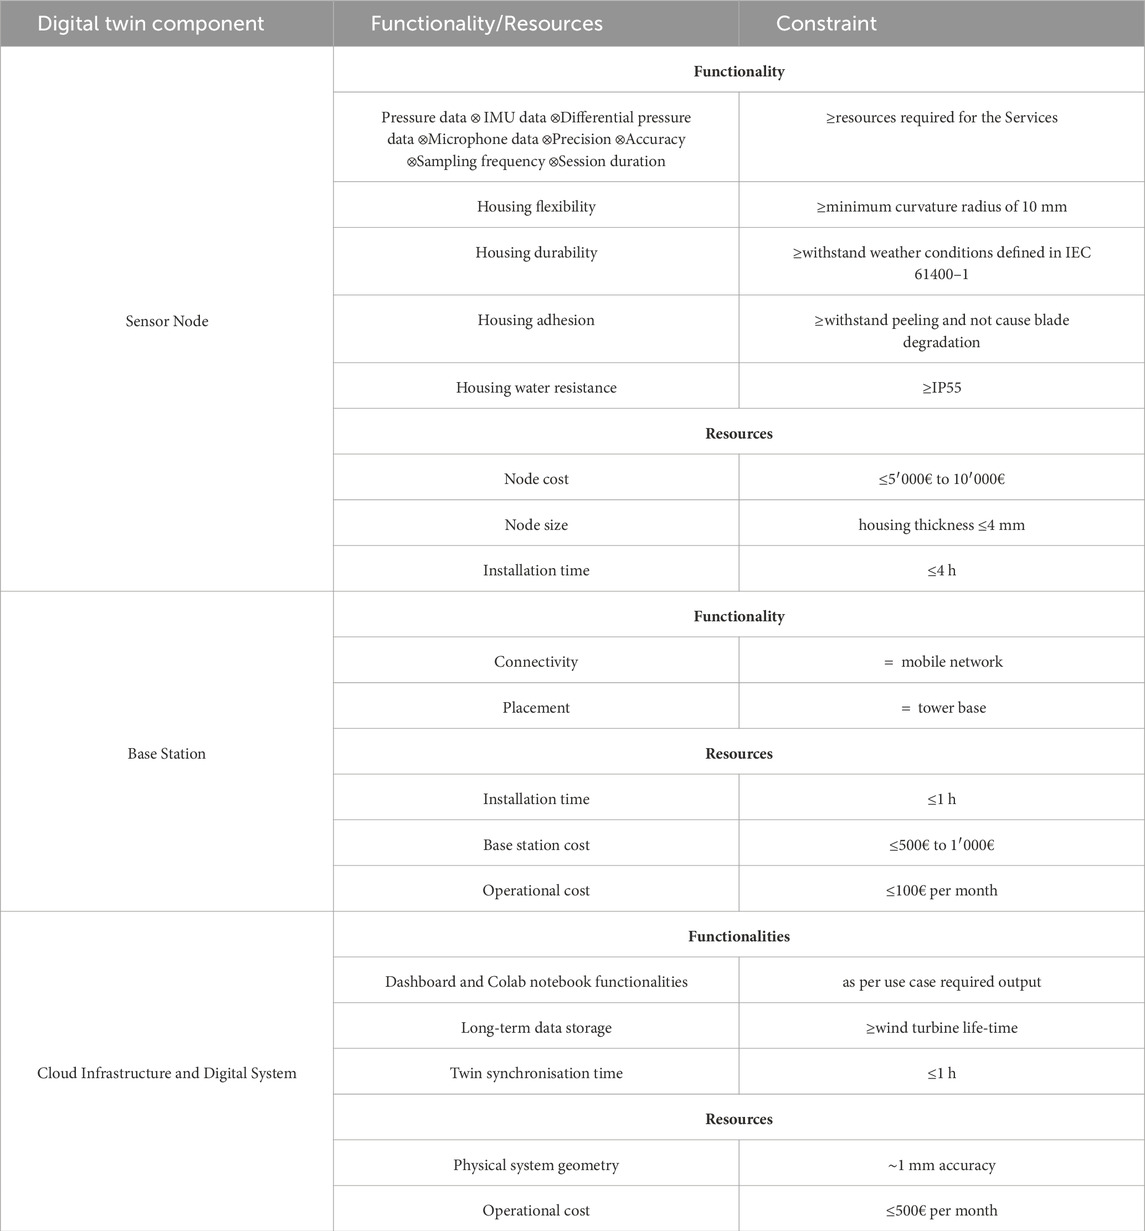
In the case of the Aerosense digital twin, the constraints on the Functionality and Requirement spaces are presented in Table 2. These are specific quantitative (when possible) and qualitative top-level constraints resulting from the use-story studies, described previously in Section 2.1. The overall system co-design problem can be visually represented using the graphical language as in Figure 4, with an abstraction on the hardware components and digital system levels. In these type of figures, the co-design graph is presented, allowing for an immediate overview of various interdependences in the system. Each labeled node represents an Implementation of a component or an assembly, while the edges can be of either Functionality or Recourse type. To which degree an assembly should be split to sub-assemblies and sub-sub-assemblies is arbitrary, enabling various levels of abstraction. For example, it is possible to consider the senor node(s) as a whole or, as an assembly of sensors, power, housing, compute, and transmission assemblies. In the next three sections, the design of the three main components, senor node(s), base station, and cloud infrastructure and digital system is presented.
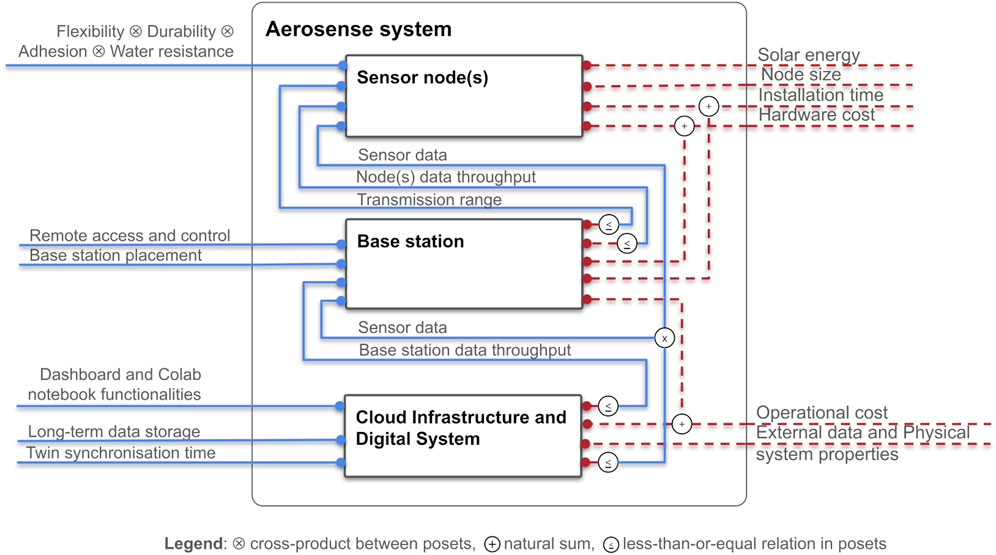
Figure 4. Aerosense digital twin co-design problem Functionalities (blue solid) and Resources (red dashed).
3.2 Sensor node design
The development of the sensor node is the most complex part of the Aerosense system design. From a system point of view, it requires a close collaboration between teams of diverse backgrounds and expertise such as development of integrated circuit boards and relative firmware (Center for Project Based Learning at ETH Zurich), experimental and computational fluid dynamics (Institute for Energy Technology at OST), structural health monitoring and machine learning (Structural Mechanics and Monitoring at ETH Zurich), data engineering (Octue), and additive manufacturing (Institute of Materials Engineering and Plastics Processing at OST). Hence, here we describe the design constraints and implementation characteristics on a system level. A detailed description of the sensor node design from an electronics point of view is available in the relevant preceding publications (Polonelli et al., 2023a).
The functionality and resources graph defined by each team during sensor node design is visualised in Figure 5. In addition to the overall design constraints already defined in Table 2 it illustrates the interdependence between various components within the sensor node design problem. For instance, a change to the desired measurement data characteristics inevitably updates the constraints on compute, power, and transmission systems. This, in turn, may influence the housing design, for example, by requiring it to provide more useable volume for a bigger battery. In terms of actual implementations, which provide the desired functionalities within the bounds of available required resources, the sensor node components have the characteristics described hereinafter.
Measurement data is the key functionality of the sensor node component, as it also constitutes a required resource for the digital system and its services. The types of sensors utilised, measurement characteristics (precision, accuracy, sampling frequency), and measurement session periods are all ultimately driven by necessity to capture the physical system state in sufficient resolution to describe the underlying phenomena. This process is at the core of the digital twin concept in that of the physical system being twinned to its digital representation. The fidelity and the resolution of this digital representation, in the end, should provide the functionalities and the added value desired by the digital twin users. The reader may refer directly to Section 3.4.3, which discusses digital system services, for more information on the intended use of the measurement data.
In terms of the sensor suite, the hardware implementation is the following. An array of 40 MEMS absolute pressure sensors (ST LPS27HHW) are distributed along the chord of the blade, sampling at 100 Hz. Following thorough calibration, an absolute accuracy of 11 Pa is achieved. Given the expected dynamic pressure of 1,000 Pa on a 5 MW wind turbine, (Deparday et al., 2022), it suggests that a precision of 1% can be reached in pressure measurements. Five differential pressure sensors measure differences of pressure around the leading-edge. The sensors have an accuracy of 0.25% Full Scale, +1 Last Significant Bit, at 25°C and a sampling frequency of 1.2 kHz, sufficient to resolve fast dynamics of the turbulent inflow. Ten acoustic sensors (Vesper VM2020) sampling at 16 kHz are installed at the trailing edge. An Inertial Measurement Unit (IMU) is included, comprising an accelerometer, a gyroscope and a magnetometer (Bosch BMX160). The IMU data is sampled at 100 Hz.
On-board compute, sensor controls, and data transmission are provided by a CC2652P microcontroller by Texas Instruments. It embeds a 48 MHz ARM Cortex-M4 processor, and a Bluetooth Low Emission (BLE) wireless interface to capture data from the individual sensors and communicate with the base station. This solution provides a low power consumption for sensor readout, and a long-range transmission with a range up to 400 m at a rate up to 2 Mbps (Fischer et al., 2021). This allows for a flexible base station placement even on a large-scale wind turbines. The implementation of the BLE is a result of the power consumption requirement. However, this implementation results in a significant data throughput limitation. This design problem does not have a data streaming solution with the current technology. Instead, a batch processing approach was adopted, in which sampling periods (i.e., measurement sessions) are intermittent with data transfer periods. The manner in which this conditioned the development of the Aerosense system is further described in Section 3.3 and Section 3.4.
The housing for the sensors, integrated circuits, and power module is implemented with a custom-made PolyJet 3D-printed sleeve, which is flexible enough to bend around airfoil section where the system may be potentially installed. To provide necessary adhesion characteristics, the sleeve is fixed onto the blade with the same type of adhesion tape that is used for leading edge protection of wind turbine blades. This solution also ensures an easy installation by a technician even on mounted blades, and the possibility of the system removal without damaging the blade.
3.3 Base station design
The design of the base station is less complex compared to the other parts of the Aerosense system. The constraints imposed (see Figure 4) are also less restrictive, with multiple possible solutions in terms of hardware and software implementations. Hence, in the case of the Aerosense digital twin, there is no necessity to formalise the design of individual components of the base station as a co-design problem, maintaining a higher abstraction level. The base station hardware comprises a BLE transceiver, a local computing unit running the gateway software (on a Linux distribution), and a mobile network modem which provides a connection to cloud resources. The open-source gateway software5 was implemented as a Command Line Interface (CLI) in python, with a multi-threaded implementation (to stream packets from the node whilst simultaneously caching, batching and uploading their data contents). Software was deployed using balena.io, which allowed automated update across multiple prototypes as well as facilitating remote connection via Secure Shell Protocol (SSH). The gateway uploads data files (containing batches of sensor values) to the Data Ingress area (see Figure 7), and interfaces with the API to retrieve and update installation configurations (containing information related to equipped sensors, geolocation of the site, sensor geometry and so on) (Clark and Lugg, 2022).
3.4 Cloud infrastructure and digital system design
The cloud infrastructure provides the necessary resources for the digital system implementation (see Figure 6). From the top level point of view, the required functionalities of the cloud infrastructure include data storage, management and querying for the data system. At the same time, cloud infrastructure provides necessary compute and orchestration capabilities for digital system services. Lastly, for models, there is a requirement of management solutions. In terms of resources required by the cloud infrastructure itself, the main limitation is imposed by the operational costs, as modern cloud solutions are capable of managing Big Data type datasets and providing high performance computing (HPC).
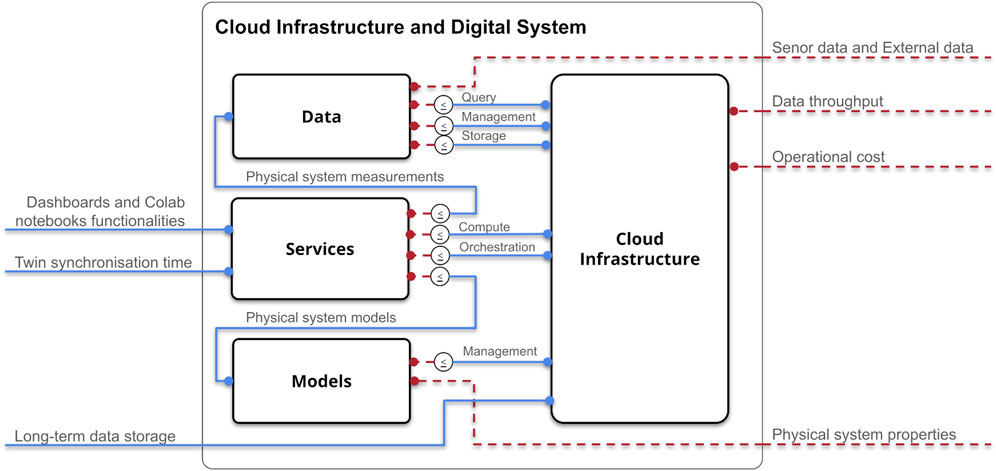
Figure 6. Cloud infrastructure and digital system co-design problem Functionalities (blue solid) and Resources (red dashed).
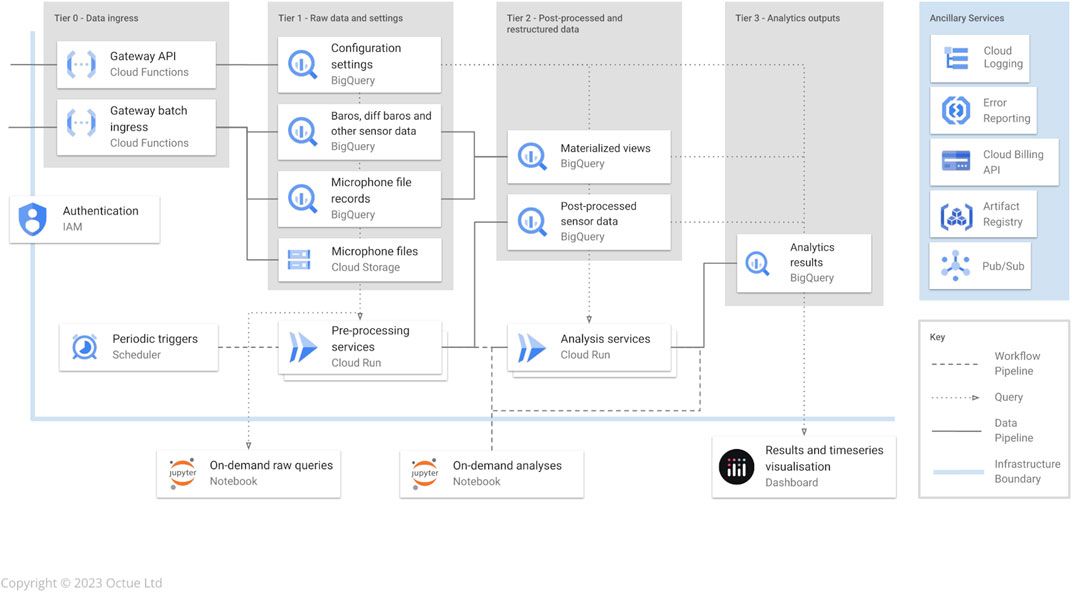
For the Aerosense digital twin, Figure 7 shows a more detailed view of the cloud infrastructure supporting the implementation of the digital system, highlighting the data storage, retrieval and data processing services that comprise the digital twin. This architecture was determined from a bottom-up analysis of the data requirements discussed in Section 3.4.1, and is described in more details in the following sub-sections.
3.4.1 Data
The design of an efficient Data sub-system is fundamental for a sustainable and scalable digital twin solution. The design decisions include data ingress organisation (such as communication protocols, endpoints, and APIs), data management and storage solutions (such as database types and databases management systems (DBMS) selection), data modelling and querying implementations (such as data conceptual models and database schemas), as discussed below.
3.4.1.1 Data ingress
The data ingress area of Figure 7 represents the final step in connection of the physical to the digital system. Data ingress has two aspects:
The Cloud Functions for data ingress are developed in the same repository as the rest of the data gateway code, and deployed in the same Continuous Deployment process. This ensures that edge gateway code running on the base stations is always compatible with its counterpart cloud-side.
3.4.1.2 Data management and storage
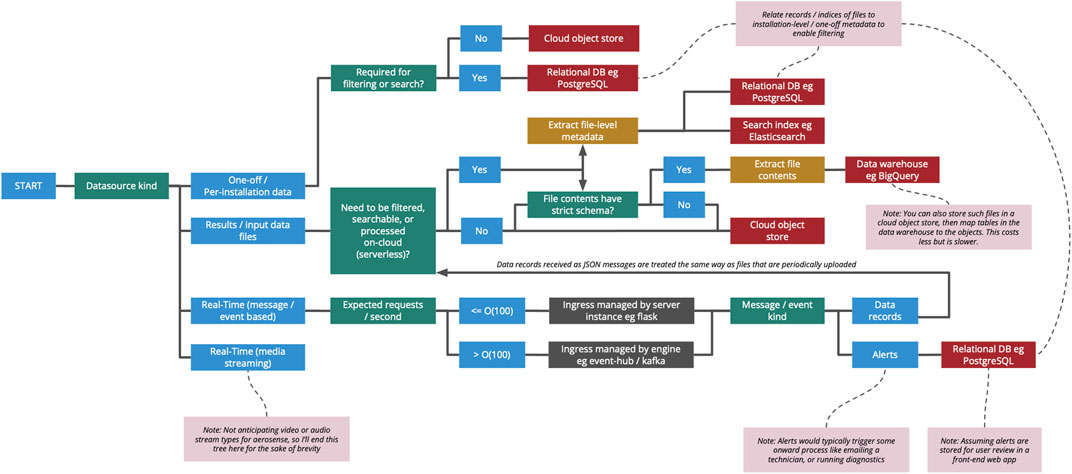
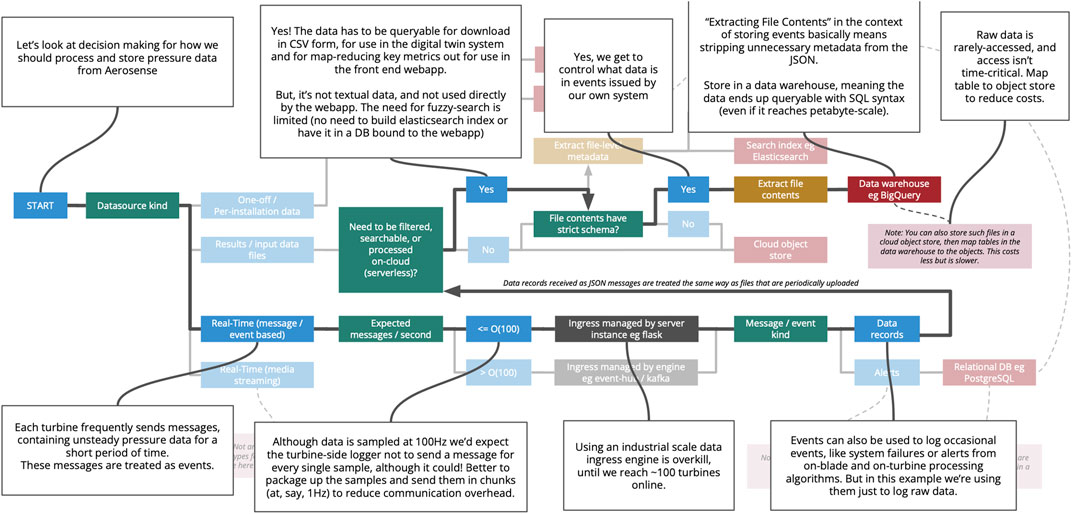
The architecture of the tiered data lakehouse shown in Figure 7 was not developed in a top-down approach, but the opposite: its design emerged from a bottom-up consideration of 1) what data sources would have to be stored/retrieved, 2) why end users (researchers) would access them and 3) how they would do that. To start this process, a decision tree was built, not considering Aerosense in particular but governing an entirely general problem of what kinds of data storage are suitable for what kinds of data. This is shown in Figure 8. Next, each different kind of data that the Aerosense project would produce was listed and the volume of that data kind was estimated.7 Drawing on the user profiles and journeys discussed in Section 2.1, a process was followed for each data kind to choose the ultimate storage decision. One example for the pressure sensor data (the kind requiring the most sophisticated approach) is shown in the Figure 9.
The recommended solution was to use a data warehouse for the following data sources:
Columns in the warehouse tables were defined to include associated system metadata and timestamps, allowing filtering of results by experimental session, by time, or by other tag values. The recommended solution was to store the following as file-like objects (‘blobs’) in a store:
The outstanding data kind is system metadata, which included:
This metadata would ideally be stored in a relational database, to facilitate development of improved workflows and more interactive update of the data (e.g., via a web application). However, since metadata is tightly coupled to the data itself and the volume is extremely small, it was stored in tables in the warehouse 1) to support a simpler querying and permissions system, 2) to reduce cost by avoiding the need for maintaining a highly available relational database instance to store only a few kilobytes of data and 3) to avoid distribution of tightly coupled data into two different stores.
Positioning of the sensors (in a frame of reference local to the installed strip) is included in configuration data for each installation, which is registered (along with other metadata like session details) using the Gateway API (see Section 3.4.1). This type of metadata is serialised as JavaScript Object Notation (JSON), validated against a schema8 and stored for future uses such as plotting pressure distributions. Additional measurements (the radius of the node from the rotation axis, the geolocation of the turbine and the shape of the blade section at that radius) are included to enable later conversion of coordinates to blade-local, turbine-local and world coordinate systems as required.
3.4.1.3 Data querying
A python based client was developed, along with a process to supply the user with credentials (a ‘service account’) sufficient for querying the warehouse and object store. The python client encapsulates the more challenging SQL statements required for querying tables in the warehouse - this step is important, because different query implementations can have significant cost implications.9 The python client can be installed on researchers’ personal laptops, within a Colab notebook, and in applications like dashboards to facilitate a universal access to data. To enable working with raw file-like objects, the python client leveraged the file manifesting capability of the Octue SDK (Octue, 2022), enabling the warehouse to be queried for a list of relevant files (e.g., for a time period or experiment session) which can then be opened or downloaded directly (with the mechanics of managing cloud file storage abstracted away from the user).
3.4.2 Models
Physical system models is one of the required resources for the digital system services (see Figure 6). To satisfy the required output 2e, in which measured pressure distributions are compared to the ones obtained from the simulations, the 2D aerofoil sectional models are needed by the forward solvers (see Section 3.4.3). These models can be created by utilising data from several sources external to the Aerosense digital twin such as wind turbine technical documentation, drawings or CAD models. In practice, there are several obstacles for model creation:
To overcome these obstacles in the Aerosense digital twin, a photogrammetry process has been developed to evaluate the position of the sensors and the shape of the blade. The process involves taking videos and photos of the sensor nodes and wind turbine blade from different positions, and reconstructing the 3D shape of the wind turbine blade and obtaining the position of the sensors using triangulation. Detailed drawings or patterns on the housings and some additional speckled tapes make this photogrammetry process more accurate. The requirement on the accuracy was evaluated through the uncertainty quantification procedure described by Marykovskiy et al. (2023c), specifically for the inflow inference problem.
The reconstructed blade shape is further processed by extracting a point-cloud relative to the section of interest, approximating the aerofoil geometry with Bèzier curves, for smoothing and re-sampling. The resulting ordered lists of aerofoil section coordinates can be used directly as inputs to panel-code type forward solvers. As for finite volume method solvers, a Construct 2D Meshing utility was integrated into the model creation pipeline. This software creates structured, high-quality 2D aerofoil meshes. The modified version of the software developed by Fraunhofer IWES10 was wrapped with Octue SDK and implemented as a child-process for the OpenFOAM service.
Additionally to blade sectional models, full wind turbine models for the solvers based on Blade Element Momentum (BEM) method were created during the Aerosense project. The integration of these models and solvers in the Aerosense digital twin was not required by the use case presented in this work. However, these developments were considered for further digital twin developments and improvements to satisfy the use cases discovered during the user-story interviews.
3.4.3 Services
As described in Section 2.3.3, Services, run Models for analysis, provide intermediate data transformation or processing (e.g., from Tier 1 to Tier 2 in Figure 7), or provide applications like dashboards or other monitoring tools. In essence, the services convert ingressed and stored raw data (Section 3.4.1) into the requisite outputs of the use case (Table 1).
Figure 10 presents this process as a co-design problem where for each service its inputs are viewed as resources and its outputs as functionalities. For the sake of clarity, the diagram omits other design parameters such as computational cost (resource), parallelisation possibilities (functionality), and fidelity (functionality). Nevertheless, these aspects should be considered when approaching digital twin design, especially for a digital twin with functionality level of SimulationPrediction and above (see Section 2.2). These considerations in the context of wind turbine twinning often necessitate introduction of surrogate and reduced order models, multi-fidelity and hybrid modeling techniques (Li et al., 2022; Quick et al., 2019; Quick et al., 2022; Renganathan et al., 2020).
3.4.3.1 Service wrappers
To implement a model or a data processor in a digital twin, the code or application must be “wrapped”, enabling it to be deployed to cloud infrastructure and invoked as part of a data pipeline. Commonly, legacy software applications or libraries must be either re-implemented entirely or adapted to meet these requirements. The Octue SDK (Octue, 2022), which embodies Octue’s ‘twined’ framework, was developed for this purpose (with significant work on the framework inspired by the needs of the Aerosense project).
The premise of the framework is as follows:
– inputs (data that will change on a per-analysis basis),
– outputs (data returned as a result),
– configuration (input settings, constants or static data that change on a per-service basis),
– logs (semi-structured textual data reporting progress, warnings and errors)
– monitors (structured numeric data for reporting progress, such as residual values in a CFD calculation or an estimated time remaining)
This system was implemented for each of the models discussed in Section 3.4.2, with an automated deployment process set up so that each subsequent release of code resulted in a new service revision (with corresponding version tag, allowing questions to be routed to specific versions).
3.4.3.2 Service implementations
The digital system Services required by the Aerosense use case for the realisation of the digital twin are the following:
• Data processing algorithms compute derived quantities such as static pressure, pressure coefficient distributions or blade azimuth angle. As shown in Figure 10, to compute pressure coefficient distribution on the aerofoils, measurements from absolute pressure sensors are corrected for sensor drift. Additionally it is necessary to account for the contribution of the atmospheric pressure and hydrostatic pressure variations (Deparday et al., 2023). While atmospheric pressure at the base of the wind turbine is provided by the sensors installed on the base station, the hydrostatic pressure component varies with height. IMU data is proceeded by in-house fusion algorithm (Trummer et al., 2023), to compute the largest deflections of the blade as well as its azimuthal position when rotating, enabling the estimation of hydrostatic pressure.
• Inverse problem solvers infer quantities including the angle of attack and farfield wind speed. Differential pressure measurements, once processed, are used by the inference service as input for the hybrid model, based on the inviscid flow theory (Marykovskiy et al., 2023c). Farfield wind speed is used to estimate dynamic pressure contribution in pressure coefficient calculations and along with angle of attack is used as an input to forward solvers.
– OpenFOAM12 and XFOIL13 produce simulated data for the purpose of comparison with measured quantities, as required by the use case. To integrate these solvers with Octue SDK, xfoil-python14 and pyFoam15 python-based software wrapers were used. Additionally these solvers, along with their automated workflow and data pipelines can be dual-purposed to also generate large synthetic data sets. These are then used to train machine learning algorithms and perform uncertainty quantification. This provides a bridgehead for further digital twin system augmentation with new algorithms and analysis tools.
– OpenFAST16 (with TurbSim) software was used to generate an inflow data and perform aeroelastic simulations with AVENTA AV-7 wind turbine model. A python package openfast_toolbox17 was used to provide an intermediate integration layer between OpenFAST and OctueSDK.
4 Application and results
4.1 Test set-up
After some initial tests of the robustness of the housings and the power consumption of the Aerosense system (Polonelli et al., 2023a), a field test campaign was carried out with the final Aerosense prototype (Figure 11). As mentioned in Section 2.3.1, the design specifications enable the use of the system on multi-Megawatt scale wind turbines. However, for practical and cost considerations, these initial field tests were performed on a 6 kW Aventa wind turbine. The turbine delivers 10-min averaged SCADA data including the active power, the nacelle wind speed and wind direction, the blade pitch angle and the generator temperature. The sensor node was installed at a radial position of 74% of the blade length (6.7 m from the centre of rotation) on one blade. It is shown attached to the blade in Figure 11A. Several measurement campaigns were carried out between July 2022 and April 2023; however, with several improvements being made to the hardware and firmware. This results in several weeks of useable barometer, differential pressure sensor, microphone, and IMU data during this time, which is available in Marykovskiy et al. (2023b). All the samples are timestamped with UTC time. Wind turbine, sensor location and sensor properties metadata is provided as JSON files. The wind turbine metadata follows the WindIO schema and the pressure sensor locations metadata follows the Aerosense sensor geometry schema. The pressure sensor locations were calculated as described in Section 3.4.2 with a photogrammetry process18, reconstructing the sensor node and the blade shape, as demonstrated in Figure 11B. An accuracy in the order of 1 mm was achieved, enabling accurate positioning of the aforementioned sensors and the use of this information in post-processing or transformation of measurement data.
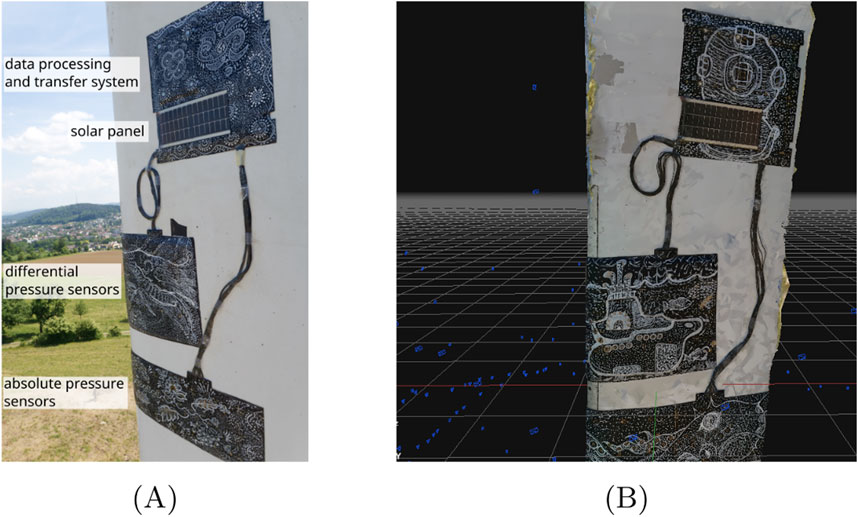
Figure 11. View of the sensor node installed in the field. (A) The Aerosense node installed on the Aventa turbine, (B) 3D reconstruction of the installed sensor node.
4.2 Digital twin demonstration
The field test allowed us to demonstrate the value of the use case introduced in Section 2.1 according to the outputs in Table 1. As described in the aforementioned section, the two main modes to use and analyse the data are the dashboard and the Colab notebooks. Here, we limit the demonstration to these two functionalities of the digital twin, while the detailed analysis of the data itself merits a separate study to thoroughly explore the insights gained from the field tests.
4.2.1 Dashboard
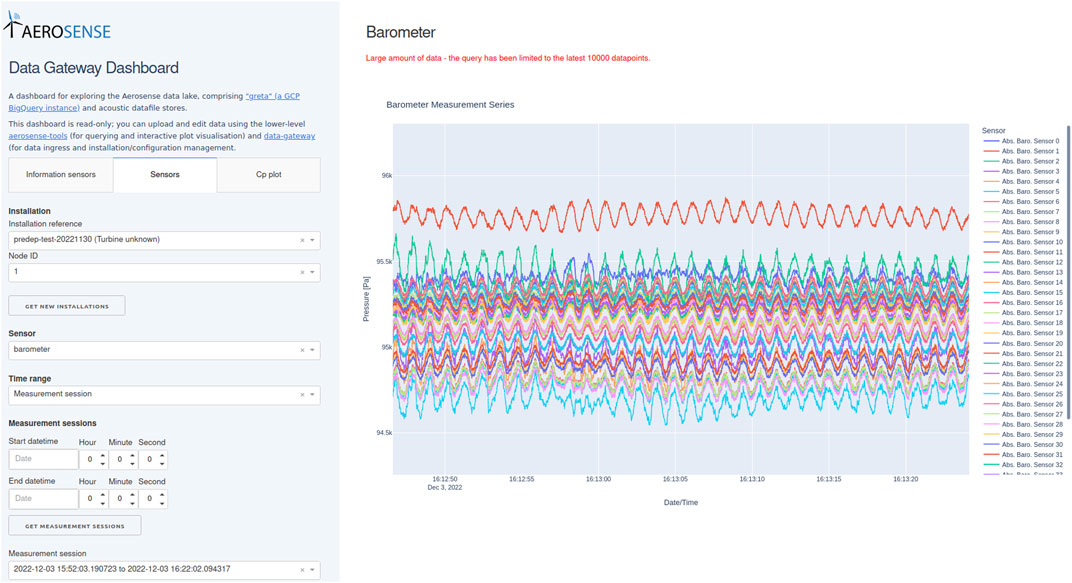
The dashboard displays times series for each sensor, classified in different installations of the Aerosense measurement system, as shown in Figure 12 for pressure data from the barometers. Specific sensor types and measurements periods can be selected. No data needs to be downloaded or specific code to be computed to obtain an initial data inspection of measurement data. This fulfils the output 1a of Table 1. The dashboard can also display pressure coefficient distribution plots for an immediate visualisation relative to specific time instances. This functionality enables the verification of the physical plausibility of pressure data recorded by the measurement system and a general understanding of the aerodynamic behaviour at specific time instants. The synchronisation time of the dashboard plots to the on-site measurements is under 1 hour, allowing for quasi-real time monitoring. This fulfils the output 2a and 2b of Table 1.
4.2.2 Colab notebooks
The Colab notebooks developed within this work allow users to perform detailed analyses, such as extracting data and plotting pressure distributions. This is achieved without the need to write a new code that works with the downloaded data. The versatility of the Colab notebook allows more complex analyses, for example, based on conditional averaging with specific weather conditions in a large time period or for specific azimuthal position of the blade. The Colab notebook enables, for example, the comparison of data from multiple wind turbine installations. This fulfils the output 1b of Table 1.
Phase-averaged pressure and pressure coefficient distributions at different operating conditions can be computed and analysed in the Colab notebook. This allows, for example, a more detailed analysis of the pressure distribution depending on the azimuth position of the rotor blade for different operating conditions (output 2b from Table 1) It also enables direct comparisons with data from the customer, for instance measured or simulated 2D pressure coefficient distributions (output 2c). Furthermore, phase-averaged pressure distribution can also be directly compared to pressure distributions obtained from XFOIL simulations for given inflow conditions, as illustrated in Figure 13 (output 2e). This figure depicts phase-averaged pressure distributions at different rotor blade azimuth positions (indicated by the colour of the points) for a 1-min time interval when wind directions and wind speeds were considered stable. They are compared to XFOIL simulations for two inflow conditions. The inflow conditions were computed using the Aerofoil inference model (Marykovskiy et al., 2023c) available in the Python package used by the Colab notebook (output 2d). Figure 13 illustrates that the local wind speed and corresponding angle of attack differ at different positions on the blade when rotating. This may be due to non-uniformity of the wind or yaw misalignment of the wind turbine. These findings can facilitate a more comprehensive understanding of the aerodynamic behaviour of the wind turbine in operational conditions, as well as to recommendations for the improvement of aerodynamic models.
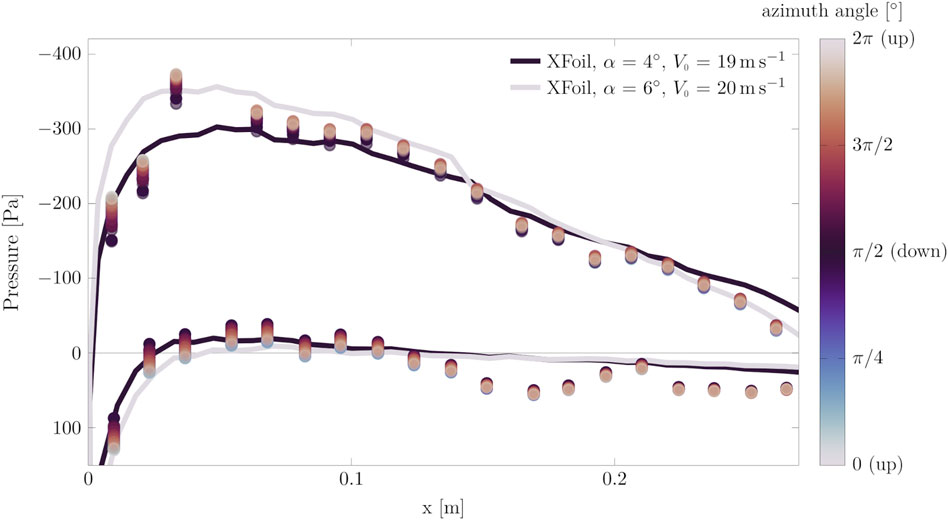
Figure 13. Aerosense Colab notebooks produced plot. Phase-averaged pressure distributions at different rotor blade azimuth position for a 1-min time interval when wind directions and wind speed were stable. Comparison with XFOIL simulation results.
5 Discussion
In this work, we have seen that the development of digital twins in the wind energy context primarily represents a characteristic system engineering problem. In this discussion, we summarise the main challenges we experienced in this project, followed by an evaluation of the methodologies used to overcome these challenges. Finally, we discuss how the results can be useful for wider applications. This presents domain experts with questions, which can often lie outside their primary expertise. The main challenges encountered when architecting the Aerosense digital twins were found to be:
The authors believe these challenges are not unique to the Aerosense project, and the methods presented in this work can also be applied in the development of digital twins with different applications and different twinned physical systems, including the multi-Megawatt scale wind turbines. This methodological approach to digital twin design, in fact, becomes even more crucial for the successful technology implementation as the complexity of twinned systems increases, and the use cases require integration of signals from increased number of sensors and analyses resulting from multi-scale and multi physics models. In the next sections, we evaluate the success of our use of the design thinking, design patterns, decision trees and applied category theory methodologies to overcome these challenges.
5.1 Design thinking for digital twins
The main focus of the design thinking methodology in this work was on the “Empathise” phase, in which “user stories” were explored in order to then define the foundational use case that was used as a basis for the design of the Aerosense digital twin. It proved as essential tool for providing the required amount of focus to then apply the design patterns methodology, as discussed below. Furthermore, a range of other use cases were defined, which could be used to further develop the present solution.
5.2 Design patterns for digital twins
In the Aerosense project, when approaching the development of the digital twin from a systems architecture perspective, the authors adopted well-established twin types as well as common conceptualisation schemes such as the 5-dimension digital twin model. These conceptual models have provided an initial indication on the overall design patterns, to serve as a blueprint for further development. Currently, “the catalogue” of solution patterns is rather limited and only a few digital twin type definitions are commonly accepted and recognised across engineering domains. A more fine-grained and widely accepted digital twin classification can facilitate more streamlined digital twin development by applying proven methodologies. Additionally, this approach opens avenues for collaborative innovation. By utilising a classification system that is acknowledged across industries, future digital twin projects can increase interoperability and knowledge exchange, thus gaining access to otherwise untapped resources.
Furthermore, the use of a standardised classification schemes aids in documenting and communicating the functionality and scope of digital twins more effectively, both within and across industries. This not only enhances the visibility of research outcomes but also aids in selection and adoption of technical solutions, making them more accessible to domain experts from different sectors, and facilitating cross-domain knowledge transfer. An example of such knowledge transfer is the adoption of digital twin technology innovations in the manufacturing sector by the wind energy domain, where the principles of operational efficiency and predictive maintenance are equally valuable.
5.3 Applied category theory and co-design framework for digital twins
During the design of individual system components, the discussion centered around the component assemblies and their physical boundaries, rather than conceptual division into physical, digital and connection systems. This type of compositional thinking finds its fundamental basis in category theory. Co-design formalisation originally proposed by Zardini et al. (2021) in the context of robotics and autonomous systems also lends itself to the digital twin development. The theoretical grounding of this framework serves as means of knowledge representation for functional and resource requirements for a given digital twin, its components or component assemblies. Additionally, this formal basis allows for multiple solution searches and optimisations as a twin evolves to include new uses cases or technology implementations.
6 Conclusion
In this paper the authors approached the design, development, and deployment of digital twin from a system engineering perspective, to architect the Aerosense system for aerodynamic monitoring of wind turbine blades.
The Aerosense system use case and requirements (Section 2.1) were adopted in Section 2.2, leading to characterisation of the particular digital twin with a “Simulation/Prediction” functionality, “Digital Shadow” connectivity, and being at “Instance” physical system lifetime stage. By undertaking the same classification process for prospective digital twins, readers can understand whether the technology solutions used in this work are appropriate for reuse to accelerate their own project(s).
Casting the design of the digital twin into a co-design formalism of applied category theory (Section 3.1), proved instrumental for obtaining desired twin functionalities and affronting interdisciplinary challenges.
The technology solutions form a fully-tested, production-ready data system for turbine blade data collection, cloud ingress, data lakehouse storage and access/use. Both software and hardware solutions have been developed and published as open source (together with documentation) to provide a complete implementation example.
The Aerosense digital twin brings this all together to provide an out-of-the-box solution to monitoring wind turbines in the field, collecting blade sensor data for research purposes and augmenting that data with simulations to form a digital twin of the type classification described above.
Data availability statement
The datasets presented in this study can be found in online repositories. The names of the repository/repositories and accession number(s) can be found below: https://doi.org/10.34808/ypae-8684.
Author contributions
YM: Conceptualization, Data curation, Investigation, Methodology, Software, Visualization, Writing–original draft, Writing–review and editing. TC: Conceptualization, Investigation, Methodology, Software, Visualization, Writing–original draft, Writing–review and editing. JD: Investigation, Software, Visualization, Writing–original draft, Writing–review and editing. EC: Resources, Supervision, Writing–review and editing. SB: Conceptualization, Funding acquisition, Investigation, Methodology, Resources, Supervision, Writing–original draft, Writing–review and editing.
Funding
The author(s) declare that financial support was received for the research, authorship, and/or publication of this article. This work is funded by the BRIDGE Discovery Programme of the Swiss National Science Foundation and Innosuisse, project number 40B2-0_187087. Open access funding by ETH Zurich.
Acknowledgments
Thanks to Justin Lydement and Ueli Spalinger for their support with the field and wind tunnel tests. We also warmfully thank the team at IWK at OST led by Pr. Pierre Jousset who helped us to develop and manufacture the encapsulation of the sensor nodes.
Conflict of interest
Author TC was employed by Octue Ltd.
The remaining authors declare that the research was conducted in the absence of any commercial or financial relationships that could be construed as a potential conflict of interest.
The author(s) declared that they were an editorial board member of Frontiers, at the time of submission. This had no impact on the peer review process and the final decision.
Publisher’s note
All claims expressed in this article are solely those of the authors and do not necessarily represent those of their affiliated organizations, or those of the publisher, the editors and the reviewers. Any product that may be evaluated in this article, or claim that may be made by its manufacturer, is not guaranteed or endorsed by the publisher.
Footnotes
1https://iea-wind.org/task47/, last access: 01 March 2024.
2For example, each of the subsystems mentioned contains elements that conceptually would be considered a connection system, but a coarser classification based on the purpose of each subsystem results in a clearer discussion.
3More information about the Aventa AV-7 wind turbine can be found at https://doi.org/10.5281/zenodo.8192149
4According to Tao et al. (2019), connections within the digital system - such as messaging queues and data pipelines within the cloud infrastructure - would be part of the “Connection System”. However, since these are such fundamental components of the data system and services architecture, their design is discussed as a part of the cloud infrastructure and digital system for the purposes of this work.
5https://github.com/aerosense-ai/data-gateway, last access: 01 March 2024.
6The endpoints are designed with a RESTful pattern of GET, POST, PUT requests.
7Whilst exact specifications of sensors and related equipment were not known a priori, the stated initial objectives of the project allowed good estimation of the type and volume of data early in the project.
8https://jsonschema.registry.octue.com/aerosense/sensor-coordinates/0.1.4.json, last access: 01 March 2024.
9In practice, an iterative process revealed which queries were most cost-intensive then either the queries modified or the database re-clustered to perform more efficiently.
10https://gitlab.cc-asp.fraunhofer.de/iwes-cfsd-public/wtrb-aerodynamics/c2d-ext, last access: 01 March 2024.
11https://json-schema.org/last access: 01 March 2024.
12https://openfoam.org/, last access: 01 March 2024.
13https://web.mit.edu/drela/Public/web/xfoil/, last access: 01 March 2024.
14https://github.com/DARcorporation/xfoil-python, last access: 01 March 2024.
15http://openfoamwiki.net/index.php/Contrib_PyFoam, last access: 01 March 2024.
16https://www.nrel.gov/wind/nwtc/openfast.html, last access: 01 March 2024.
17https://github.com/OpenFAST/openfast_toolbox, last access: 01 March 2024.
18https://sketchfab.com/3d-models/aventa-blade-2ebed0e05e0e4c3c95a7308af3a494d3, last access: 01 March 2024.
References
Abdallah, I., Duthé, G., Barber, S., and Chatzi, E. (2022). Identifying evolving leading edge erosion by tracking clusters of lift coefficients. J. Phys. Conf. Ser. 2265, 032 089. doi:10.1088/1742-6596/2265/3/032089
Arista, R., Zheng, X., Lu, J., and Mas, F. (2023). An Ontology-based Engineering system to support aircraft manufacturing system design. J. Manuf. Syst. 68, 270–288. doi:10.1016/j.jmsy.2023.02.012
Augustyn, D., Ulriksen, M. D., and Sørensen, J. D. (2021). Reliability updating of offshore wind substructures by use of digital twin information. Energies 14, 5859. doi:10.3390/en14185859
Bangga, G., Weihing, P., Lutz, T., and Krämer, E. (2017). Effect of computational grid on accurate prediction of a wind turbine rotor using delayed detached-eddy simulations. J. Mech. Sci. Technol. 31, 2359–2364. doi:10.1007/s12206-017-0432-6
Barber, S., Deparday, J., Marykovskiy, Y., Chatzi, E., Abdallah, I., Duthé, G., et al. (2022). Development of a wireless, non-intrusive, MEMS-based pressure and acoustic measurement system for large-scale operating wind turbine blades. Wind Energy Sci. 7, 1383–1398. doi:10.5194/wes-7-1383-2022
Branlard, E., Giardina, D., and Brown, C. S. D. (2020). Augmented Kalman filter with a reduced mechanical model to estimate tower loads on a land-based wind turbine: a step towards digital-twin simulations. Wind Energy Sci. 5, 1155–1167. doi:10.5194/wes-5-1155-2020
Clark, T. H., and Lugg, M. (2022). From blade to BigQuery: a case study, doi:10.5281/zenodo.10925800
Clifton, A., Barber, S., Bray, A., Enevoldsen, P., Fields, J., Sempreviva, A. M., et al. (2023). Grand challenges in the digitalisation of wind energy. Wind Energy Sci. 8, 947–974. doi:10.5194/wes-8-947-2023
D’Amico, R. D., Erkoyuncu, J. A., Addepalli, S., and Penver, S. (2022). Cognitive digital twin: an approach to improve the maintenance management. CIRP J. Manuf. Sci. Technol. 38, 613–630. doi:10.1016/j.cirpj.2022.06.004
Deparday, J., Marikovskiy, Y., Polonelli, T., Clark, T., and Barber, S. (2023). How to analyse blade aerodynamics on an operating wind turbine with low-cost pressure sensors?. doi:10.5281/zenodo.7974881
Deparday, J., Müller, H., Polonelli, T., and Barber, S. (2022). An experimental system to acquire aeroacoustic properties on wind turbine blades. J. Phys. Conf. Ser. 2265, 022 089. doi:10.1088/1742-6596/2265/2/022089
Duthé, G., Abdallah, I., Barber, S., and Chatzi, E. (2021). Modeling and monitoring erosion of the leading edge of wind turbine blades. Energies 14, 7262. doi:10.3390/en14217262
Duthé, G., Abdallah, I., Barber, S., and Chatzi, E. (2023). Graph neural networks for aerodynamic flow reconstruction from sparse sensing. arXiv preprint arXiv:2301.03228. doi:10.48550/arXiv.2301.03228
Fischer, R., Mueller, H., Polonelli, T., Benini, L., and Magno, M. (2021). “WindNode: a long-lasting and long-range Bluetooth wireless sensor node for pressure and acoustic monitoring on wind turbines,” in 2021 4th IEEE international conference on industrial cyber-physical systems (ICPS) (IEEE), 393–399.
Fong, B., and Spivak, D. I. (2018). Seven sketches in compositionality: an invitation to applied category theory, doi:10.48550/ARXIV.1803.05316
Gamma, E., Helm, R., Johnson, R., and Vlissides, J. (1994). “Design patterns: elements of reusable object-oriented software,” in Addison-wesley professional computing series. Reading, MA: Pearson Education.
Grieves, M. (2022). Intelligent digital twins and the development and management of complex systems. Digit. Twin 2, 8. doi:10.12688/digitaltwin.17574.1
Grieves, M., and Vickers, J. (2017). “Digital twin: mitigating unpredictable,” in Undesirable emergent behavior in complex systems. Cham: Springer International Publishing, 85–113. doi:10.1007/978-3-319-38756-7_4
Hines, E. M., Baxter, C. D., Ciochetto, D., Song, M., Sparrevik, P., Meland, H. J., et al. (2023). Structural instrumentation and monitoring of the block island offshore wind farm. Renew. Energy 202, 1032–1045. doi:10.1016/j.renene.2022.11.115
Kritzinger, W., Karner, M., Traar, G., Henjes, J., and Sihn, W. (2018). Digital Twin in manufacturing: a categorical literature review and classification. IFAC-PapersOnLine 51, 1016–1022. 16th IFAC Symposium on Information Control Problems in Manufacturing INCOM 2018. doi:10.1016/j.ifacol.2018.08.474
Le Franc, Y., Parland-von Essen, J., Bonino, L., Lehväslaiho, H., Coen, G., and Staiger, C. (2020). D2.2 FAIR semantics: first recommendations, doi:10.5281/zenodo.3707985
Li, K., Kou, J., and Zhang, W. (2022). Deep learning for multifidelity aerodynamic distribution modeling from experimental and simulation data. AIAA J. 60, 4413–4427. doi:10.2514/1.J061330
Lone, E. N., Sauder, T., Larsen, K., and Leira, B. J. (2022). Probabilistic fatigue model for design and life extension of mooring chains, including mean load and corrosion effects. Ocean. Eng. 245, 110396–396. doi:10.1016/j.oceaneng.2021.110396
Lugg, M., Marykovskiy, Y., and Clark, T. (2023). Aerosense-ai/aerosense-tools: AeroSense operational twin alpha. doi:10.5281/zenodo.8084257
Madsen, H. A., Bertagnolio, F., Fischer, A., Bak, C., and Paulsen, U. S. (2016). A novel full scale experimental characterization of wind turbine aero-acoustic noise sources.
Marykovskiy, Y., Abdallah, I., Barber, S., and Chatzi, E. (2023a). Extended taxonomy of digital twins. doi:10.5281/zenodo.8021787
Marykovskiy, Y., Clark, T., Day, J., Wiens, M., Henderson, C., Quick, J., et al. (2024). Knowledge engineering for wind energy. Wind Energ. Sci. 9, 883–917. doi:10.5194/wes-9-883-2024
Marykovskiy, Y., Deparday, J., Abdallah, I., and Barber, S. (2023b). AeroSense measurements: Aventa AV-7 Taggenberg winter 2022-2023 campaign. doi:10.34808/ypae-8684
Marykovskiy, Y., Deparday, J., Abdallah, I., Duthé, G., Barber, S., and Chatzi, E. (2023c). Hybrid model for inflow conditions inference on airfoils under uncertainty. AIAA J. 61, 4913–4925. doi:10.2514/1.J063108
Polonelli, T., Moallemi, A., Kong, W., Müller, H., Deparday, J., Magno, M., et al. (2023b). A self-sustainable and micro-second time synchronised multi-node wireless system for aerodynamic monitoring on wind turbines. IEEE Access, 1–18. doi:10.1109/ACCESS.2023.3327422
Polonelli, T., Müller, H., Kong, W., Fischer, R., Benini, L., and Magno, M. (2023a). Aerosense: a self-sustainable and long-range Bluetooth wireless sensor node for aerodynamic and aeroacoustic monitoring on wind turbines. IEEE Sensors J. 23, 715–723. doi:10.1109/JSEN.2022.3224307
Quick, J., Hamlington, P. E., King, R., and Sprague, M. A. (2019). Multifidelity uncertainty quantification with applications in wind turbine aerodynamics, doi:10.2514/6.2019-0542
Quick, J., King, R. N., Barter, G., and Hamlington, P. E. (2022). Multifidelity multiobjective optimization for wake-steering strategies. Wind Energy Sci. 7, 1941–1955. doi:10.5194/wes-7-1941-2022
Renganathan, S. A., Harada, K., and Mavris, D. N. (2020). Aerodynamic data fusion toward the digital twin paradigm. AIAA J. 58, 3902–3918. doi:10.2514/1.J059203
Schepers, J. G., and Schreck, S. J. (2019). Aerodynamic measurements on wind turbines. Wiley Interdiscip. Rev. Energy Environ. 8, e320. doi:10.1002/wene.320
Singh, S., Shehab, E., Higgins, N., Fowler, K., Reynolds, D., Erkoyuncu, J. A., et al. (2021). Data management for developing digital twin ontology model. Proc. Institution Mech. Eng. Part B J. Eng. Manuf. 235, 2323–2337. doi:10.1177/0954405420978117
Tao, F., Zhang, M., Liu, Y., and Nee, A. (2018). Digital twin driven prognostics and health management for complex equipment. CIRP Ann. 67, 169–172. doi:10.1016/j.cirp.2018.04.055
Tao, F., Zhang, M., and Nee, A. (2019). “Chapter 3 - five-dimension digital twin modeling and its key technologies,” in Digital twin driven smart manufacturing. Editors F. Tao, M. Zhang, and A. Nee (Academic Press), 63–81. doi:10.1016/B978-0-12-817630-6.00003-5
Tekinerdogan, B., and Verdouw, C. (2020). Systems architecture design pattern catalog for developing digital twins. Sensors 20, 5103. doi:10.3390/s20185103
Troldborg, N., Bak, C., Madsen, H. A., and Skrzypinski, W. (2013). DANAERO MW: Final Report. E No. 0027(EN). Roskilde, Denmark: DTU Wind Energy.
Trummer, P., Polonelli, T., Deparday, J., Abdallah, I., and Magno, M. (2023). “Blade position and motion estimation on the surface of a rotating wind turbine through a single MEMS IMU,” in 2023 9th international workshop on advances in sensors and interfaces (IWASI), 40–45. doi:10.1109/IWASI58316.2023.10164363
W3C (2009). SKOS simple knowledge organization system reference: W3C reccomendation. Available at: https://www.w3.org/TR/skos-reference/ (Accessed February 01, 2024).
Wagg, D. J., Worden, K., Barthorpe, R. J., and Gardner, P. (2020). Digital twins: state-of-the-art and future directions for modeling and simulation in engineering dynamics applications. ASCE-ASME J Risk Uncert Engrg Sys Part B Mech Engrg 6, 030901. doi:10.1115/1.4046739
Welte, T. M., Sperstad, I. B., Sørum, E. H., and Kolstad, M. L. (2017). Integration of degradation processes in a strategic offshore wind farm O&M simulation model. Energies 10, 925. doi:10.3390/en10070925
Zardini, G., Milojevic, D., Censi, A., and Frazzoli, E. (2021). “Co-Design of embodied intelligence: a structured approach,” in IEEE/RSJ International Conference on Intelligent Robots and Systems (IROS), Prague, Czech Republic, 27 September 2021 - 01 October 2021, 7536–7543. doi:10.1109/IROS51168.2021.9636513
Keywords: digital twin, wind turbine rotor blade, monitoring, design development and implementation, systems engineering, taxonomy, digital shadow, co-design
Citation: Marykovskiy Y, Clark T, Deparday J, Chatzi E and Barber S (2024) Architecting a digital twin for wind turbine rotor blade aerodynamic monitoring. Front. Energy Res. 12:1428387. doi: 10.3389/fenrg.2024.1428387
Received: 06 May 2024; Accepted: 21 October 2024;
Published: 11 November 2024.
Edited by:
Davide Astolfi, University of Brescia, ItalyReviewed by:
Prosun Roy, University of Wisconsin–Platteville, United StatesFrancesco Castellani, University of Perugia, Italy
Copyright © 2024 Marykovskiy, Clark, Deparday, Chatzi and Barber. This is an open-access article distributed under the terms of the Creative Commons Attribution License (CC BY). The use, distribution or reproduction in other forums is permitted, provided the original author(s) and the copyright owner(s) are credited and that the original publication in this journal is cited, in accordance with accepted academic practice. No use, distribution or reproduction is permitted which does not comply with these terms.
*Correspondence: Sarah Barber, c2FyYWguYmFyYmVyQG9zdC5jaA==; Yuriy Marykovskiy, eXVyaXkubWFyeWtvdnNraXlAb3N0LmNo
 Yuriy Marykovskiy
 Thomas Clark3
 Eleni Chatzi
 Sarah Barber