- State Grid Zhejiang Electric Power Co., Ltd., Shaoxing Power Supply Company, Shaoxing, Zhejiang, China
Traditional photovoltaic (PV) forecasting methods often overlook the impact of the correlation between different power fluctuations and weather factors on short-term forecasting accuracy. To address this, this paper proposes a PV output forecasting method based on Variational Mode Decomposition (VMD) disturbance feature extraction and the WaveNet model. First, to extract different feature variations of the output and enhance the model’s ability to capture PV power fluctuation details, VMD is used to decompose the PV output time series, obtaining IMFs modes representing output disturbances and quasi-clear sky IMF modes. Then, to reveal power changes, especially the underlying patterns of disturbances and their relationship with weather factors, K-means clustering is applied to the IMF modes representing output disturbances, clustering the disturbance IMFs into different power change feature clusters. This is combined with Spearman correlation analysis of weather factors and the construction of an experimental dataset. Finally, to enhance the model’s learning ability and improve short-term output forecasting accuracy, the WaveNet model is employed during the forecasting phase. Separate WaveNet models are constructed and trained with the corresponding datasets, and the total PV output forecast is obtained by superimposing the predictions of different IMF modes. Experimental results are compared with traditional methods, demonstrating a significant improvement in forecasting accuracy, with a Mean Absolute Percentage Error (MAPE) error of 6.94%, highlighting the effectiveness of our method and providing strong technical support for the refined management and intelligent forecasting of PV energy.
1 Introduction
As a clean and renewable energy source, PV power generation plays an increasingly important role in the global energy transition and the development of renewable energy. Traditional PV output prediction methods mainly rely on artificial intelligence methods and numerical weather forecasting to predict future PV output. However, changes in lighting conditions often have a significant impact on the output time series, especially in cases of abrupt changes in short-term lighting due to weather variations, resulting in large fluctuations in PV power. In recent years, researchers have actively explored various methods to predict PV output accurately and anticipate power fluctuations. With the advancement of computer technology, data-driven artificial intelligence algorithms have been widely applied in PV power prediction (Miao et al., 2023; Dong et al., 2024).
For short-term PV forecasting, literature (Dong et al., 2023) introduced a method based on the Improved Grey Wolf Optimization (IGWO) algorithm and Spiking Neural Network (SNN) for short-term PV output prediction. In the field of ultra-short-term PV power forecasting based on deep learning, Raiker proposed an ultra-short-term PV power forecasting model based on optimal frequency-domain decomposition and deep learning. The model uses convolutional neural networks to predict the low-frequency and high-frequency components separately, and then reconstructs the final prediction result through addition, significantly improving prediction accuracy and time efficiency (Raiker et al., 2021). Addressing the issue of data quality dependence in PV power model prediction, another literature (Wang et al., 2022) proposed a combination prediction method for ultra-short-term PV power generation by integrating Singular Spectrum Analysis and Local Emotion Reconstruction Neural Network. Recognizing the tendency of traditional Extreme Learning Machines to fall into local optimums and the characteristics of environmental changes causing PV output fluctuations, literature (Cheng et al., 2023) constructed a PV output short-term prediction model by employing an Adaptive Noise Complete Ensemble Empirical Mode Decomposition (CEEMDAN) algorithm combined with chimp optimization algorithm (Ceyhun and Hakan, 2021; Leiming et al., 2023) to optimize the Extreme Learning Machine neural network (Muqaddas et al., 2022). Utilizing the CEEMDAN algorithm, critical environmental factors affecting PV output power are decomposed to obtain local features of data signals at different time scales, reducing the non-stationarity of environmental factor sequences. Then, each decomposed subsequence and historical PV data sequence are used as inputs to the Extreme Learning Machine prediction model optimized by the chimp optimization algorithm for prediction. To address the incompleteness in considering the volatility of PV output and meteorological factors, literature (Bian and Sun, 2021) proposed an improved Typical Meteorological Year (TMY) method to generate representative meteorological data. This method constructs a dataset by selecting specific monthly data that best represent long-term average meteorological characteristics. Specifically, it uses metrics like Root Mean Square Error (RMSE) and correlation coefficients to choose the months with the smallest errors and highest correlations, forming a complete TMY dataset. This dataset, combined with the Generalized Regression Neural Network (GRNN) (Zhuang et al., 2019), is used for PV power prediction, thereby improving the accuracy and reliability of the predictions. Another literature (Jin et al., 2024) utilized clustering algorithms to cluster raw data and implemented PV power prediction using Long Short-Term Memory (LSTM) neural networks. They also employed an improved Sparrow Search Algorithm for neural network hyperparameter optimization, achieving optimization for different power feature scenarios. In enhancing the accuracy of PV output interval prediction, literature (Zhang C. et al., 2023) introduced a PV output interval prediction model based on Improved Ensemble Empirical Mode Decomposition and Quasi-Affine Transformation optimized Bidirectional Long Short-Term Memory neural networks (Zhu et al., 2020; Zhang et al., 2024). Additionally, literature (Wu et al., 2023) proposed a support vector machine PV power interval short-term prediction model based on Ensemble Empirical Mode Decomposition and Chaos Ant-Lion Algorithm. In terms of spatial correlation analysis, M. Zhang proposed a short-term solar power forecasting method based on an optimal graph structure that considers surrounding spatio-temporal correlations. This method improves forecasting performance by utilizing spatial information from neighboring photovoltaic stations combined with a graph convolutional network (Zhang M. et al., 2023). In terms of hybrid forecasting methods, X. Zhang proposed a new digital twin (DT) supported PV power prediction framework. This framework ensures reliable data transmission and leverages the advantages of both digital physical models and neural network models, thereby improving prediction accuracy (Zhang X. et al., 2023). In the field of deep learning networks based on satellite cloud images, Cheng proposed a graph learning framework. This framework generates directed graphs by simulating cloud movements and applies a spatio-temporal graph neural network, effectively improving the accuracy of photovoltaic power prediction while reducing image input redundancy (Cheng et al., 2022).
Although the aforementioned methods have achieved promising prediction results, they still have some limitations. Firstly, these methods may not fully capture all the factors affecting PV output when dealing with complex weather conditions and sudden environmental changes. Therefore, it is necessary to enhance the ability to identify weather changes, environmental conditions, and internal noise to more accurately capture the root causes of PV output fluctuations. Secondly, these methods have not deeply studied the characteristics and variation patterns of various output fluctuations. These methods also have not thoroughly considered the correlations between various disturbances and weather factors, resulting in a need for improved prediction accuracy under changing weather conditions. Therefore, there is a need to establish more comprehensive predictive models that consider various factors’ influences to enhance the understanding and predictive ability of PV output fluctuations.
To address the low prediction accuracy of existing PV power prediction techniques and the weak correlation between meteorological factors and power fluctuations, this paper proposes a PV output prediction method based on VMD and WaveNet. Firstly, to extract different feature variations of the output, VMD (Meng et al., 2023; Parri et al., 2024; Wang and Ma, 2024; Yagang et al., 2024) is utilized to decompose the PV output time series, obtaining Intrinsic Mode Functions (IMFs) modes representing output disturbances and quasi-clear sky IMF modes. Subsequently, K-means clustering is applied to the IMFs modes representing output disturbances to cluster the disturbance IMFs into different power change feature clusters (Sleiman and Su, 2024). Spearman correlation analysis is then conducted on different feature clusters combined with weather factors to construct an experimental dataset. Lastly, to enhance the model’s learning ability, a WaveNet model (Pramono et al., 2019; Deng et al., 2022; Wang H. et al., 2023; Wang Y. et al., 2023) is employed in the prediction phase. WaveNet is selected due to its superior capabilities in handling time-series data. It effectively processes long-term dependencies through its dilated convolution structure, captures multi-scale temporal features with its deep convolutional layers, and maintains robustness and stability with residual connections. Moreover, WaveNet’s ability to model non-linear relationships makes it particularly suited for PV output prediction, which involves complex interactions between various factors. Based on the input of the corresponding feature IMF time series and combined with relevant meteorological data, WaveNet models are separately constructed for training and prediction. The predicted results of different IMF modes are then superimposed to obtain the total PV output prediction. The effectiveness and accuracy of the proposed method are validated using historical data from a PV station in Zhejiang, China.
2 Power feature extraction
2.1 VMD power feature decomposition
VMD is a method used for decomposing signals and extracting different frequency features. In this paper, VMD is employed to decompose the PV output time series into different IMFs modes, which reflect varying patterns at different time scales. VMD decomposes the original time series data into multiple IMFs with different frequency characteristics, thereby better representing the feature variations of the output. This facilitates the analysis of quasi-clear sky and output disturbance characteristics, clustering them into feature clusters, laying the foundation for subsequent PV output prediction.
During the VMD decomposition, the sum of the expected bandwidths for each power IMF mode is minimized, with the constraint that the sum of all decomposition modes equals the original output feature signal sequence. The constrained variational problem is formulated as follows (Equation 1):
In the equation, f represents the original time series, δ(t) is the Dirac distribution function, {uk}={u1,…,uk} and {wk}:={w1, … ,wk} are shorthand symbols for all modes and their corresponding center frequencies, respectively. e−jωkt represents the exponential term at the respective center frequency wk for mode uk.
By introducing Lagrange multipliers to transform the inequality constraint into an equality constraint, and then solving the above equation, the solution formula for mode uk can be obtained as follows (Equation 2):
In the equation, α is a quadratic penalty factor used to balance the trade-off between the objective function and the degree of violation of the constraint. By penalizing the constraint, the algorithm is encouraged to converge towards solutions that satisfy the constraint. λ is the Lagrange multiplier operator.
The formula for the center frequency wk is (Equation 3):
In PV output prediction, quasi-clear sky IMFs and output disturbance IMFs have different physical meanings and predictive patterns. Quasi-clear sky IMFs mainly reflect the basic characteristics of PV output under clear sky conditions, while output disturbance IMFs reflect the influence of other factors (such as cloud cover, temperature changes, etc.) on PV output. Separating quasi-clear sky and output disturbance IMFs can allow the prediction model to capture different types of variations more finely, thereby improving prediction accuracy.
2.2 Disturbance IMF clustering
After obtaining the quasi-clear sky IMF and various disturbance IMFs, clustering operations are performed on the disturbance IMFs. K-means is a clustering algorithm (Sleiman and Su, 2024) that partitions data points into different clusters based on their feature similarity. In this paper, K-means is used to cluster the IMFs modes representing PV output disturbances, grouping these modes into different clusters of power change features to better understand and describe the operating characteristics of PV power generation systems. The specific algorithm process is as follows:
1) Initialize the centroids for the disturbance IMF clusters and select the number of clusters, K.
2) Assign samples D and calculate the Euclidean distance between each sample point and the cluster centroids Ci. Find the optimal distance and assign the sample points to the feature clusters corresponding to Ci (Equation 4):
In the equation, Ci represents the ith cluster centroid, m is the dimensionality of the data objects, and Cij denote the jth attribute values of x and Ci, respectively.
3) Update the cluster centroids by computing the mean and squared error of all points in each cluster. Update the centroids and repeat step 2). The calculation formula is as follows (Equation 5):
4) When the cluster centroids no longer change or reach the maximum number of iterations, stop the loop, update the clustering results, and calculate evaluation metrics. For different numbers of clusters K. For the disturbance IMFs, this paper calculates the Davies-Bouldin index (DBI) and the silhouette coefficient index (SC) to select the optimal index and its corresponding number of clusters KK as well as the corresponding clustering situation as the clustering result.
2.3 Spearman correlation analysis
Spearman correlation is a non-parametric method used to measure the monotonic relationship between two variables. It is robust and not influenced by outliers, making it suitable for various types of data analysis, particularly effective in detecting nonlinear relationships.
By employing Spearman correlation analysis, we can assess the degree of association between different IMF feature clusters and weather features. This helps identify which weather factors have a significant impact on different PV output features, aiding in the selection of the most relevant features to guide model construction and prediction processes. The formula for calculating the Spearman correlation coefficient is as follows (Equation 6):
In the equation, ρ represents the Spearman correlation coefficient, di denotes the difference between the ranks of each corresponding pair (i.e., the difference between the rankings of IMF variables and weather feature variables), n is the number of data pairs.
3 WaveNet model
The WaveNet model, based on convolutional neural networks (CNNs) with different structures, is essentially a probabilistic autoregressive model for time series data. It has shown good performance in audio analysis applications, utilizing its strong capability in handling time-series features to improve short-term forecasting effects. In PV prediction, the WaveNet model can effectively capture the temporal features and nonlinear relationships in PV output data, thereby enhancing prediction accuracy and generalization capability.
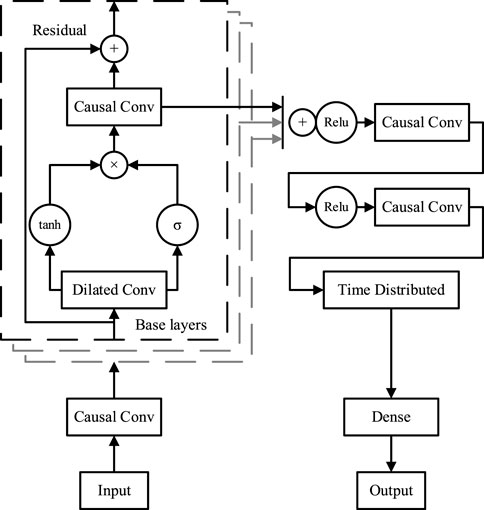
The basic module of WaveNet mainly consists of dilated convolutional structures, residual connections, and gating unit structures, as shown in Figure 1. The input layer uses causal convolutions to preserve the positional information of the model’s time-series feature input, preventing the model from seeing the entire temporal information at once during learning. Its convolutional structure includes causal convolutions and dilated convolutions, connecting convolutional layers with different dilation rates to obtain an ultra-long receptive field, extracting time-series features of different lengths of PV output changes, analyzed by the causal convolutional layers. The computation of the model’s gating units is shown in Equation 7, and the calculation formula for the input-output of a single filter in the dilated convolutional layer is shown in Equation 8.
In the equation, x represents the input time series to the gating unit, Wf and Wg are the corresponding weight parameters for the gating mechanism input.
In the equation, y represents the output of a single filter in the dilated convolutional layer, x(t)x(t) is the time series input to the dilated convolutional layer, f(t) is the filter with a kernel size of k, d is the convolutional dilation rate, and n is the convolutional kernel index.
The complete WaveNet model is formed by stacking multiple basic dilated convolutional layers, which process very long time series data through stacking multiple identical parameterized basic structures. The lower layers of the convolutional structure learn short-term patterns, while long-term patterns are learned by higher layers of convolutional layers. Additionally, a residual network structure is employed to address the problem of gradient vanishing and exploding during training caused by excessive model depth. The model’s output is fused using skip connections, which combine the feature quantities extracted at different convolutional layer levels, and the final prediction result is outputted through multiple causal convolutions.
4 PV output prediction based on WaveNet
Based on the above methods, this paper proposes a PV output prediction method based on VMD disturbance feature extraction and WaveNet model. The structure of the prediction model is shown in Figure 2.
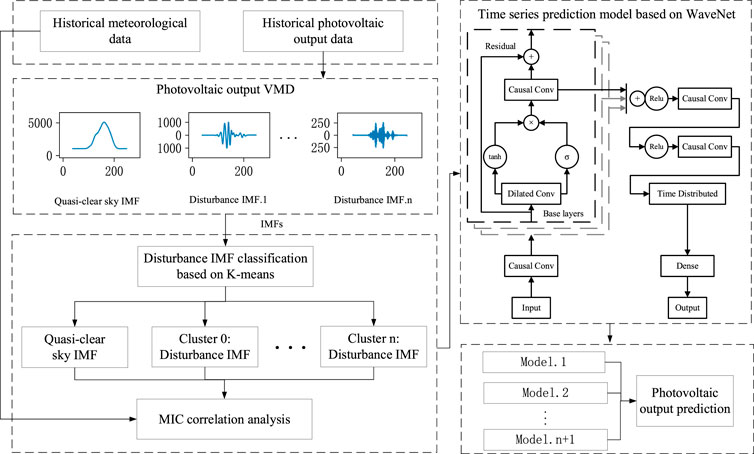
Figure 2. Flowchart of photovoltaic output prediction based on VMD disturbance feature extraction and WaveNet neural network.
First, to extract the different feature changes in the output, this paper adopts VMD to decompose the PV output time series, obtaining the IMFs modes representing output disturbances and quasi-clear sky IMF modes. The input for this stage is the historical PV output data, and the output is the decomposed IMFs modes.
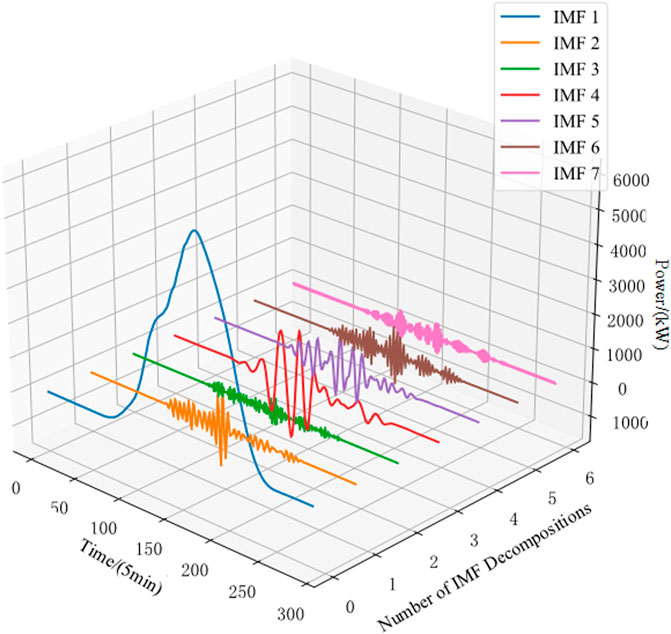
The PV power generation varies rhythmically with the alternation of day and night. During the day, when the sunlight intensity is high, the power generation increases. Conversely, during the night, when the sunlight diminishes, the power generation decreases. This rhythmic variation is an inherent characteristic of PV power generation induced by the rotation and revolution of the Earth. However, sudden changes in meteorological conditions can affect the output power of the PV system, causing irregular fluctuations. By using VMD to extract quasi-clear sky curves and disturbance curves, as shown in Figure 3, this paper reveals that the quasi-clear sky curve reflects the regular changes in the output of the PV system, while the disturbance curve reflects the irregular fluctuations caused by changes in meteorological conditions. By decomposing and analyzing regular and irregular variations, a better understanding of the characteristics and variation patterns of the PV system’s output can be achieved.
Next, the IMFs modes representing the output disturbance are subjected to K-means clustering to cluster the disturbance IMFs according to their power variation characteristics and plot their cluster centroids. The input for this stage is the IMFs modes representing output disturbances, and the output is the clustered disturbance IMFs and their centroids. This clustering method helps capture different types of power fluctuation patterns in the experimental dataset. By analyzing these clustered feature clusters, we can better understand the impact of different types of disturbances on PV output, providing more information and features for subsequent prediction models.
Establishing the experimental dataset is a crucial step in PV output prediction research. The input for this stage is the clustered disturbance IMFs and historical meteorological data, and the output is the experimental dataset for model training and validation. By clustering the disturbance IMFs into different power variation feature clusters and conducting Spearman correlation analysis based on their cluster centroids, optimal weather features for each feature cluster are selected, facilitating the construction of an experimental dataset for model training and validation. In the experimental dataset, each feature cluster represents a type of power fluctuation pattern and contains relevant weather data samples for that pattern. Constructing the dataset in this way helps train the model to better adapt to different types of power variation scenarios.
Finally, to further enhance the model’s learning capability, the WaveNet recurrent neural network is employed in the prediction stage. The input for this stage is the experimental dataset consisting of feature IMF time series data and relevant meteorological data, and the output is the predicted PV output for each IMF mode. By combining the corresponding feature IMF time series data with relevant meteorological data, a WaveNet model is constructed for training and prediction. WaveNet is a convolutional neural network structure composed of a series of convolutional layers, each containing multiple convolutional kernels. These kernels have gradually expanding receptive fields, allowing the network to capture rich information at different time scales. During the prediction process, the corresponding feature IMF time series data is combined with relevant meteorological data to train and predict using the WaveNet model. WaveNet can effectively handle time series data and extract important feature information, aiding in better understanding the spatiotemporal structure and related properties of the data. WaveNet itself has strong nonlinear modeling capabilities, capable of capturing complex patterns and regularities in time series data. By employing the WaveNet model in the prediction stage, PV output time series data can be better processed, thereby improving prediction accuracy and generalization capability.
Once the model training is completed, the predicted results of different IMF modes are aggregated to obtain the predicted total PV output. The input for this stage is the predicted outputs of different IMF modes, and the output is the aggregated total predicted PV output. This approach combines the different feature IMF time series data and utilizes the model’s learning capabilities for each IMF, resulting in a more comprehensive prediction of the total output of the PV system, further improving the accuracy and reliability of the prediction results.
5 Case study
To validate the effectiveness of the proposed PV output prediction method based on VMD disturbance feature extraction and WaveNet model, historical data from a PV station in Zhejiang, China, was used as the experimental dataset. The historical PV output data covers the fourth quarter of the year 2022, from 1 October 2022, 0:00 to 31 December 2022, 23:55. The data is sampled at a frequency of 5 min per point, and the output data is in units of watts.
5.1 Evaluation metrics
The forecasting part of the experiment focuses on turbine output prediction. The results are evaluated using RMSE, Mean Absolute Error (MAE), and MAPE as the evaluation metrics. The formulas for these metrics are (Equations 9–11):
In power output prediction,
5.2 Decomposition of output using VMD
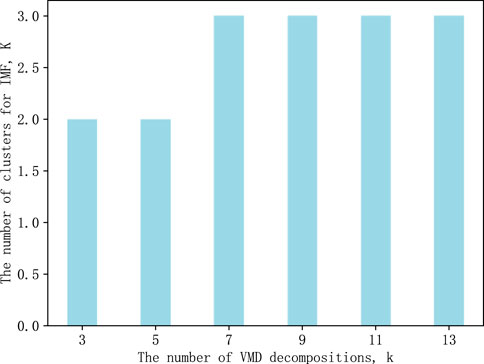
First, the historical output time series is decomposed using VMD to extract and analyze different modes of output variations. In VMD, the parameter α controls the balance between the smoothness of decomposition and the fitting of data. To better fit the data, the experimental setting for the fitting coefficient alpha is set to 10. During the VMD operation, the experiment initially sets the number of modes, k, to 3, 5, 7, 9, 11, etc., and then applies K-means clustering to the obtained disturbance IMFs for different values of k. The number of clustered disturbance IMFs for different values of k is shown in Figure 4.
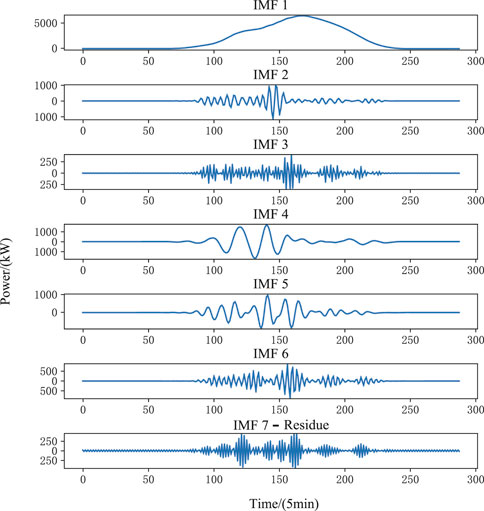
From Figure 4, it can be observed that as the number of VMD decompositions, k, increases, the subsequent clustering numbers stabilize starting from k = 7. It can be seen that increasing the number of decompositions does not change or improve the clustering effect. Therefore, in this experiment, the number of modes, k, is set to 7. The VMD decomposition diagram of the PV output is shown in Figure 5.
According to Figure 5, VMD decomposes the output into seven characteristic IMFs. IMF1 represents the clear-sky curve of the day, reflecting the output curve unaffected by weather conditions. IMF4 and IMF5 represent high-amplitude low-frequency disturbances caused by changes in cloud cover, while IMF2 and IMF6 represent high-amplitude mid-frequency disturbances caused by changes in cloud cover. IMF3 and IMF7 represent low-amplitude high-frequency disturbances caused by changes in cloud cover and the PV system itself. The Residue represents the noise component of the PV system.
5.3 Disturbance IMF clustering
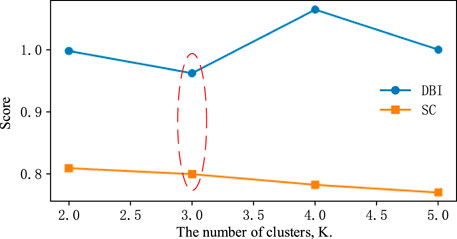
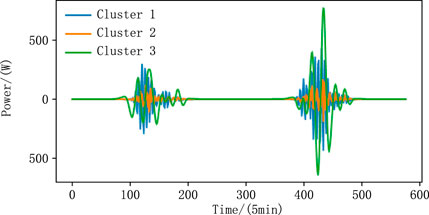
Next, K-means clustering was applied to the disturbance IMF modes excluding the clear-sky IMF. The clustering SC and DBI scores are shown in Figure 6, and the centroids of the clusters are depicted in Figure 7.
According to Figure 6, when K = 3, both the DBI index and SC index are optimal, indicating the best clustering effect. That is, the disturbance IMF is mainly divided into three categories, and the IMF time series data of the same category are used to construct the prediction model for training in subsequent predictions. Figure 7 shows the cluster centroids of the disturbance IMF, and the clustering results are consistent with the conclusions of VMD decomposition. By identifying different disturbance feature classes, the variation patterns and periodic influences of PV power output disturbances can be explored. Combined with historical meteorological data, further analysis of weather change patterns can improve the accuracy of PV power output prediction.
5.4 Spearman correlation analysis
After obtaining the clustering results from K-means, the Spearman correlation analysis was conducted between the class clear-sky IMF curve and the clustering center lines of disturbance clusters 1, 2, and 3, respectively, with historical weather data. The correlation analysis results are shown in Table 1.
From the data in Table 1, it can be analyzed that there is a very high Spearman correlation between the clear sky IMF and irradiance, indicating a significant correlation between the clear sky IMF and irradiance. However, the Spearman correlations between the disturbance IMF clusters 1, 2, and 3 and various meteorological parameters are relatively low, suggesting weak associations between them and the meteorological parameters. Specifically, disturbance IMF cluster 2 has the lowest Spearman correlation coefficients with all meteorological parameters, indicating the weakest connection with each meteorological parameter. In contrast, disturbance IMF cluster 1 shows relatively high Spearman correlations with irradiance and surface temperature, while disturbance IMF cluster 3 exhibits relatively high correlation with humidity, indicating that meteorological factors have the greatest influence on disturbance IMF cluster 3. Based on this analysis, this study selects the optimal meteorological factors for each power cluster to construct the experimental dataset.
5.5 WaveNet prediction model
During the prediction phase, WaveNet prediction models were separately constructed for the class-sunny-day IMF and the power IMFs within each disturbance IMF cluster. Predictions were made for each IMF component, and these predictions were then aggregated to obtain the overall PV power output prediction. In the experiment, the above steps were organized into an experimental dataset. The dataset was divided into training and testing sets, with the last 3 days’ data reserved for testing and the remaining data used for training.
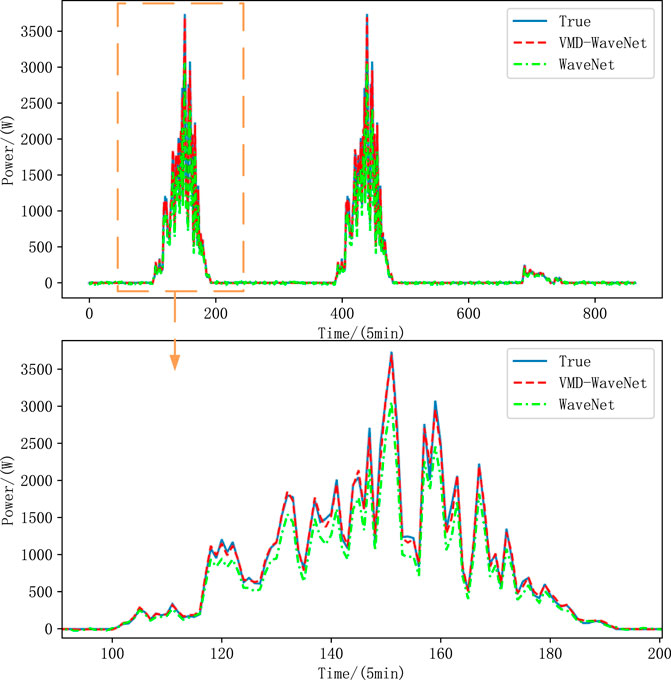
In the comparative experiment, the models were divided into three categories: CNN-based models, RNN-based models, and hybrid models. The reason for selecting these three categories is to comprehensively evaluate the performance of different types of neural networks in PV power output prediction. CNN-based models excel at handling short-term complex fluctuations and can quickly capture local features in time series data; RNN-based models have advantages in dealing with long-term dependencies and can better capture long-term trends in time series data; hybrid models combine the strengths of both CNNs and RNNs, enabling them to handle both short-term fluctuations and long-term trends. Each category included versions with and without VMD decomposition and Spearman correlation analysis. The specific models included: VMD-TCN, VMD-LSTM, VMD-GRU, VMD-CNN-LSTM, VMD-CNN-GRU, VMD-Transformer, and their counterparts without decomposition. Additionally, this study proposed the VMD-WaveNet prediction model. The performance of these models was evaluated by comparing the actual and predicted outputs, as shown in Figure 8, analyzing the performance of different methods in PV power output prediction.
Figure 8 shows the comparison between the actual PV power output (blue solid line) and the predictions from two models: VMD-WaveNet (red dashed line) and WaveNet (green dashed line) over 3 days. The VMD-WaveNet model is closer to the actual values most of the time, especially at the two main peaks around 150 min and 430 min, where it captures the fluctuations in the actual output more accurately, while the WaveNet model shows larger errors at these peaks. The zoomed-in plot further illustrates the details within the 100 to 200 min time period, where the VMD-WaveNet model is closer to the actual values than the WaveNet model, particularly during periods of large fluctuations, demonstrating higher predictive accuracy. At several peaks and troughs, the VMD-WaveNet model better tracks the changes in actual output, whereas the WaveNet model exhibits greater prediction errors at these points. Overall, the VMD-WaveNet model outperforms the WaveNet model in capturing both the overall trend and local fluctuations in PV power output predictions, indicating that the incorporation of VMD decomposition and Spearman correlation analysis significantly enhances the performance of the PV output prediction model.
According to the results in Table 2, CNN-based models such as WaveNet perform well in short-term predictions and can quickly respond to rapid changes in PV power.
Traditional LSTM and GRU models have advantages in handling long-term dependencies. However, models without VMD processing exhibit deficiencies in noise handling and feature extraction, leading to lower prediction accuracy. The RMSE of VMD-LSTM is 88.56W, significantly better than the 183.04W of the undecorated LSTM; similarly, VMD-GRU has an RMSE of 76.93W, compared to the 169.77W of the undecorated GRU, demonstrating the effectiveness of VMD decomposition in these models. Hybrid models such as VMD-CNN-LSTM and VMD-Transformer combine the strengths of CNN and RNN, performing well in handling both short-term fluctuations and long-term trends. The RMSE of VMD-Transformer is 42.09W, better than the 132.31W of the undecorated Transformer, further proving the value of VMD processing.
Compared to other RNN, CNN, and hybrid models, the WaveNet model excels in handling time series data. By utilizing the structure of convolutional neural networks, WaveNet performs exceptionally well in dealing with short-term complex fluctuations and long-term dependencies. Although the prediction accuracy of the WaveNet without VMD processing is slightly inferior to that of VMD-WaveNet, its RMSE is still 75.22W. Notably, the RMSE of WaveNet is the lowest among all models without VMD processing: LSTM has an RMSE of 183.04W, GRU has an RMSE of 169.77W, TCN has an RMSE of 121.86W, and Transformer has an RMSE of 132.31W. This indicates that WaveNet excels in capturing short-term fluctuations and long-term dependencies even without VMD processing, surpassing other traditional RNN and hybrid models, highlighting its advantages in time series data processing.
The VMD-WaveNet model combines the advantages of VMD decomposition with WaveNet’s powerful time series processing capabilities. By extracting features of different frequencies through VMD decomposition and conducting Spearman correlation analysis with meteorological data, it can more accurately capture the short-term fluctuations and long-term trends of PV power output. Figure 8 shows that the VMD-WaveNet model significantly outperforms the undecorated WaveNet model in predicting multiple peaks and valleys, especially near the main peaks at 150 min and 430 min, where the VMD-WaveNet model is closer to the actual values. Additionally, the evaluation metrics in Table 2 further confirm this, with the VMD-WaveNet model achieving an RMSE of 27.01W, an MAE of 10.90W, and a MAPE of 6.94%, all significantly better than other models. This demonstrates that the VMD-WaveNet model, through more refined feature extraction and comprehensive consideration of multiple relevant factors, significantly improves the accuracy and stability of PV output prediction, showing the best predictive performance.
6 Conclusion
The existing short-term forecasting techniques for PV power face challenges such as low prediction accuracy and weak correlation between meteorological factors and power fluctuations. To address these issues, this paper proposes a PV power prediction method based on VMD for disturbance feature extraction and WaveNet model.
To capture the diverse features of PV power output, VMD is applied to decompose the PV power time series into IMFs representing disturbance and clear-sky components. The clear-sky curve reflects regular variations in PV output, while the disturbance curve reflects irregular fluctuations caused by changes in meteorological conditions.
To better understand the impact of different disturbance types on PV output and provide more information and features for the model, the IMFs representing power disturbances are clustered using K-means clustering based on their power change characteristics. Through analysis of these clustered feature clusters and Spearman correlation analysis of weather factors, different types of power fluctuation patterns are explored more accurately, thereby enhancing the predictive performance of the model.
In the prediction stage, a WaveNet model is employed. By combining the corresponding feature IMF time series data with Spearman-correlated meteorological data, a WaveNet model is constructed for training and prediction. The WaveNet model can effectively capture features and patterns in time series data, considering the temporal correlation and non-linear characteristics of the data, thus improving the accuracy and generalization ability of PV power prediction.
In the experimental section, evaluation metrics are computed, and the predicted data from different models are compared with the ground truth data to validate the computational accuracy and effectiveness of the proposed method for PV power prediction. The results demonstrate that the model provides effective predictions of PV power output, thereby supporting operational management of PV stations.
Data availability statement
The original contributions presented in the study are included in the article/Supplementary Material, further inquiries can be directed to the corresponding author.
Author contributions
SZ: Conceptualization, Data curation, Methodology, Software, Writing–original draft, Writing–review and editing. XY: Data curation, Formal Analysis, Funding acquisition, Investigation, Methodology, Resources, Validation, Writing–original draft. KL: Project administration, Software, Validation, Writing–original draft. XL: Formal Analysis, Resources, Validation, Supervision, Writing–original draft, Writing–review and editing. WQ: Formal Analysis, Funding acquisition, Investigation, Resources, Supervision, Visualization, Writing–original draft, Writing–review and editing. XH: Conceptualization, Validation, Investigation, Software, Writing–original draft, Writing–review and editing.
Funding
The author(s) declare that financial support was received for the research, authorship, and/or publication of this article. This work was supported by the Science and Technology Project of State Grid Zhejiang Electric Power Co., Ltd. (B311SX23000C). The funder was not involved in the study design, collection, analysis, interpretation of data, the writing of this article, or the decision to submit it for publication.
Conflict of interest
Authors SZ, XY, KL, XL, WQ, and XH were employed by State Grid Zhejiang Electric Power Co., Ltd., Shaoxing Power Supply Company.
Publisher’s note
All claims expressed in this article are solely those of the authors and do not necessarily represent those of their affiliated organizations, or those of the publisher, the editors and the reviewers. Any product that may be evaluated in this article, or claim that may be made by its manufacturer, is not guaranteed or endorsed by the publisher.
References
Bian, H., and Sun, J. (2021). Prediction model of photovoltaic power generation based on typical meteorological weeks and GRNN. Electr. Power Eng. Technol. 40 (05), 94–99.
Ceyhun, Y., and Hakan, A. (2021). A kernel extreme learning machine-based neural network to forecast very short-term power output of an on-grid photovoltaic power plant. Energy Sources, Part A Recovery, Util. Environ. Eff. 43 (4), 395–412. doi:10.1080/15567036.2020.1801899
Cheng, L., Zang, H., Wei, Z., Ding, T., and Sun, G. (2022). Solar power prediction based on satellite measurements – a graphical learning method for tracking cloud motion. IEEE Trans. Power Syst. 37 (3), 2335–2345. doi:10.1109/tpwrs.2021.3119338
Cheng, Y., Zhuang, F., and Xu, W. (2023). Short-term photovoltaic power output prediction based on improved extreme learning machine. Mod. Electr. Power 40 (05), 679–686.
Deng, Y., Wang, L., Jia, H., Zhang, X., and Tong, X. (2022). A deep learning method based on bidirectional wavenet for voltage sag state estimation via limited monitors in power system. Energies 15 (6), 2273. doi:10.3390/en15062273
Dong, M., Li, X., and Yang, Z. (2024). Research progress on data-driven distributed photovoltaic power prediction methods. Electr. Power Netw. Clean Energy 40 (01), 8–28.
Dong, Z., Zheng, L., and Su, R. (2023). A short-term photovoltaic power output prediction method based on IGWO-SNN. Power Syst. Prot. Control 51 (01), 131–138.
Jin, W., Lu, L., and Lai, H. (2024). Photovoltaic power prediction based on power characteristics of K-ISSA-LSTM. Acta Energiae Solaris Sin. 45 (02), 429–434.
Leiming, S., Tian, P., Shihao, S., Zhang, C., Wang, Y., Fu, Y., et al. (2023). Wind speed prediction by a swarm intelligence based deep learning model via signal decomposition and parameter optimization using improved chimp optimization algorithm. Energy 276, 127526. doi:10.1016/j.energy.2023.127526
Meng, A., Xie, Z., Luo, J., Zeng, Y., Xu, X., Li, Y., et al. (2023). An adaptive variational mode decomposition for wind power prediction using convolutional block attention deep learning network. Energy 282, 128945. doi:10.1016/j.energy.2023.128945
Miao, L., Li, Q., and Jiang, Y. (2023). Application of deep learning in power system forecasting. J. Eng. Sci. 45 (04), 663–672.
Muqaddas, E., Muhammad, H. A., and ChulHwan, K. (2022). An improved partial shading detection strategy based on chimp optimization algorithm to find global maximum power point of solar array system. Energies 15 (4), 1549. doi:10.3390/en15041549
Parri, S., Teeparthi, K., and Kosana, V. (2024). A hybrid methodology using VMD and disentangled features for wind speed forecasting. Energy 288, 129824. doi:10.1016/j.energy.2023.129824
Pramono, S. H., Rohmatillah, M., Maulana, E., Hasanah, R. N., and Hario, F. (2019). Deep learning-based short-term load forecasting for supporting demand response program in hybrid energy system. Energies 12 (17), 3359. doi:10.3390/en12173359
Raiker, G. A., Loganathan, U., and Reddy B., S. (2021). Current control of boost converter for PV interface with momentum-based perturb and observe MPPT. IEEE Trans. Industry Appl. 57 (4), 4071–4079. doi:10.1109/tia.2021.3081519
Sleiman, A., and Su, W. (2024). Combined K-means clustering with neural networks methods for PV short-term generation load forecasting in electric utilities. Energies 17 (6), 1433. doi:10.3390/en17061433
Wang, H., Peng, C., Liao, B., Cao, X., and Li, S. (2023a). Wind power forecasting based on WaveNet and multitask learning. Sustainability 15 (14), 10816. doi:10.3390/su151410816
Wang, X., and Ma, W. (2024). A hybrid deep learning model with an optimal strategy based on improved VMD and transformer for short-term photovoltaic power forecasting. Energy 295, 131071. doi:10.1016/j.energy.2024.131071
Wang, Y., Chen, T., Zhou, S., Zhang, F., Zou, R., and Hu, Q. (2023b). An improved Wavenet network for multi-step-ahead wind energy forecasting. Energy Convers. Manag. 278, 116709. doi:10.1016/j.enconman.2023.116709
Wang, Y., Ni, A., and Zhu, L. (2022). Research on ultra-short-term photovoltaic power output prediction based on SSA-LERNN. Control Eng. 29 (11), 1941–1947.
Wu, H., Shi, M., and Zheng, H. (2023). Short-term interval prediction of photovoltaic power based on EEMD-ALOCO-SVM model. J. Sol. Energy 44 (11), 64–71.
Yagang, Z., Zhiya, P., and Hui, W. (2024). Achieving wind power and photovoltaic power prediction: an intelligent prediction system based on a deep learning approach. Energy 283.
Zhang, C., Lin, G., and Kuang, Y. (2023a). Short-term photovoltaic power interval prediction based on MEEMD-QUATRE-BILSTM. Acta Energiae Solaris Sin. 44 (11), 40–54.
Zhang, J., Li, F., and Wang, T. (2024). A load forecasting method using memory neural network and curve shape correction. Electr. Power Eng. Technol. 43 (01), 117–126.
Zhang, M., Zhen, Z., Liu, N., Zhao, H., Sun, Y., Feng, C., et al. (2023b). Optimal graph structure based short-term solar PV power forecasting method considering surrounding spatio-temporal correlations. IEEE Trans. Industry Appl. 59 (1), 345–357. doi:10.1109/tia.2022.3213008
Zhang, X., Li, Y., Li, T., Gui, Y., Sun, Q., and Gao, D. W. (2023c). Digital twin empowered PV power prediction. J. Mod. Power Syst. Clean Energy. doi:10.35833/MPCE.2023.000351
Zhu, Y., Gu, J., and Meng, L. (2020). Photovoltaic power prediction model based on EMD-LSTM. Electr. Power Eng. Technol. 39 (02), 51–58.
Keywords: photovoltaic output prediction, VMD, K-means, spearman, WaveNet
Citation: Zhao S, Yang X, Li K, Li X, Qi W and Huang X (2024) Photovoltaic output prediction based on VMD disturbance feature extraction and WaveNet. Front. Energy Res. 12:1422728. doi: 10.3389/fenrg.2024.1422728
Received: 24 April 2024; Accepted: 09 July 2024;
Published: 27 November 2024.
Edited by:
Yang Yang, Nanjing University of Posts and Telecommunications, ChinaCopyright © 2024 Zhao, Yang, Li, Li, Qi and Huang. This is an open-access article distributed under the terms of the Creative Commons Attribution License (CC BY). The use, distribution or reproduction in other forums is permitted, provided the original author(s) and the copyright owner(s) are credited and that the original publication in this journal is cited, in accordance with accepted academic practice. No use, distribution or reproduction is permitted which does not comply with these terms.
*Correspondence: ShouSheng Zhao, emhhb19zaG91X3NoZW5nQDE2My5jb20=
 ShouSheng Zhao
 Xiaofeng Yang