 Chang Wang1Huihong Yuan1Qifeng Bian2Chongjuan Zhao1,3Botao Zhou4Zhuozhou Chen5*Muhammad Abdul Basit5
- 1State Grid Huzhou Electric Power Supply Company, State Grid Zhejiang Electric Power Supply Company Ltd., Huzhou, China
- 2State Grid Zhejiang Electric Power Company Ltd., Hangzhou, China
- 3Huzhou Electric Power Design Institute Co., Huzhou, China
- 4State Grid Electric Power Research Institute Wuhan Energy Efficiency Evaluation Company, Wuhan, China
- 5Hangzhou Zhiyuan Technology Co., Ltd., Hangzhou, China
Accurate CO2 tracking in electric substation construction is vital for climate efforts, using monocular SLAM for monitoring despite challenges like sunlight and complex terrain. Additionally, these methods typically yield only aggregate carbon emission data, thereby lacking the granularity necessary for precise monitoring throughout the construction process. These limitations compromise mapping accuracy and impede the integration of digital twins and IoT technologies. Addressing these issues, this paper proposed a methodology combining red, green, and blue (RGB) cameras and multi-camera collaboration with digital design systems, enhancing SLAM capabilities. The advanced technique integrated methods including overlap estimation, depth reasoning, noise reduction, and surface reconstruction to create accurate 3D models, enhancing scene reconstruction and real-time CO2 tracking during construction and operation. Leveraging continuous on-site camera monitoring as a substitute for manual inspections, it significantly contributes to the compilation of a comprehensive carbon emission database within a digital twin framework. Experimental results confirmed the proposed method’s superiority over previous works in real-time CO2 estimation, enhancing decision-making, resource management, and sustainable energy development. Overall, besides its application in substation construction for CO2 monitoring, this methodology can also be applied to carbon tracking in various other construction projects.
1 Introduction
The field of computer vision technology has witnessed remarkable advancements that have provided sophisticated techniques for scene reconstruction and mapping, widely adopted in robotics, autonomous vehicles, and construction (González et al., 2015; Voronin et al., 2020). In the construction industry, synchronous positioning and mapping technology has emerged as crucial tools for achieving a digital twin system capable of synchronously mapping with cartography (Tay et al., 2017). This technology enables construction professionals to accurately and efficiently map the physical construction site with its digital counterpart, facilitating improved planning, monitoring, and decision-making throughout the construction process.
The necessity for carbon monitoring in substation construction arises from the substantial impact such projects can have on the environment, contributing significantly to the overall carbon footprint. Video methods, including camera-based monitoring and computer vision techniques, are increasingly used in carbon monitoring due to their ability to provide continuous, detailed, and dynamic observations of construction activities. These methods offer the potential for more precise quantification and tracking of carbon emissions, aligning with environmental regulations and sustainability goals.
Acknowledging the significant impact of substation construction on the environment, the issue of climate change and its associated impacts has garnered significant attention, with a push towards integrating advanced technologies to mitigate greenhouse gas emissions. The international community has responded by establishing a legally binding multilateral environmental treaty to mitigate greenhouse gas emissions (Hoffmann, 2011). China, as a rapidly growing emerging economy, faces the dual challenge of balancing economic development and environmental pollution (Dollar et al., 2020; Zhao et al., 2022b). Being the world’s largest CO2 emitter, China has made commitments to peak its emissions around 2030 and reduce intensity by 60%–65% based on the 2005 level (den Elzen et al., 2016). The power generation sector, being a significant contributor to greenhouse gas emissions, plays a crucial role in achieving these reduction targets.
To address the challenges posed by global warming, various countries and international organizations have taken steps to improve environmental regulations and reduce greenhouse gas emissions. China, in particular, has announced voluntary reduction goals through its Intended Nationally Determined Contributions (INDC), aiming to decrease domestic greenhouse gases by 37% (Fang et al., 2019). While previous studies have focused on CO2 emissions from vehicle fuels and road transportation, accurate quantification of CO2 emissions resulting from energy and raw materials used in transportation infrastructure construction has only recently gained attention (Li et al., 2020).
Figure 1 illustrates the factors influencing CO2 emissions in electric substation construction, including building materials, electrical infrastructures, and miscellaneous elements, highlighting their roles in determining emission levels throughout construction activities.
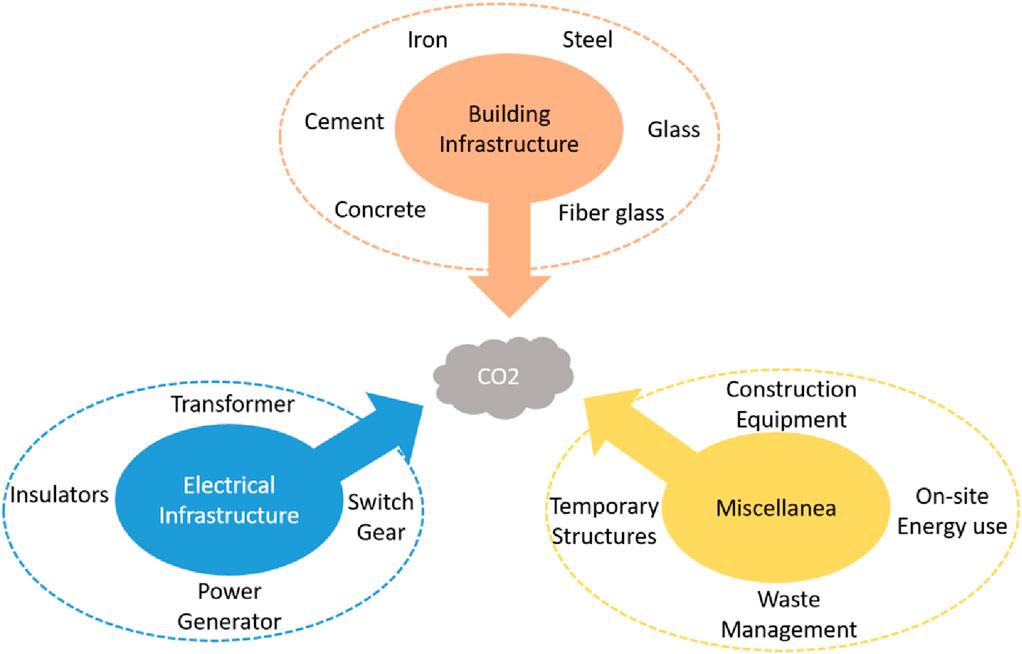
Figure 1. Multiple factors influencing carbon emissions during substation construction.
1.1 Aim and objectives
The objective of this work is to facilitate green and low-carbon management of electric substations throughout their life cycle by developing a comprehensive carbon emission measurement system that accurately reflects construction progress and operations. Leveraging advancements in machine learning, computer vision, digital twin, and Internet of Things (IoT), this research seeks to optimize construction efficiency, environmental monitoring, and energy-saving equipment adoption. It emphasizes sustainable practices and materials to reduce energy consumption and emissions, thereby enhancing power engineering sustainability and aiding the development of a low-carbon power system. With a focus on life cycle carbon emission analysis and effective reduction strategies, this study contributes to setting improved construction standards and aligns with global “Peak Carbon” and “Carbon Neutrality” objectives. By incorporating digital twin and computer vision advancements, the study addresses China’s commitment to emission reduction, specifically in the construction sector, to optimize practices and achieve sustainable development goals through precise CO2 emissions quantification and management.
1.2 Related works
Several studies have contributed to our understanding of CO2 emissions in various domains, including construction, power generation, and indoor reconstruction. Estimating and analyzing CO2 emissions in the construction sector has been a key focus of research. A study conducted in Xi’an, China, investigated the CO2 emission characteristics of urban road corridor construction, highlighting the significant contributions from road sub-projects including lime-fly ash, cement, and lime (Li et al., 2020). The examination of CO2 emissions associated with apartment housing during the construction process revealed that construction work involving reinforced concrete accounted for a substantial portion of the CO2 emissions (Lee et al., 2018).
In the power generation sector, CO2 emission determinants have been identified and analyzed through regression analysis, and a transition from coal, natural gas, and oil to renewable resources and nuclear energy has been advocated as an effective emission reduction strategy (Zhou et al., 2021).
Advancements in indoor reconstruction techniques have focused on developing robust techniques to address occlusions and clutter, involving planar surface extraction, openings detection, and occluded regions reconstruction, thereby facilitating semantically rich 3D indoor building models (Mura et al., 2013). Concurrently, optimization research in surveillance camera placement within buildings has considered coverage, cost, and machinery movement efficiency (Albahri and Hammad, 2017).
Other research has analyzed the impact of energy mix transition on CO2 emissions in the power generation sector (Wei et al., 2021), while investigations into temporal factors for CO2 emissions in buildings emphasize the significance of accommodating fluctuating energy demands across various times (EVANS and SIDAT, 2017).
In the realm of camera-based research, LIFT-SLAM introduces an innovative monocular SLAM technique that integrates deep learning-based feature descriptors with conventional geometry-based methodologies. This integration enhances the system’s robustness to sensor noise and environmental adversities (Bruno and Colombini, 2021). The adoption of event-based cameras offers a solution to the visual odometry (VO) data overload challenge, with a hybrid approach that improves odometry performance through high time resolution and accuracy, demonstrating the potential for advanced, efficient data processing in dynamic environments (Mohamed et al., 2020).
1.3 Problem statement
The substation construction industry relies on synchronous positioning and mapping technology for precise and reliable mapping in complex environments. However, the existing monocular camera-based simultaneous localization and mapping (SLAM) methods face challenges including direct sunlight interference, foreground occlusions, rough terrains, sensor failures, and scarcity of stable textures, leading to incomplete and inaccurate reconstructions. Additionally, traditional monocular camera-based SLAM for carbon accounting is limited to providing total CO2 emissions, while CO2 estimation from substation construction, which spans over years, is a complex task requiring detailed and continuous monitoring. Monocular SLAM methods lack the depth and detail needed for such extensive CO2 emission estimation, making them insufficient for comprehensive carbon tracking over the construction and operational phases. This not only impedes precise mapping and affects construction efficiency, accuracy, and safety but also limits the effective implementation of advanced technologies like digital twins and IoT. These technologies, crucial for real-time monitoring, carbon emission evaluation, and efficient substation management, necessitate accurate and comprehensive scene reconstruction, which is compromised by traditional monocular camera-based SLAM method limitations.
1.4 Proposed solution
To overcome the limitations of existing methods, this research proposes a novel multi-camera vision-based synchronous positioning and mapping approach for green construction of electric substations, employing RGB cameras for their cost-effectiveness and comprehensive color imaging capabilities. It advances 3D modeling by integrating digital twins and advanced information technology to create precise digital twin models of real-time project progress, employing machine learning and computer vision to facilitate carbon emission control and support sustainable power engineering strategies. By addressing challenges like sunlight interference, occlusion, and sensor failures, the approach enhances scene reconstruction, monitoring, and management, contributing to efficient and sustainable substation construction in line with carbon peaking, carbon neutrality, and industry 4.0 objectives. The convergence of multi-camera systems with digital twin technology and advanced algorithms ensures enhanced accuracy, efficiency, and sustainability, marking a significant leap in addressing the intricate demands of complex construction environments.
Despite advancements in camera-based SLAM for electric substation construction, persistent challenges in achieving detailed and dynamic CO2 emission monitoring underscore a critical research gap. This work introduces a novel approach employing RGB cameras and multi-camera collaboration to surpass traditional limitations, offering refined CO2 tracking and mapping precision. This contribution not only addresses the granularity needed for effective carbon management but also facilitates the integration of digital twins and IoT for sustainable construction practices, marking a significant leap in environmental stewardship within the industry.
2 Proposed methodology and experiments
The proposed methodology comprises two primary components: acquiring a 3D model and estimating real-time CO2 levels. The proposed methodology comprises two primary components: acquiring a 3D model and estimating real-time CO2 levels. The method illustrated in Figure 2 initiates with 3D design creation and point cloud generation from RGB images, following camera layout optimization using Building Information Modeling (BIM) for enhanced surveillance (Wang and Rojas, 2014; Albahri and Hammad, 2017). The process involves sequential steps of background removal, feature extraction, and key image selection, leading to spatial depth analysis and radiation regularization for depth data processing. It then incorporates affine regularization for denoising, further feature point extraction, nearest neighbor matching, and concludes with moving least squares (MLS) for precise surface reconstruction and 3D model enhancement (Albahri and Hammad, 2016; Concha and Civera, 2017). This approach ensures comprehensive emission estimation and accurate 3D modeling for real-time monitoring.
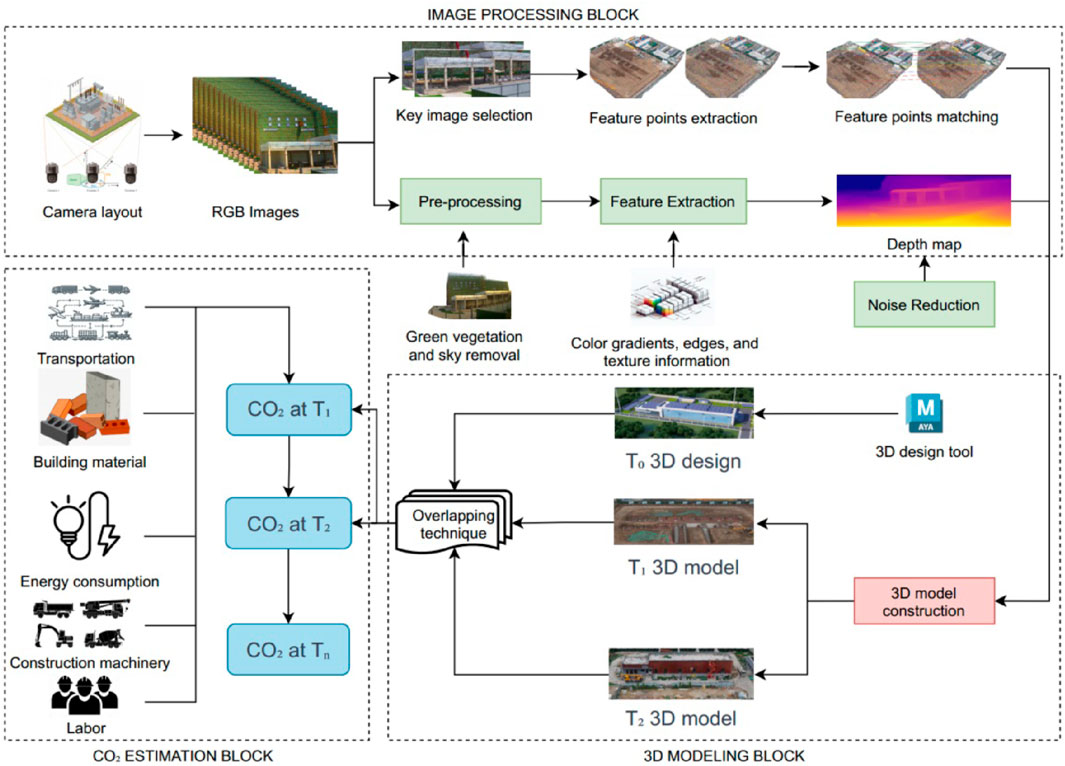
Figure 2. Conceptual framework diagram illustrating the sequential flow of steps.
The approach utilizes BIM to identify camera placement constraints for optimal surveillance coverage in electric substations, addressing environmental, geometric, operational, logical, and legal factors including surface height, monitoring areas across floors, key coverage and privacy zones, and lighting conditions (Albahri and Hammad, 2017). Decision variables include X, Y (fixed for optimal height), and Z coordinates, along with Pan/Tilt/Zoom angles, to determine the best positions for cameras, as illustrated in Figure 3 (Albahri and Hammad, 2016; Zhou et al., 2019). A genetic algorithm refines camera positions within the BIM grid by iteratively optimizing X, Y, Z coordinates and tilt angles, involving search space definition, coverage evaluation through weighted importance, and position adjustments via crossover and mutation until optimal coverage is achieved (Albahri and Hammad, 2017; Lim et al., 2018). This process considers the performance and cost-efficiency of cameras, factoring in field of view, resolution, lens size, and type to automate placement for effective surveillance and accurate CO2 emission mapping in complex construction environments (Albahri and Hammad, 2016; Chen et al., 2021).
In Eq. 1, Kx represents optimal coverage, X represents the total number of cameras; m is the total number of areas monitored, n and n′ represent the total counts of units and coverage units in each area, respectively, Cij represents the camera count and CCiv represents individual camera coverages. This equation models the effectiveness of camera deployment in achieving comprehensive surveillance coverage, balancing camera quantity and placement to optimize area monitoring.
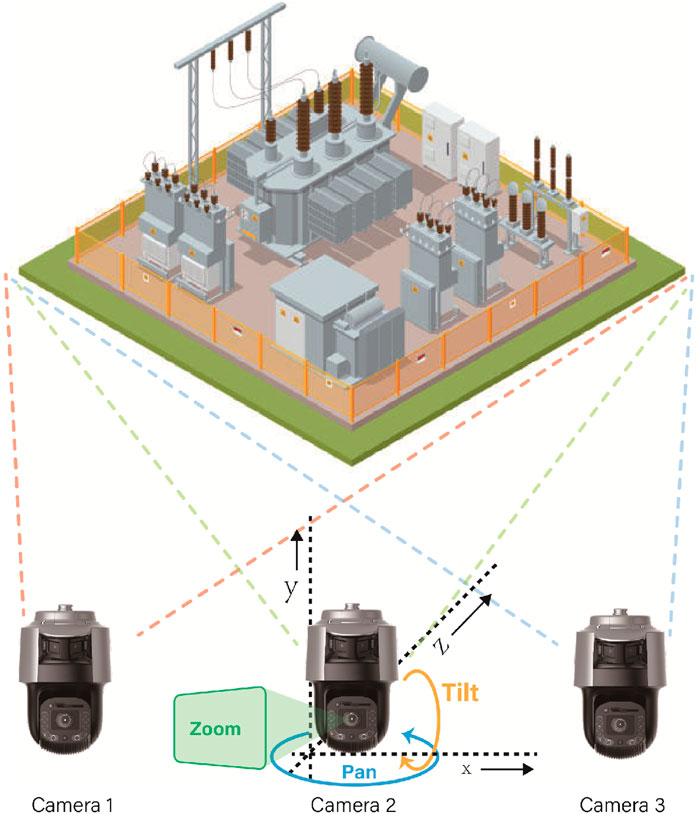
Figure 3. Camera grouping and placement for 3D visualization of substation.
In Eqs 2, 3, L, Hmin, Hmax, and W define the feasible placement region for cameras within a space bounded by maximum length L, width W, and height range [Hmin, Hmax], alongside permissible pan (0–360°) and tilt angles (0 to less than 90°). These equations also establish the physical limits for camera positioning, crucial for optimizing field-of-view coverage and ensuring precise alignment between cameras and the monitored environment, thereby facilitating enhanced spatial analysis and accurate 3D scene reconstruction. Mathematically it is written as:
Eq. 4 defines gm as the vector from the optical center to point p, where p is the projection of a 3D point onto the camera’s coordinate system, and T represents its corresponding point on the imaging plane. Distances λ and ρ measure from p to the optical center and from the optical center to pixel m, respectively. Utilizing the line-line intersection principle for camera pose estimation, the above equation determines the spatial coordinates (X, Y, Z) within the camera group system, essential for accurately reconstructing spatial points in the RGB camera system (Přibyl et al., 2017). To transform the spatial coordinates (X, Y, Z) into image coordinates
In Eqs 5, 6, Cx and Cy are the principal point coordinates, and Fx and Fy are the camera’s focal lengths. The ri elements (0–8) and TX, TY, TZ from rotation and translation matrices respectively facilitate geometric transformations, with only r0, r4, and r8 non-zero for the left-eye camera. The mathematical equations for both left camera Pl and right camera Pr can be written as:
Utilizing normalized image plane coordinates
To improve the point cloud reconstruction accuracy and reduce background pixel errors, the pixel area ratio method utilizes the Green View Index (GVI) to isolate green vegetation from source photos by calculating the ratio of green to total pixels, allowing for targeted background removal and improved accuracy in architectural point cloud reconstruction (Li et al., 2015). The GVI is computed using the number of green pixels Areagreen over the total pixels Areatotal in an image (Eq. 9).
To isolate green vegetation using predefined thresholds and criteria, this method accurately identifies green vegetation in scenes by extracting pixels with significant green channel dominance, comparing the green channel G) with red R) and blue B) channels. diff1 and diff2 are differences between distinct color channel. A pixel is identified as green if diff3 > 0 and diff1 > 0, assigning 1 to green pixels and 0 to non-green ones, using Eq. 10.
Along with green vegetation isolation, sky region extraction employs segmentation to define the sky opening index (SOI), calculating the ratio of sky within the viewing cone from observation points (Holz et al., 2012; Hu et al., 2014). This involves counting the number of sky regions Nsky, pixels in the ith sky region ri, and the total number of pixels N in the image, thus facilitating accurate isolation of sky regions based on color inhomogeneity criteria within segmented areas (Eq. 11) (Yang et al., 2007).
Eq. 11 allows for the precise evaluation of sky exposure in environmental monitoring, contributing valuable insights into atmospheric conditions and spatial openness in the observed scenes. Extracting and deleting green vegetation and sky areas from source photos minimizes background pixel interference, enhancing point cloud matching and surface reconstruction accuracy for precise architectural reconstruction.
During the image data processing for point cloud feature extraction and surface reconstruction, key images are discerned using the interval overlap estimation algorithm, which evaluates the temporal sequence and frame overlap of camera images (Guo et al., 2014; An et al., 2017). Criteria for key frame selection post-initialization and repositioning include idle mapping thread intervals, RGB image point proportions, and non-overlapping map point matches (Liu, 2006). The algorithm strategically selects frames, optimizing map size, and resource use, and pairs them with corresponding street view images for feature extraction and matching. Occlusion assessment and image selection based on position, pose, and overlap ensure efficient registration and robust surface reconstruction, eliminating redundancies and consolidating the dataset for accurate analysis.
To estimate depth maps for key images, the DH-RMVSNet network regresses each reference image against adjacent images (Torii et al., 2009). A dynamic consistency check algorithm further validates and corrects the depth values to refine the depth map accuracy (Yin and Shi, 2018), as delineated by Eq. 12. This process underpins the network’s generation of a 3D cost volume, using differentiable homography and mean square error, which is crucial for the network’s training and the depth prediction of the 3D building model.
The point pi is then re-projected through its depth estimate (di), to the reference point of view, resulting in a re-projected point, preproj. The depth estimate of preproj is denoted as dreproj.
Spatial depth data refinement is achieved through the application of an affine regularization algorithm and Gaussian filtering, significantly enhancing the quality of RGB depth images by mitigating noise (Ju et al., 1996; Zhang and Tam, 2005; Zhou et al., 2019). The optimization process involves a comprehensive energy minimization strategy, incorporating both first-order and second-order regularization to balance fidelity and smoothness (Robert and Deriche, 1996; Li et al., 2017; Yan et al., 2020). The energy function, as articulated in equation 13, integrates data fidelity and regularization terms to yield high-quality depth estimations.
In Eq. 13, E (d; IL, IR) is the energy function with d as disparity over the domain Ω, α1, α2 as regularization weights, ∇d the disparity gradient, w the targeted gradient, and |∇CW(IL, IR)| the intensity of image difference. This optimization is fine-tuned to the characteristics of the observed scene, addressing occlusion, varying illumination, and radiance differences between stereo images. Specifically, the second-order total generalized variation targets and supports affine surfaces, enhancing the adaptability and robustness of the algorithm (Robert and Deriche, 1996). The resulting depth maps, characterized by reduced noise and improved feature preservation, demonstrate the effectiveness of these affine regularization and denoising techniques in producing reliable, high-quality spatial depth data, as shown in Figure 4.
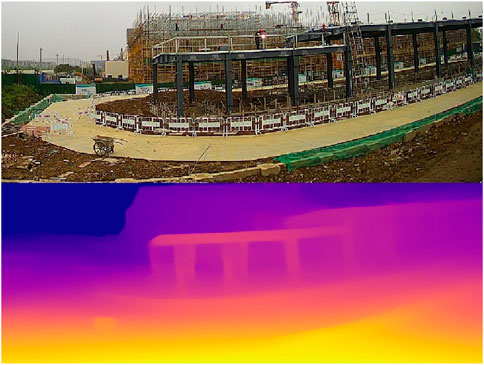
Figure 4. RGB image and Spatial depth image of the Substation.
The feature point extraction process commences with constructing an image pyramid, a multi-scale representation of the input image, to facilitate the detection of feature points across various resolutions (Adelson et al., 1991). Employing the proportional feature transformation method, feature points are detected at each pyramid layer, ensuring scale invariance (Sedaghat et al., 2011). This process involves resizing the image at each layer with a scaling factor α, ensuring the number of features per layer is proportional to its area. The total number of features is derived from the cumulative area of all pyramid layers, facilitating the proportional distribution of feature points (Eq. 14).
Eq. 14 calculates the total detectable feature points Ns, using the proportional transformation across the image pyramid’s n layers. It considers the total feature points N, scaling factor α, and the cumulative area S for a compact and scale-invariant feature detection. Once the image pyramid is established, feature detection proceeds at each layer, employing the gray-scale centroid and moment method to ensure rotation invariance of the feature points (Guojun et al., 2021; Zhao et al., 2022a). The direction and distribution of feature points are ascertained using the moment of image blocks, culminating in an accurate feature point cloud using Eq. 15, where mpq represents the moment of order p + q of the image block B. These feature points are illustrated in Figure 5. The entire process ensures a systematic approach to feature point extraction, providing a robust basis for subsequent 3D modeling and analysis tasks.
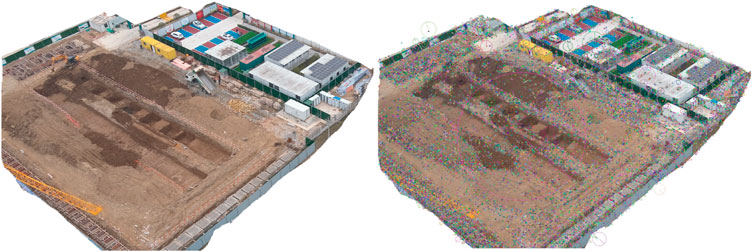
Figure 5. Feature points marked on the RGB image.
To facilitate the matching of image feature points and construct reliable tracks, the approximate nearest neighbor algorithm is employed with a k-dimensional tree structure (Boom et al., 2013; Malkov and Yashunin, 2018). Refinement is conducted through random sample consensus and eight-point algorithms (Hartley, 1997; Kim and Im, 2003), while forest-based trajectory matching techniques and binary tree indexes enhance efficiency, as depicted in Figure 6 (Rao and Ross, 1998; Babin et al., 2021). The Iterative Closest Point (ICP) algorithm iteratively optimizes rotation and translation for precise point cloud registration (Marani et al., 2016; He et al., 2017), as delineated in Eq. 16.

Figure 6. Matching of feature points using approximate nearest neighbor algorithm.
In Eq. 16, qi and pi are individual points from target point clouds Q and source point clouds P. R denotes the rotation matrix, and T is the translation vector. The centroids of sets Q and p are represented by μq and μp respectively, while
Upon acquiring feature point matches between photo pairs, trajectories are established by tracking these points across multiple photos. A progressive sampling consensus algorithm is employed to mitigate pixel migration and noise, enhancing the robustness of the matching (Song et al., 2013). The matching quality is assessed by introducing a quality factor q, to rank point pairs and determine the homography matrix using only high-quality matches. Point pairs below a certain quality threshold are discarded. The Hamming distance is used to evaluate feature point similarity, with the matching quality ratio, β, calculated from the minimum distances, dmin1 and dmin2, between matched pairs (Hofbauer et al., 2012). The correlation of quality factor q and ratio β is defined in the Eq. 17.
The creation of a 3D model using the processed images is achieved using moving least squares (MLS) method for point cloud matching and a directed 3D triangulation (Fleishman et al., 2005; Cignoni and Scopigno, 2008). The initial step inverts the facade point cloud, converting image features into straight lines and simplifying geometry. The least squares method then approximates the error in distance between adjacent points for 3D surface construction using the following equation:
In Eq. 18,
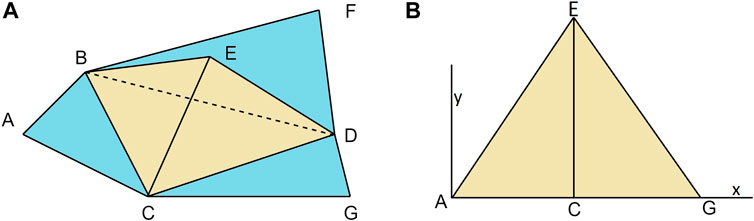
Figure 7. Projection of a triangulated mesh in an approximate plane. (A) Integration of Tetrahedron BCDE with Hyperplane ACGDFB in 3D. (B) 2D Projection of 3D Configuration on the X–axis and Y–axis.
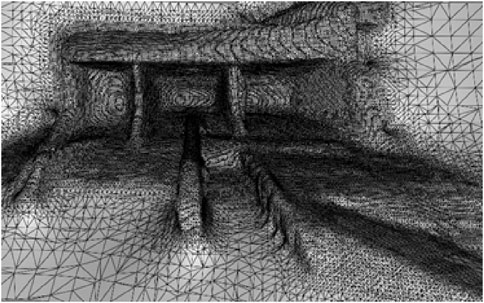
Figure 8. Triangular mesh construction with random sampling method to remove noise.
The comprehensive 3D model is finalized by generating a height model via a digital elevation model (DEM) (Kršák et al., 2016), classifying ground points and employing triangulation for irregular interpolation. This process normalizes the original data to yield normalized height point cloud data, which is then interpolated using inverse distance weighted method (Remondino and El-Hakim, 2006). CO2 estimation, integral to the model’s utility, utilizes an overlap technique in a 3D design generated from RGB images. This approach combines Iterative Closest Point (ICP) and Scale-Invariant Feature Transform (SIFT) techniques for precise alignment and carbon emission estimation from the substation (Eo et al., 2012), ensuring the model’s accuracy and effectiveness in environmental impact analysis.
The technique consists of a series of steps to ensure accurate feature point matching and alignment in 3D models and designs. Initially, the Scale-Invariant Feature Transform (SIFT) algorithm is utilized to identify and match key feature points between the 3D model and design, extracting local descriptors invariant to scale and orientation as defined by the scale-space function L (x, y, σ) in Eq. 19, where G represents the Gaussian function, D is the input image, and (x, y) are the image coordinates (Ni et al., 2021).
Following this, the Iterative Closest Point (ICP) algorithm minimizes point cloud discrepancies between corresponding points p and p′ by optimizing rotations R and translations t using equation 20, until a set error threshold is met.
The SIFT algorithm is reapplied to extract distinctive features using the difference-of-Gaussian function in the scale-space yielding robust descriptors for feature matching. D (x, y, σ) denotes the difference between Gaussian-filtered images G at scales σ and kσ, relative to the original image I (x, y) (Eq. 21).
Eq. 21 calculates the difference between Gaussian-blurred images at distinct scales, essential for identifying distinctive image features. Feature matching is then accomplished using Nearest Neighbor matching to identify pairs of feature points using euclidean distance d (i, j), calculated using Eq. 22, where fi and fj are the i − th and j − th feature descriptors (Yang and Newsam, 2008).
RANSAC estimates the initial alignment between the real-time 3D model and design, optimizing the transformation to minimize squared differences between matched points using Eq. 23 (Shen et al., 2020). The transformation T is composed of a rotation matrix R and a translation vector t, and residual displacement between aligned points p and p′, given as:
Post-alignment quality assessment utilizes Root Mean Squared Error (RMSE) to measure alignment accuracy, as detailed in Eq. 24, iterating for refinement. RMSE evaluates the precision of aligning original point clouds p with their corresponding points p′, based on the deviation of points post-transformation R × p + t from their targets, where N is the total number of corresponding point pairs used in the calculation. This metric is critical for optimizing the alignment process, ensuring high fidelity in the registration of 3D spatial data.
Finally, segmentation is performed using the Random Walker algorithm, partitioning point clouds into labeled segments as defined by the spatial extents Ri in Eq. 25, with X, Y, Z denoting the minimum and maximum bounding coordinates of each region (Lai et al., 2009). This process ensures accurate 3D model segmentation for CO2 estimation and structural analysis.
Experiments conducted on an under-construction electric substation validated a novel 3D modeling method combining computer vision and machine learning for accurate CO2 emission estimation (Cjs). This estimation integrates emissions from building materials (Cjc), transportation (Cys), labor (Cx), construction machinery (Cm), and energy consumption (Cjn) for total construction phase emissions is formulated in Eq. 26.
• Building Material CO2 Emissions (Cjc): Building material CO2 emissions (Cjc) are calculated as a total of the product of material consumption (qi) and emission factors (ei).
• CO2 produced during transportation (Cys): Transportation CO2 emissions (Cys) are computed as the sum of each material’s consumption (Mi), transport distance (Di), and emission factor (ei).
• CO2 produced by labor (Cx): Labor CO2 emissions (Cx) are calculated using the number of workers X) and their respective emission factor (ei).
• CO2 produced by construction machinery (Cm): Machinery CO2 emissions (Cm) are derived from fuel consumption (FC), emission factor (ei), and operation time (OT).
• CO2 produced by energy consumption (Cjn): Energy consumption CO2 emissions (Cjn) are computed from each energy source’s emission factor (ei), usage frequency (|Uj,i|), and machinery energy consumption (Qj,i).
CO2 emissions from construction workers and machinery are estimated using a YOLOv8 model trained on a custom dataset of workers and machinery images. The model calculates the number of workers and machinery from real-time RGB images of the substation, with detections shown in Figure 9 using green and red rectangles for workers and machinery, respectively, along with detection probabilities.
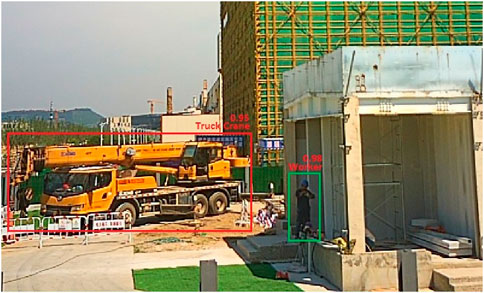
Figure 9. Real-time detection of construction workers and machinery for CO2 emission estimation during substation construction.
The total carbon emission of the substation
Table 1 presents a detailed overview of CO2 emission factors and transportation-related emissions for item categories in substation construction, serving as a reference for the materials’ carbon footprints. The item categories include building materials, components forming a transformer, gas insulated switchgear (GIS), switchgear, 10 kV static var generator (SVG), ground transformer arc suppression coil, and energy sources. This table presents the carbon emission factor for each item in a tabular format, reflecting their respective carbon emissions per unit quantity. Additionally, this table displays the actual CO2 emissions of each item during its transportation to the substation site, considering the density of diesel as 0.835 kg/L, which is used to calculate the emission factor of diesel.
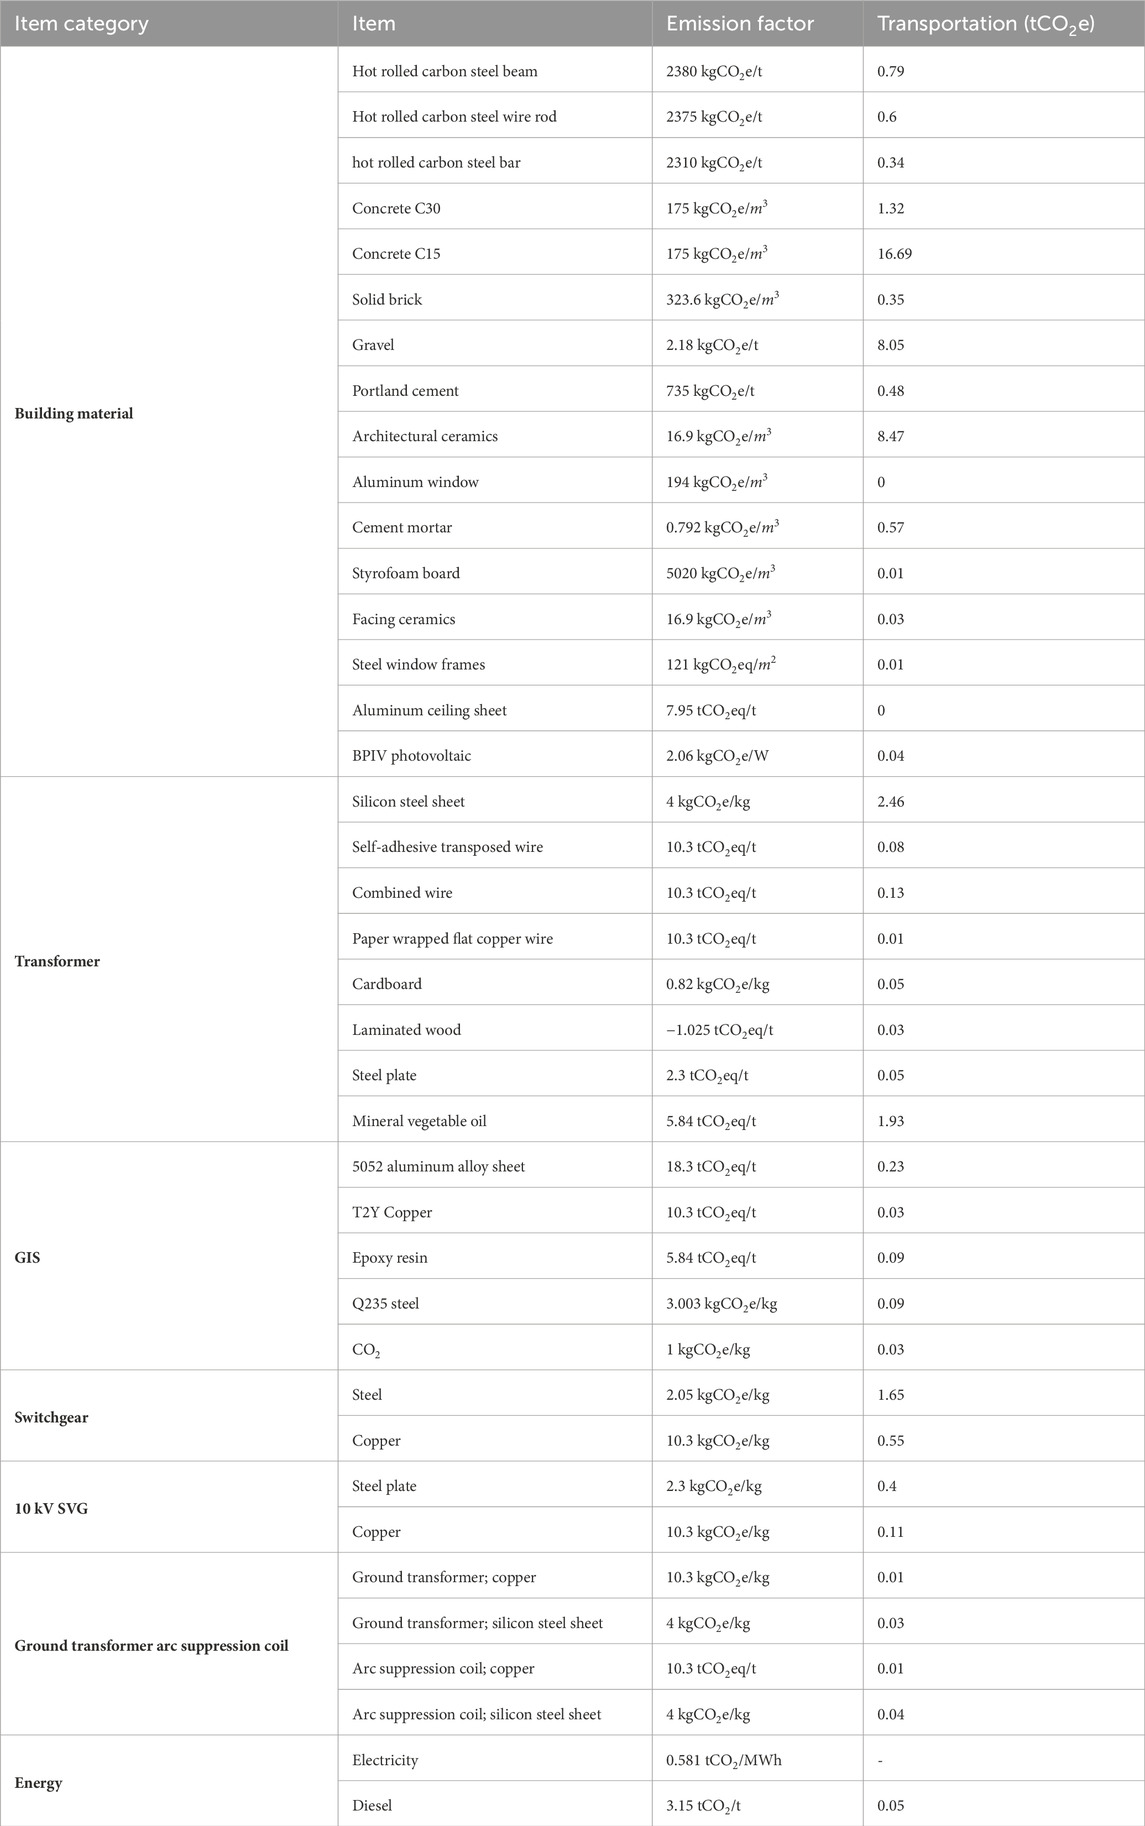
Table 1. Table of CO2 emission factors and transportation-related CO2 emissions for substation construction materials.
The methodology combines RGB cameras with advanced algorithms including ICP and SIFT to achieve precise 3D model alignment and design. It effectively addresses segmented part variations for accurate CO2 emission estimation, with comprehensive results and analysis presented in Section 3.
3 Experimental results
This section details the experimental results and analyses from the proposed 3D modeling and CO2 emission estimation methodology. A total of twenty experiments are performed within an 9-month period, starting from T1 and concluding at T20. The initial stage of construction, denoted as T0, served as the baseline reference point, representing a phase with no construction activities and negligible CO2 emissions. The initial stage at T0 involved a comprehensive location survey and documentation of the substation, establishing the baseline 3D design that served as the reference point for comparisons throughout the subsequent experimental stages. Each experiment, from T1 to T20, corresponds to a distinct time interval within the 9-month period, allowing for a comprehensive investigation of the substation construction dynamics. The experimental methodology employed the overlapping technique, aligning and comparing 3D model with 3D design at different time intervals to analyze changes and advancements in the construction process.
During each experimental trial, a 3D model is meticulously constructed to represent the current state of the substation at that specific time interval, starting from T1 and concluding at T20. The 3D models are generated by incorporating the physical components and structural elements that are implemented up to each respective experimental phase. Pertinent information regarding the quantity of materials used during construction at T1 and the subsequent experiments is collected through consultations with project supervisors and leaders, facilitating a comprehensive analysis of the construction progress at T0.
Table 2 provides a comprehensive analysis of CO2 emissions from various materials listed in Table 1, detailing emissions for each of the 20 experimental trials (T1 to T20) using Eq. 26 to quantify contributions from building materials (Cjc), transportation (Cys), energy consumption during construction (Cjn), labor (Cx) with an emission factor of 0.95 kgCO2/unit (Jiang et al., 2018), and construction machinery (Cm).
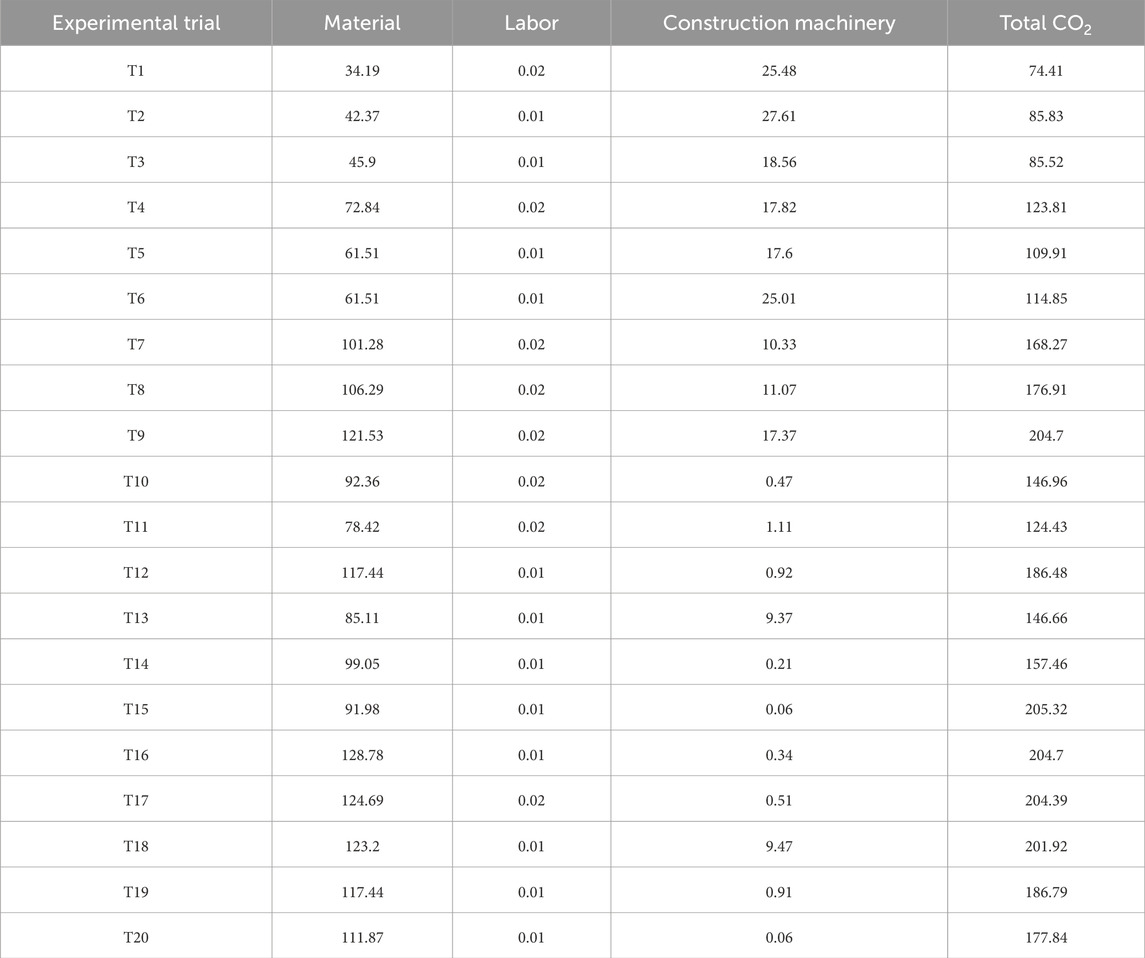
Table 2. CO2 emissions of various items in tCO2e.
The proposed methodology is implemented on an under construction 110 kV Chengbei substation. This substation is situated in the north of the Zhejiang Anke Jinji Technology Development, positioned at the northwest intersection of North Ring Road and East Ring Road. The geographical coordinates are approximately (30.675504, 119.697,859), as depicted in the map in Figure 10. The elevation of the station site ranges from 10.86 m to 12.98 m above sea level.
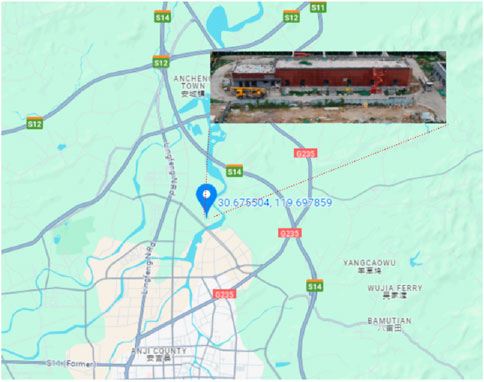
Figure 10. Map location of 110 kV Chengbei substation.
By calculating the carbon emissions from each component individually in each trial, the total carbon emissions for T20 are estimated at 177.84 tCO2e, enabling a detailed assessment and monitoring of the 110 kV Chengbei substation’s carbon emission trajectory. This precise estimation facilitates sustainable practices and informed decision-making in managing the environmental impact of construction projects. Comprehensive evaluation of various contributing factors ensures effective environmental impact management throughout the project lifecycle.
A theoretical CO2 emission baseline of 225 tCO2e for the 110 kV Chengbei substation was determined prior to the construction phase, as documented in the substation’s design scheme. This baseline acts as a reference point, indicating anticipated emissions in the absence of specific modifications or optimizations. It encompasses expected CO2 emissions from various sources during construction, including machinery, building structures, construction materials, energy consumption, and other pertinent factors depicted in Figure 1. This comprehensive baseline aids in understanding and managing the environmental impact of the substation construction.
Figure 11A illustrates the CO2 emission trends for the 110 kV Chengbei substation across 20 experimental trials in tCO2e, with the blue solid line depicting the CO2 emissions resulting from the application of the proposed method and the orange dotted line representing the established baseline emissions. Consistently, the blue line remains beneath the baseline, demonstrating that the actual emissions were lower than those projected for optimal conditions, thus affirming the effectiveness of the proposed method in capturing the reduced CO2 emissions. Conversely, Figure 11B presents the cumulative CO2 emissions curve for the 110 kV Chengbei substation in tCO2e, evidencing an upward trend as the substation approaches completion. This increasing trend underscores the robustness of the proposed method in delivering real-time CO2 emission estimations, reflecting the progressive accumulation of emissions throughout the construction period.
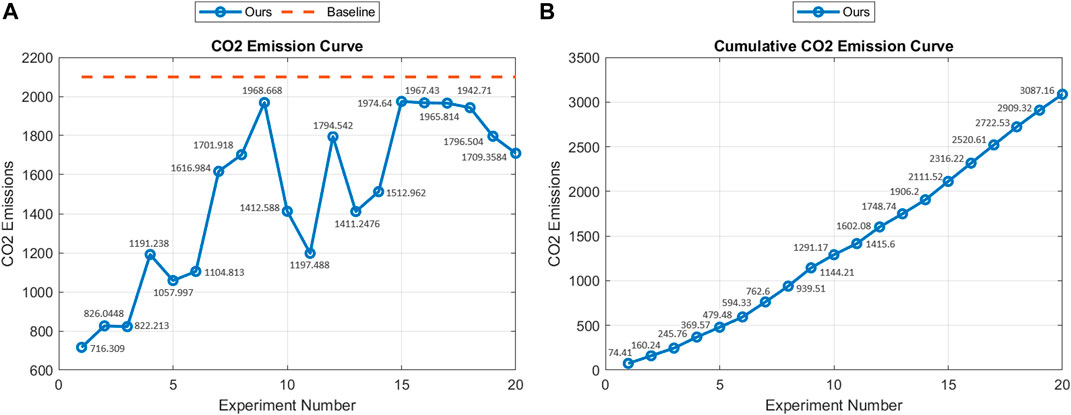
Figure 11. Total CO2 (tCO2e) Emissions of 110 kV Chengbei Substation (Ours) during each Experiment. (A) Comparative Trends of CO2 Emissions at 110kV Chengbei Substation Over 20 Trials. (B) Cumulative CO2 Emissions Curve at 110 kV Chengbei Substation During Construction Period.
Figure 11 illustrated that our proposed method significantly captured the real-time CO2 emissions in substation construction, demonstrating superiority over traditional approaches by effectively handling unpredictable variables and deviations from initial designs. Unlike the rigid predictions of traditional methods, our approach adapted to unforeseen machinery factors and other variables, offering dynamic insights and real-time optimization throughout the construction process. This adaptability extended beyond construction, enabling continuous monitoring and management of CO2 emissions during the operational phase of the substation. The method’s robustness and comprehensive coverage underscored its potential in guiding future low-carbon strategies and fostering sustainable construction practices, thus contributing to a greener, more sustainable future in substation construction and operation.
4 Conclusion
This study presents a robust and effective methodology for accurately estimating CO2 emissions during the construction of substations, demonstrating superiority over traditional approaches by effectively handling unpredictable variables and deviations from initial designs. Leveraging advanced techniques including image processing, feature extraction, feature matching, and point cloud generation, the proposed approach yields a comprehensive representation of the construction site, capturing crucial geometric details and depth information. The utilization of algorithms including SIFT for key-point detection and rectification significantly improves the accuracy and alignment of images, ensuring precise reconstruction of the 3D model. The experimental results confirm the method’s efficacy in quantifying CO2 emissions, as the 3D model successfully captures the underlying geometry of the scene, enabling accurate assessment of the current completion state and corresponding CO2 emissions. By comparing the 3D model with the initial design, the study tracks and analyzes the dynamics of CO2 emissions throughout the construction process, offering valuable insights for monitoring and evaluating the environmental impact. Unlike traditional methods that rely on static predictions, our method adapts to unforeseen variables, offering dynamic insights and real-time optimization throughout the construction process. This adaptability extends beyond construction, enabling continuous monitoring and management of CO2 emissions during the operational phase of the substation, thus providing a more holistic and impactful environmental management strategy. Future research can further enhance this methodology by exploring additional techniques for refining the point cloud, incorporating machine learning algorithms for semantic segmentation and object recognition, and integrating data from various sources, such as LiDAR or drone imagery, to provide a more comprehensive and accurate estimation of CO2 emissions in construction projects.
Data availability statement
The raw data supporting the conclusion of this article will be made available by the authors, without undue reservation.
Author contributions
CW: Writing–review and editing. HY: Writing–review and editing. QB: Writing–review and editing. CZ: Writing–review and editing. BZ: Writing–review and editing. ZC: Writing–original draft. MB: Writing–original draft.
Funding
The author(s) declare that financial support was received for the research, authorship, and/or publication of this article. This research was supported by grants from the Collective Enterprise Technology Project vof State Grid Zhejiang Electric Power Co., Ltd. Huzhou Power Supply Company (grant number, CY840800JS20230018).
Acknowledgments
The authors acknowledge the support received for this research through grants from the Collective Enterprise Technology Project of State Grid Zhejiang Electric Power Co., Ltd. Huzhou Power Supply Company.
Conflict of interest
Authors CW, HY, and CZ were employed by State Grid Huzhou Electric Power Supply Company, State Grid Zhejiang Electric Power Supply Company Ltd. Author QB was employed by State Grid Zhejiang Electric Power Company Ltd. Author CZ was employed by Huzhou Electric Power Design Institute Co. Author BZ was employed by State Grid Electric Power Research Institute Wuhan Energy Efficiency Evaluation Company. Authors ZC and MB were employed by Hangzhou Zhiyuan Technology Co., Ltd.
The authors declare that this study received funding from State Grid Zhejiang Electric Power Co., Ltd., Huzhou Power Supply Company (grant number: CY840800JS20230018). The funder had the following involvement in the study: data collection, analysis, and guidance on the manuscript.
Publisher’s note
All claims expressed in this article are solely those of the authors and do not necessarily represent those of their affiliated organizations, or those of the publisher, the editors and the reviewers. Any product that may be evaluated in this article, or claim that may be made by its manufacturer, is not guaranteed or endorsed by the publisher.
References
Adelson, E. H., Simoncelli, E. P., and Freeman, W. T. (1991). “Pyramids and multiscale representations,” in Representations and vision. Editor A. Gorea (Cambridge: Cambridge University Press), 3–16.
Albahri, A. H., and Hammad, A. (2016). “Optimizing surveillance camera placement in buildings using bim,” in ISARC. Proceedings of the International Symposium on Automation and Robotics in Construction (IAARC Publications), Auburn, USA, July, 2016.
Albahri, A. H., and Hammad, A. (2017). Simulation-based optimization of surveillance camera types, number, and placement in buildings using bim. J. Comput. Civ. Eng. 31, 04017055. doi:10.1061/(asce)cp.1943-5487.0000704
An, N., Welch, S. M., Markelz, R. C., Baker, R. L., Palmer, C. M., Ta, J., et al. (2017). Quantifying time-series of leaf morphology using 2d and 3d photogrammetry methods for high-throughput plant phenotyping. Comput. Electron. Agric. 135, 222–232. doi:10.1016/j.compag.2017.02.001
Babin, P., Dandurand, P., Kubelka, V., Giguère, P., and Pomerleau, F. (2021). “Large-scale 3d mapping of subarctic forests,” in Field and service robotics: results of the 12th international conference (Berlin, Germany: Springer), 261–275.
Boom, B. J., Huang, P. X., and Fisher, R. B. (2013). “Approximate nearest neighbor search to support manual image annotation of large domain-specific datasets,” in Proceedings of the International Workshop on Video and Image Ground Truth in Computer Vision Applications, St. Petersburg, Russia, July, 2013, 1–8.
Bruno, H. M. S., and Colombini, E. L. (2021). Lift-slam: a deep-learning feature-based monocular visual slam method. Neurocomputing 455, 97–110. doi:10.1016/j.neucom.2021.05.027
Chen, X., Zhu, Y., Chen, H., Ouyang, Y., Luo, X., and Wu, X. (2021). Bim-based optimization of camera placement for indoor construction monitoring considering the construction schedule. Automation Constr. 130, 103825. doi:10.1016/j.autcon.2021.103825
Cignoni, P., and Scopigno, R. (2008). Sampled 3d models for ch applications: a viable and enabling new medium or just a technological exercise? J. Comput. Cult. Herit. (JOCCH) 1, 1–23. doi:10.1145/1367080.1367082
Concha, A., and Civera, J. (2017). “Rgbdtam: a cost-effective and accurate rgb-d tracking and mapping system,” in 2017 IEEE/RSJ international conference on intelligent robots and systems (IROS), Vancouver, BC, Canada, September, 2017, 6756–6763.
den Elzen, M., Fekete, H., Höhne, N., Admiraal, A., Forsell, N., Hof, A. F., et al. (2016). Greenhouse gas emissions from current and enhanced policies of China until 2030: can emissions peak before 2030? Energy Policy 89, 224–236. doi:10.1016/j.enpol.2015.11.030
Dollar, D., Huang, Y., and Yao, Y. (2020). China 2049: economic challenges of a rising global power. Washington, D.C., USA: Brookings Institution Press.
Eo, Y. D., Pyeon, M. W., Kim, S. W., Kim, J. R., and Han, D. Y. (2012). Coregistration of terrestrial lidar points by adaptive scale-invariant feature transformation with constrained geometry. Automation Constr. 25, 49–58. doi:10.1016/j.autcon.2012.04.011
Evans, B., and Sidat, S. (2017). “An investigation into the use of temporal factors for co2 emissions accounting in buildings,” in CIBSE ASHRAE technical symposium (UK: Loughborough), 5–6.
Fang, K., Zhang, Q., Long, Y., Yoshida, Y., Sun, L., Zhang, H., et al. (2019). How can China achieve its intended nationally determined contributions by 2030? a multi-criteria allocation of China’s carbon emission allowance. Appl. Energy 241, 380–389. doi:10.1016/j.apenergy.2019.03.055
Fleishman, S., Cohen-Or, D., and Silva, C. T. (2005). Robust moving least-squares fitting with sharp features. ACM Trans. Graph. (TOG) 24, 544–552. doi:10.1145/1073204.1073227
González, D., Pérez, J., Milanés, V., and Nashashibi, F. (2015). A review of motion planning techniques for automated vehicles. IEEE Trans. intelligent Transp. Syst. 17, 1135–1145. doi:10.1109/tits.2015.2498841
Guo, Y., Sohel, F., Bennamoun, M., Wan, J., and Lu, M. (2014). An accurate and robust range image registration algorithm for 3d object modeling. ieee Trans. multimedia 16, 1377–1390. doi:10.1109/tmm.2014.2316145
Guojun, L., Yanhai, X., Jiewen, D., and Shilei, H. (2021). Orb-slam method based on local adaptive threshold extraction feature points. Bull. Surv. Mapp. 32. doi:10.13474/j.cnki.11-2246.2021.0269
Hartley, R. I. (1997). In defense of the eight-point algorithm. IEEE Trans. pattern analysis Mach. Intell. 19, 580–593. doi:10.1109/34.601246
He, Y., Liang, B., Yang, J., Li, S., and He, J. (2017). An iterative closest points algorithm for registration of 3d laser scanner point clouds with geometric features. Sensors 17, 1862. doi:10.3390/s17081862
Hofbauer, H., Rathgeb, C., Uhl, A., and Wild, P. (2012). “Image metric-based biometric comparators: a supplement to feature vector-based hamming distance?,” in 2012 BIOSIG-Proceedings of the International Conference of Biometrics Special Interest Group (BIOSIG), Darmstadt, Germany, September, 2012, 1–5.
Hoffmann, M. J. (2011). Climate governance at the crossroads: experimenting with a global response after Kyoto. Oxford, United Kingdom: Oxford University Press.
Holz, D., Holzer, S., Rusu, R. B., and Behnke, S. (2012). “Real-time plane segmentation using rgb-d cameras,” in RoboCup 2011: robot soccer world cup XV 15 (Berlin, Germany: Springer), 306–317.
Hu, X., Rodriguez, F. S. A., and Gepperth, A. (2014). “A multi-modal system for road detection and segmentation,” in 2014 IEEE Intelligent Vehicles Symposium Proceedings (IEEE), Dearborn, MI, USA, June, 2014, 1365–1370.
Jiang, B., Li, H., Dong, L., Wang, Y., and Tao, Y. (2018). Cradle-to-site carbon emissions assessment of prefabricated rebar cages for high-rise buildings in China. Sustainability 11, 42. doi:10.3390/su11010042
Ju, S. X., Black, M. J., and Jepson, A. D. (1996). “Skin and bones: multi-layer, locally affine, optical flow and regularization with transparency,” in Proceedings CVPR IEEE Computer Society Conference on Computer Vision and Pattern Recognition, San Francisco, CA, USA, June, 1996, 307–314.
Kenwright, B. (2015). “Free-form tetrahedron deformation,” in Advances in Visual Computing: 11th International Symposium, ISVC 2015, Las Vegas, NV, USA, December 14-16, 2015.
Kim, T., and Im, Y.-J. (2003). Automatic satellite image registration by combination of matching and random sample consensus. IEEE Trans. geoscience remote Sens. 41, 1111–1117. doi:10.1109/tgrs.2003.811994
Kršák, B., Blišt’an, P., Pauliková, A., Puškárová, P., Kovanič, L. m., Palková, J., et al. (2016). Use of low-cost uav photogrammetry to analyze the accuracy of a digital elevation model in a case study. Measurement 91, 276–287. doi:10.1016/j.measurement.2016.05.028
Lai, Y.-K., Hu, S.-M., Martin, R. R., and Rosin, P. L. (2009). Rapid and effective segmentation of 3d models using random walks. Comput. Aided Geom. Des. 26, 665–679. doi:10.1016/j.cagd.2008.09.007
Lee, J., Tae, S., and Kim, R. (2018). A study on the analysis of co2 emissions of apartment housing in the construction process. Sustainability 10, 365. doi:10.3390/su10020365
Li, D., Wang, Y., Liu, Y., Sun, S., and Gao, Y. (2020). Estimating life-cycle co2 emissions of urban road corridor construction: a case study in xi’an, China. J. Clean. Prod. 255, 120033. doi:10.1016/j.jclepro.2020.120033
Li, J., Klein, R., and Yao, A. (2017). “A two-streamed network for estimating fine-scaled depth maps from single rgb images,” in Proceedings of the IEEE international conference on computer vision, Venice, Italy, October, 2017, 3372–3380.
Li, X., Zhang, C., Li, W., Ricard, R., Meng, Q., and Zhang, W. (2015). Assessing street-level urban greenery using google street view and a modified green view index. Urban For. Urban Green. 14, 675–685. doi:10.1016/j.ufug.2015.06.006
Lim, Y., Majid, H., Samah, A., Ahmad, M., Ossen, D., Harun, M., et al. (2018). Bim and genetic algorithm optimisation for sustainable building envelope design. Int. J. Sustain. Dev. Plan. 13, 151–159. doi:10.2495/sdp-v13-n1-151-159
Liu, Y. (2006). Automatic registration of overlapping 3d point clouds using closest points. Image Vis. Comput. 24, 762–781. doi:10.1016/j.imavis.2006.01.009
Malkov, Y. A., and Yashunin, D. A. (2018). Efficient and robust approximate nearest neighbor search using hierarchical navigable small world graphs. IEEE Trans. pattern analysis Mach. Intell. 42, 824–836. doi:10.1109/tpami.2018.2889473
Marani, R., Reno, V., Nitti, M., D’Orazio, T., and Stella, E. (2016). A modified iterative closest point algorithm for 3d point cloud registration. Computer-Aided Civ. Infrastructure Eng. 31, 515–534. doi:10.1111/mice.12184
Mohamed, S. A., Haghbayan, M.-H., Rabah, M., Heikkonen, J., Tenhunen, H., and Plosila, J. (2020). “Towards dynamic monocular visual odometry based on an event camera and imu sensor,” in Intelligent Transport Systems. From Research and Development to the Market Uptake: Third EAI International Conference, INTSYS 2019, Braga, Portugal, December 4–6, 2019, 249–263.
Mura, C., Mattausch, O., Villanueva, A. J., Gobbetti, E., and Pajarola, R. (2013). “Robust reconstruction of interior building structures with multiple rooms under clutter and occlusions,” in 2013 International Conference on Computer-Aided Design and Computer Graphics (IEEE), Guangzhou, China, November, 2013, 52–59.
Ni, L., Chen, H., Hong, S., Zhang, L., and Luan, S. (2021). Near infrared spectral calibration model transfer without standards by screening spectral points with scale invariant feature transform from master samples spectra. Spectrochimica Acta Part A Mol. Biomol. Spectrosc. 260, 119802. doi:10.1016/j.saa.2021.119802
Přibyl, B., Zemčík, P., and Čadík, M. (2017). Absolute pose estimation from line correspondences using direct linear transformation. Comput. Vis. Image Underst. 161, 130–144. doi:10.1016/j.cviu.2017.05.002
Rao, J., and Ross, K. A. (1998). “Cache conscious indexing for decision-support in main memory,” in Proceedings of the 25th International Conference on Very Large Data Bases, San Francisco, CA, United States, September, 1998.
Remondino, F., and El-Hakim, S. (2006). Image-based 3d modelling: a review. photogrammetric Rec. 21, 269–291. doi:10.1111/j.1477-9730.2006.00383.x
Robert, L., and Deriche, R. (1996). “Dense depth map reconstruction: a minimization and regularization approach which preserves discontinuities,” in Computer Vision—ECCV’96: 4th European Conference on Computer Vision, Cambridge, UK, April 15–18, 1996.
Sedaghat, A., Mokhtarzade, M., and Ebadi, H. (2011). Uniform robust scale-invariant feature matching for optical remote sensing images. IEEE Trans. Geoscience Remote Sens. 49, 4516–4527. doi:10.1109/tgrs.2011.2144607
Shen, X., Darmon, F., Efros, A. A., and Aubry, M. (2020). “Ransac-flow: generic two-stage image alignment,” in Computer Vision–ECCV 2020: 16th European Conference, Glasgow, UK, August 23–28, 2020.
Song, Z., Zhou, S., and Guan, J. (2013). A novel image registration algorithm for remote sensing under affine transformation. IEEE Trans. Geoscience Remote Sens. 52, 4895–4912.
Tay, Y. W. D., Panda, B., Paul, S. C., Noor Mohamed, N. A., Tan, M. J., and Leong, K. F. (2017). 3d printing trends in building and construction industry: a review. Virtual Phys. Prototyp. 12, 261–276. doi:10.1080/17452759.2017.1326724
Torii, A., Havlena, M., and Pajdla, T. (2009). “From google street view to 3d city models,” in 2009 IEEE 12th international conference on computer vision workshops, ICCV Workshops (IEEE), Kyoto, September, 2009, 2188–2195.
Tsai, R. (1987). A versatile camera calibration technique for high-accuracy 3d machine vision metrology using off-the-shelf tv cameras and lenses. IEEE J. Robotics Automation 3, 323–344. doi:10.1109/jra.1987.1087109
Voronin, V., Gapon, N., Zhdanova, M., Semenishchev, E., Cen, Y., and Zelensky, A. (2020). Missing area reconstruction in 3d scene from multi-view satellite images for surveillance applications. Counterterrorism, Crime Fight. Forensics, Surveillance Technol. IV (SPIE) 11542, 151–157.
Wang, S., and Rojas, R. (2014). “Shader-based automatic camera layout optimization for mobile robots using genetic algorithm,” in 2014 International Conference on Computer Graphics Theory and Applications (GRAPP), Lisbon, Portugal, January, 2014, 1–8.
Wei, Y., Zhao, T., Wang, J., and Zhang, X. (2021). Exploring the impact of transition in energy mix on the co 2 emissions from China’s power generation sector based on ida and sda. Environ. Sci. Pollut. Res. 28, 30858–30872. doi:10.1007/s11356-021-12599-1
Yan, C., Li, Z., Zhang, Y., Liu, Y., Ji, X., and Zhang, Y. (2020). Depth image denoising using nuclear norm and learning graph model. ACM Trans. Multimedia Comput. Commun. Appl. (TOMM) 16, 1–17. doi:10.1145/3404374
Yang, P. P.-J., Putra, S. Y., and Li, W. (2007). Viewsphere: a gis-based 3d visibility analysis for urban design evaluation. Environ. Plan. B Plan. Des. 34, 971–992. doi:10.1068/b32142
Yang, Y., and Newsam, S. (2008). “Comparing sift descriptors and gabor texture features for classification of remote sensed imagery,” in 2008 15th IEEE international conference on image processing (IEEE), San Diego, CA, USA, October, 2008, 1852–1855.
Yin, Z., and Shi, J. (2018). “Geonet: unsupervised learning of dense depth, optical flow and camera pose,”, Proceedings of the IEEE conference on computer vision and pattern recognition, Salt Lake City, UT, USA, June, 2018, 1983–1992.
Zhang, L., and Tam, W. J. (2005). Stereoscopic image generation based on depth images for 3d tv. IEEE Trans. Broadcast. 51, 191–199. doi:10.1109/tbc.2005.846190
Zhao, L., Yang, J., Zhang, Y., and Huang, J. (2022a). “Research on feature matching of an improved orb algorithm,” in 2022 IEEE 6th Information Technology and Mechatronics Engineering Conference (ITOEC), Chongqing, China, March, 2022, 765–769.
Zhao, X., Ma, X., Chen, B., Shang, Y., and Song, M. (2022b). Challenges toward carbon neutrality in China: strategies and countermeasures. Resour. Conservation Recycl. 176, 105959. doi:10.1016/j.resconrec.2021.105959
Zhou, F., Cui, Y., Gao, H., and Wang, Y. (2013). Line-based camera calibration with lens distortion correction from a single image. Opt. Lasers Eng. 51, 1332–1343. doi:10.1016/j.optlaseng.2013.05.010
Zhou, Y., Li, B., Li, Y., and Wang, D. (2019). “Improved-orb-based slam using rgb-d data,” in 2019 Chinese Control And Decision Conference (CCDC), Nanchang, China, June, 2019, 4944–4949.
Keywords: 3D mapping, digital twin system, electric substation construction, multi-camera vision, real-time CO 2 estimation, simultaneous localization and mapping (SLAM)
Citation: Wang C, Yuan H, Bian Q, Zhao C, Zhou B, Chen Z and Basit MA (2024) Multi-camera vision-based synchronous positioning and mapping for green construction of electric substations. Front. Energy Res. 12:1370873. doi: 10.3389/fenrg.2024.1370873
Received: 15 January 2024; Accepted: 21 March 2024;
Published: 23 April 2024.
Edited by:
Minglei Bao, Zhejiang University, ChinaReviewed by:
Licheng Wang, Zhejiang University of Technology, ChinaChao Guo, Hangzhou City University, China
Copyright © 2024 Wang, Yuan, Bian, Zhao, Zhou, Chen, and Basit. This is an open-access article distributed under the terms of the Creative Commons Attribution License (CC BY). The use, distribution or reproduction in other forums is permitted, provided the original author(s) and the copyright owner(s) are credited and that the original publication in this journal is cited, in accordance with accepted academic practice. No use, distribution or reproduction is permitted which does not comply with these terms.
*Correspondence: Zhuozhou Chen, a2V0b3J5QDE2My5jb20=