 Shreekant Varshney1*
 Chandra Shekhar2A. V. Dhanunjaya Reddy3K. S. Pritam1
 M. V. V. Prasad Kantipudi4
 Hossam Kotb5
 Kareem AboRas5Mohammed Alqarni6
- 1Department of Mathematics, Pandit Deendayal Energy University, Gandhinagar, India
- 2Department of Mathematics, Birla Institute of Technology and Science, Pilani, Rajasthan, India
- 3Department of Mechanical Engineering, Srinivasa Ramanujan Institute of Technology, Andhra Pradesh, India
- 4Department of Electronics and Tele-Communication Engineering, Symbiosis Institute of Technology, Symbiosis International University, Pune, Maharashtra, India
- 5Department of Electrical Power and Machines, Faculty of Engineering, Alexandria University, Alexandria, Egypt
- 6Electrical Engineering Department, University of Business and Technology, Jeddah, Saudi Arabia
The current research proposes optimal management strategies for queueing modeling-based renewable energy systems with hyper-exponentially distributed maintenance/repair under the assumption of an admission control policy. Using the concept and steps of the matrix-analytical method, the steady-state probability distribution associated with energy systems is explicitly presented. A relatively straightforward computation that can help with modeling wind energy generation, investigating wind farm performance, optimizing energy based on system storage, reliability inspection, service maintenance planning, and numerous other purposes can be employed to mathematically derive several system performance indicators. The investigation findings are validated via quantitative outcomes, illustrative possesses, and a step-by-step recursive methodology for efficient management of the renewable energy system. Additionally, considering multiple governing parameter values, the nature-inspired optimization technique, Cuckoo Search (CS), is employed to demonstrate the optimum anticipated cost of renewable energy system. A comparison with other metaheuristics and semi-classical approaches is also presented to establish the best convergence results. In order to help system designers, policymakers, engineers, and researchers, several numerical examples are also provided to construct more practical strategies based on the production of energy, storage, and system management. The economic, parametric, and performance investigation findings are highlighted, and the opportunities and recommendations for further research are provided. In a nutshell, the outcomes of the present analysis can be adopted to formulate the most effective economic strategies and regulate decision-making processes in the energy sectors.
1 Introduction
The management and controlling the inflow of energy from renewable sources is a process used by system designers, engineers, and policymakers to enhance better service strategies and provide a high grade of service to individuals based on energy demand fluctuations in the energy systems. This type of queueing scenario specifies the demand management of energy or energy storage and buffering in any industry or organization. Energy generation assets can be available for the better service in real-time scenario as per service distribution and can be changed as per requirement. In this era of modernization, management and control of energy flow from renewable sources in the energy systems becomes a primary concern. Therefore, the optimal management strategies to control energy dispatch and distribution in energy systems is a challenge for decision/policymakers, scholars, and researchers from an economic point of view. In the queuing literature, it has been observed that controllable queuing systems, in general, have no buffer for long-term waiting demands. Therefore, these systems are also known as a loss system. Stidham Jr and Weber (1993) provided a survey based on optimal control of the broad network of queues and emphasized the models based on Markov decision theory. Furthermore, over the recent past, many studies related to optimal management and control of queues have been provided that can help researchers and investigators to enumerate various system parameters for better service strategies (cf. Aghighi et al. (2021); Jain and Sanga (2020); Wu and Yang (2021); Yang (2022)).
In the congestion situations that occur in our day-to-day life and technical/managerial circumstances, it has been found that phase-type services within queueing-based systems are essential in outlining and examining Markovian/Non-Markovian queueing problems. In conventional queueing problems, each newly joined individual requires the primary service to be accomplished in a single phase. Though, in many realistic circumstances, it has been examined that service provisioning may be performed in many different stages. The concept of phase-type service was first proposed by Jackson (1954) utilizing the queueing-theoretic approach in literature. Generally, the mean time of inclusion of a continuous stochastic process for a single system state can be characterized by the distribution that follows a phase-type service (cf. Latouche and Ramaswami (1999)). The concept of phase-type service patterns has been extensively used in various models involving stochastic applications in diverse fields, namely, telecommunications, finance and portfolio management, reliability engineering, queuing modeling, biotechnology and biostatistics, supply chain, inventory control, etc. The phase-type service discipline has gained considerable popularity among researchers and systems analysts in the queuing literature because it constitutes a uniform and versatile class of distributions described by nonnegative real numbers that confer dominance over algorithmically controllable queuing models. In the past, several illustrations have been performed based on numerous queueing nomenclatures along with phase-type service patterns (cf. Dudin and Dudin (2016); Dudin et al. (2016); Dudin and Dudina (2019)).
In recent times, the growing interest in maximizing energy utility and productivity from renewable sources, energy distribution and storage has contributed significantly to research on queuing-based renewable energy systems (cf. Kocaman et al. (2016); Talari et al. (2018); Noorollahi et al. (2020); Samain et al. (2021); Baik and Ko (2023); Momenitabar et al. (2023); Nagababu et al. (2023); Patel et al. (2023)). To the best of our collective understanding, no literature-based investigation has yet been presented on the economic and performance evaluations of renewable energy systems with admission control and hyper-exponentially distributed maintenance/repair. Our motivation for the current study stems from the literature’s lack of qualitative research opportunities. Besides, inspired by the adaptive capabilities of the nature-inspired CS and PSO algorithms, optimal system design parameters and the total anticipated cost associated with the renewable system have been calculated utilizing these evolutionary algorithms. The present research aims to assist practitioners, system analysts, and policymakers in constructing and analyzing the queueing-theoretic stochastic modeling of renewable energy systems. The novelty of the current research is to achieve the proper characterization based on convergence results and statistical inference incorporating different evolutionary algorithms. In algorithms. In addition to the parametric analysis, a comparative investigation among CS, PSO algorithms, QN, and DS methods is also provided to verify the optimum combinations of design variables and the superiority of the metaheuristics. The primary contribution of the present investigation is the execution of the MATLAB codes along with associated algorithms for an empirical comparison of the research findings of the CS algorithm, PSO algorithm, QN method, and DS method with respect to computational time, statistical parameters, and standard operating procedures, etc.
In order to propose the best energy management approaches, the primary objectives of the present investigation are to analyze and estimate the system performance indicators to demonstrate the efficiency, utility, and quality performance of the energy systems. The entire research can be categorized into categories as follows.
(i) To categorize a novel and challenging stochastic scenario based on congestion situations that corresponds to a practical renewable energy system in a random environment;
(ii) To establish an adequate mathematical approach to interpret the numerical results according to equilibrium conditions;
(iii) Demonstration, analysis, and classification of numerous energy systems’ efficiency metrics depending on fluctuations in energy consumption, transmission of energy, cost-effective generation, and strategies used for controlling and managing the energy generated by renewable energy sources;
(iv) To identify the essential energy system characteristics required for maintaining the service system’s higher efficiency;
(v) Utilization of evolutionary algorithms, such as PSO and CS algorithms, for the economic investigation of constructed queueing-based renewable energy system;
(vi) To validate the convergence results produced by the cost optimization problem by comparing the PSO, CS, QN, and DS algorithms.
The current study addresses a variety of stochastic problems pertaining to queue-based energy systems that originated and evolved in accordance with numerous industrial, managerial, and economic problems. The following points highlight how the research findings analyzed for the developed model in the present investigation differ from the outcomes of previous research.(i) To demonstrate the equilibrium queueing distribution employing the matrix-analytical approach for the energy system having finite buffer storage with admission control policy and hyper-exponential service pattern;
(ii) To establish a specific optimization problem and demonstrate which optimization approaches are most effective in minimizing the energy system’s overall anticipated expenditure;
(iii) To construct the converging results in terms of optimum cumulative values of discrete and continuous system design parameters F, μ1, and μ2, simultaneously by implementing semi-classical optimizers: QN and DS methods and nature-inspired algorithms: CS and PSO algorithms.
2 Literature review
Examining the subsequent research investigations drawn from the queueing literature could suggest essential perspectives on how stochastic/Markovian modeling can be utilized in the context of renewable energy systems. A more comprehensive understanding of the theoretical foundations and efficient strategies for enhancing the reliability and effectiveness of renewable energy systems may be acquired through the investigation.
2.1 Control policies
The quality-of-service (QoS) and efficiency of service systems can be characterized in terms of the variable number of active units, the number of servers available/service rate of the service provider, throughput, total anticipated cost of the service system, etc. In our daily life, there is a requirement to control the queues as it causes resource consumption, high operational costs, additional energy expenditures, and contrary environmental impacts of these consumptions. Thus, analysis of queue discipline, queue-size distribution, and control policies to minimize the waiting period can lead to more efficient service systems with positive significance in reaching viable development goals. The control of queues in service systems can be classified in two ways, first includes the arriving control policy (F-policy), introduced by Gupta (1995). The other are service control policies, namely, the T-policy, N-policy, and D-policy, which are proposed by Heyman (1977), Yadin and Naor (1963), and Balachandran (1973), respectively. Apart from that, several research problems can be found in the queueing literature on the controllable queues (cf. Chang and Ke (2011); Efrosinin D. V. et al. (2018); Shekhar et al. (2017); Yang and Wang (2013); Yang et al. (2010; 2011); Yeh et al. (2017)), which put the controlling policy in the context of Markovian/Non-Markovian queueing system. Recently, Chen (2018) studied the finite population machining system and performed the sensitivity investigation for reliability and mean-time-to-first-failure (MTTFF). Efrosinin D. et al. (2018) studied the queueing situation incorporating the Markov arrival process (MAP) and analyzed the deterministic control strategies for the distribution of arrived customers among the available servers. Again, Efrosinin and Sztrik (2018) extended the work done in Efrosinin D. et al. (2018) for the unreliable heterogeneous servers and provided the algorithms for finding the MTTF, reliability function, and stationary reliability characteristics for the machining repair system. To stabilize a partially-controllable network, Liang and Modiano (2019) designed the optimal control algorithms. They investigated the system states where the controllable and uncontrollable nodes use the dynamics of queue-dependent service systems. Further, Shekhar et al. (2020b) investigated a controllable queue with vacation interruption of the service provider. They applied the matrix-analytical approach to determine the closed-vector form expressions of several system performance indicators. In the last 4 years, many scholars and researchers, including Yen et al. (2020), Yang et al. (2021), Safaei et al. (2022), and Wu et al. (2023), used different solution methodologies and optimization algorithms to study the admission control policy under different hypotheses via queueing-theoretic approach.
2.2 Service in phases
Numerous mathematicians and research analysts have studied optional phase-type services to improve queue-based service systems’ workability, utility, and service quality (cf. Flatto (1985); Flatto and Hahn (1984); Sharma (2014); Wang et al. (1999; 2004)). Shang and Wolter (2016) addressed the impact of the probability of messages in terms of packets on the execution of open-flow networks using the queueing-theoretic approach. They provided the expressions based on the sojourn time distribution for switches and controllers. Tarasov and Bakhareva (2018) analyzed three different queueing models based on service in phases. They proposed an approach to calculate the expected values and variances of the time intervals using the general assumptions of the probability distribution between the system states. In recent years, Tarasov (2022), Khayyati and Tan (2022), and Kumar and Jain (2023) examined the queueing-based service systems and discussed different methods for the numerical approximation of queue-size distribution under diverse service regimes.
Queueing systems following Earlangian distributed service patterns have also been considered in different frameworks recently. One can easily extend the single server Markovian queueing models to the Earlang models utilizing a series of exponential and identical service phases using several theoretical aspects and phenomenons of queueing modeling. The Erlang-type service distribution produces much better flexibility in modeling real-time service patterns that does the exponential. Further studies on this topic were done by many researchers (cf. Baek et al. (2014); Griffiths et al. (2006); Yu et al. (2011); Yue et al. (2009); Zhang et al. (2016)). Besides, Liu and Fralix (2019) employed the lattice path counting techniques to examine the time-dependent and equilibrium behavior of continuous-time Markov chains (CTMC) and Markovian queueing systems. More recently, Pandey and Gangeshwer (2020) utilized the probability-generating function approach to derive the steady-state queue-size distribution by employing the ambulance service as a server.
2.3 Evolutionary algorithms
Due to the complex stochastic problems, the conventional linear and nonlinear optimization techniques, namely, LPP, and gradient-based algorithms, are usually insufficient to demonstrate solutions to such problems efficiently. Evolutionary algorithms such as heuristics and metaheuristics are among the best solution techniques used in various computational, engineering, and industrial problems because they provide efficient solutions to complex stochastic problems in reasonable time intervals. Most of these are motivated by wild animals’ physical and biological behaviors and use Darwin’s theory of sustainability of the fittest. For instance, taking inspiration from birds flocking and fish schooling, Kennedy and Eberhart (1995) introduced the particle swarm optimization (PSO) algorithm. In contrast, the clever algorithm, namely, the bees optimization algorithm, was established by taking motivation from the social grouping behavior of honey bees (cf. Pham et al. (2006)). New optimization algorithms, including cuckoo search (cf. Bulatović et al. (2013)) and an algorithm having flashing behavior of fireflies (cf. Yang (2009)) have also been recently evolved. During the past decade, the aforementioned techniques have been extensively implemented to solve several decision-making situations in supply-chain management, inventory problems, production systems, scheduling problems, etc (cf. Khajehzadeh et al. (2013); Kumar et al. (2022); Shekhar et al. (2021); Subbaiah and Kannayaram (2021); Zhang et al. (2011)).
Yang and Deb (2009) developed the cuckoo search (CS) algorithm in 2009 by motivating the adaptation to parasitism of cuckoos. Cuckoos lay their eggs in other species’ communal nests for reproduction. In fact, for the CS algorithm to execute, host eggs in a host nest must always be distinguished from cuckoo eggs. After spotting cuckoo eggs, birds have two options: either abandon the eggs or permanently abandon the nest and construct a new one. Certain cuckoos have developed a specialization in imitating host bird eggs, which lowers their risk of being recognized and leaving the nest and boosts their chances of reproducing. CS performs significantly better than PSO and other algorithms. In addition, because of its assured global convergence quality, it is appropriate for multi-modal/multiple constraint-based optimization problems, such as queueing aspects, inventory management, mechanical design, computer graphics and computer vision, and many more. Moreover, the CS algorithm requires minimal algorithmic parameters than the PSO algorithm and several other population-based optimization methods. Because of its enhanced efficiency, the CS algorithm is best suited for a wide range of real-time optimization problems. Several computer scientists, engineers, decision-makers, and academicians have recently used various nature-inspired algorithms for multi-objective complex optimization problems. They emphasized various selection strategies of these algorithms (cf. Baskar (2023); Dwivedi et al. (2022); Gupta et al. (2023); Han et al. (2023a; b); Li et al. (2023a; b,c); Liu et al. (2022); Mareli and Twala (2018); Mitra and Acharyya (2022); Rani et al. (2023); Sahu et al. (2023); Shehab et al. (2017); Zhang et al. (2019)).
3 Model description
3.1 Practical justification of the model
In the context of the renewable and wind energy sectors, the proposed queueing framework can be viewed as a special type of queueing model incorporating a hyperexponential service time distribution with a Markovian arrival procedure and a single server. It can be implemented significantly in many scenarios, including modeling wind energy generation, performance investigation of wind farms, storage systems for energy optimization, reliability inspection, service planning, and maintenance planning. The designed queueing framework can be used to establish an efficient forecasting system for estimating wind energy production. This mathematical model might help to predict and forecast the outcomes of wind energy infrastructure, enabling enhanced management and planning of energy generation. It empowers the scenario by incorporating the variations of wind speeds and their impact on the generation of energy as a Markovian process. Additionally, by combining the variations in wind speed and the resulting energy production, this model can help to determine the effectiveness of wind farms. The suggested queueing model can provide perspectives on the efficient operation of energy conversion procedures within wind farms by analyzing the arrival and service times of wind energy production, however, enabling it to be easier to recognize feasible challenges and opportunities for optimization.
The proposed queueing model based on a hyperexponential service pattern can be used to enhance the performance of energy storage systems concerning the intermittent nature of wind energy. This model can help to identify the ideal dimensions, location, and functioning of energy storage units within the renewable energy framework. Thus, enhancing energy efficiency and the grid’s stability, It accomplishes this situation by considering the stochastic nature of energy inflows and outflows. Further, the developed queueing model may aid with the development of optimal management strategies for planning services and maintenance scheduling for wind energy installations. This approach can help optimize the scheduling of maintenance operations/activities, minimize downtime, and maximize the overall operational efficiency of wind energy infrastructure by examining the arrival and service times of maintenance requests and considering the stochastic nature of the system breakdowns. The wind and renewable energy industries can discover considerable information concerning system performance, reliability, and operational effectiveness via the proposed queueing model. It will help researchers, system designers, and decision-makers to develop more effective approaches based on energy production, storage, and controlling energy systems.
3.2 Assumptions and notations
In this section, strategies established to monitor and regulate the proportion of energy generated by renewable sources with hyper exponentially distributed repair of energy infrastructure are discussed in detail. The concept of the consumer’s arrival and customer service procedure in the queueing modeling can be associated with numerous factors related to the energy generation and distribution processes, namely, energy demand fluctuations, load balancing, grid integration, maintenance, and repairs, et cetera in context with the wind and renewable energy fields. Inspired by these actual situations, the following fundamental assumptions for the queueing modeling have been presented for analysis purposes.
Arrival Pattern.
•Customers enter the system and proceed in accordance with an independent Poisson process using λ as a parameter. If the server is already occupied, the subsequent arriving customer joins the waiting queue in the system; otherwise, he receives service immediately.
•Depending on the access in the system, the newly arrived customers arrange themselves into one particular waiting line.
•The system has two different categories of customers: type-1 and type-2. The likelihood that a new type-1 (or type-2) customer will enter the system is p (or (1 − p)).
•The system prohibits any customer from joining the system until the size of the queue surpasses a prefix threshold value F after the system’s capacity K is reached.
Service Pattern.• For type 1 and type 2 customers, the service times follow an exponential distribution with corresponding parameters, μ1 and μ2, respectively.
• When customers are permitted to rejoin the system to begin the service, the service provider needs an exponentially distributed startup time with rate parameter γ.
All processes and occurrences happened repeatedly and independently of one another.In order to model the system states of the developed model at time t, the states are described asThen,
It signifies the irreducibility of the Markov chain
Now, employing the appropriate birth-death axioms and preventing the transitions from inflow to outflow in equilibrium, the governing set of Kolmogorov differential equations is constructed to demonstrate the state probabilities linked with different system states as follows.
(i) Customers are permitted to join the system during idle state of the server.
(ii) Customers can join the service system while the service provider is active and the in-service customer is a type 1 customer.
(iii) Customers can join the service system while the service provider is active and the in-service customer is a type 2 customer.
(iv) Customers can not enter in the system during idle state of the server.
(v) Customers cannot join the system during servers’ busy period; however, the in-service customer is of type 1.
(vi) Customers cannot join the system during servers’ busy period; however, the in-service customer is of type 2.
The state probabilities for the steady-state characterization in equilibrium (i.e., as t → ∞) are shown as follows
4 Model formulation
4.1 Matrix analytic method
In general, it is not straightforward to derive the equlibrium state probabilities from the governing differential equations. The reason is the existence of multiple variables, multiple equations, and numerous parameters in stochastic environments. Many researchers followed Neuts (1981) matrix solution technique to tackle such types of complex engineering and queueing situations. Therefore, the transition block matrix Q is represented in the subsequent manner to figure out the flow balance differential-difference equations for the probability distribution.
where, the block-diagonal matrices A0 and A3 are the square matrices of order 2, while A1, A2 and C2 are the square matrices of order 4. Similarly, block matrices B0 and C3 are the rectangular matrices of dimension (2 × 4) and B2 and C1 have the dimension (4 × 2), respectively. The block sub-matrices for the environmental process are A0, A1, A2 and A3. In contrast, the super and sub-diagonal matrices for the Markov process are B0, B1, B2, C1, C2 and C3 having elements λ, μ1, μ2 and p, respectively. The following are the structures of each block sub-matrix of the rate matrix Q.
With the transition rate matrix Q partitioned in Π0, Π1, Π2, …, ΠK−1, ΠK, such that
Now, using a recursive approach, state probability vectors are obtained after suitable substitution in the following form
and
Again, the equilibrium probability vector Πn in the compact form of Xn; n = 0, 1, 2, …, K − 1 can be efficiently interpreted as
Let e1 and e2 are the column vectors having form [1 1 1 1]T, [1 1]T, respectively. Hence, the normalization condition is re-expressed as
Finally, the normalizing conditions closed-form expression takes the following form.
Therefore, using the vector Eq 24 and the normalization condition (26), one can easily demonstrate the probability vector ΠK. In addition, all the additional probability vectors of steady-state probabilities are easily determined by substituting ΠK in Eq 25. These probability vectors and steady-state probabilities are utilized to construct several systems’ quality performance indicators and the anticipated cost function in the following sections to authenticate our modelling and approaches.
4.2 System performance measures
To estimate the service quality and efficacy of the established model, several performance indicators of the system are defined in the context of the equilibrium probabilities of various states and closed vector form representation. The system’s key performance indicators are expressed as following.
• Average count of customers in the system
• Average number of waiting customers
• Probability associated to the busy state of the server
• Probability associated to the idle state of the server
• Throughput of the system
• The probability that customers are re-allowed to enter the queueing system
• The probability that customers are blocked
• The effective arrival rate of the customers
• Total anticipated waiting period of customers in the system
4.3 Cost function
The optimization function of the governing model is developed in this section, which benefits system analysts, decision-makers, and system engineers in decision-making by finding the appropriate operating policies and service and maintenance costs. The proposed model considers three decision variables: F, μ1, and μ2. Our intuition’s fundamental goal is to present the optimum threshold value F* and the preferred service rates
The cost function is characterized as follows using the queueing-theoretic framework and the fundamental principle enabling the utilization of the aforementioned cost elements.
The discussed model’s cost minimizing problem can be mathematically represented as an unconstrained problem in the following manner
5 Economic analysis
Economic investigation is a comprehensive approach to understanding and evaluating diverse financial decisions, policies, and circumstances. It is usually associated with examining the advantages and disadvantages of a statistical procedure or methodology. It is usually associated with examining the advantages and disadvantages of a statistical procedure or methodology. Economic researchers typically use economic and statistical methods to balance both advantages and disadvantages to establish whether a decision is feasible from a financial perspective. Furthermore, economic investigation involves analyzing how different strategies affect stakeholders and determining whether the approach meets its primary objectives. Statistical and economic analysis makes logical decisions possible based on mathematical and economic principles and enhances rational decision-making by considering marginal analysis, opportunity costs, and trade-offs. Therefore, from an economic perspective, one can demonstrate that resource allocation optimization, cost minimization, service quality improvement, and customer satisfaction depend on the economic analysis of queuing models. In fact, a thorough understanding of system dynamics, customer behavior, and trade-offs between various costs and benefits is essential to make better economic decisions that support corporate objectives.
The majority of real-time stochastic optimization problems are typically nonlinear and have a high degree of complexity in nature due to the presence of multiple combinatorial constraints, which makes it very challenging to compute the solution analytically. In addition, other associated cost elements further increase the complexity of these optimization problems. In order to overcome this restriction, effective alternative solutions are needed, including global optimizers like metaheuristics and gradient-based optimization algorithms, which are particularly effective in solving such kinds of problems numerically. Using the conceptual framework of the CS algorithm, an optimization approach that depends on natural circumstances is carried out for the economic investigation purpose in the current research. Under the same constraints and service system-based decision-making processes, the outcomes are compared to the research findings of the well-known evolutionary optimization method, PSO technique, and heuristics like DS and QN approaches. For the detailed study and utilization of these algorithms in the context of queueing-based service systems, refer to (cf. Shekhar et al. (2020b); Shekhar et al. (2020a; c)) and references therein. Furthermore, the subsequent subsections provide a more detailed description of the procedures involved in these algorithms in order to visualize the necessary successive iterations.
5.1 Cuckoo Search Algorithm
One of the most prominent nature-inspired optimization computational techniques, cuckoo search is widely applied to tackle a variety of challenging and realistic optimization concerns in different engineering fields, namely, queueing systems, inventory systems, manufacturing systems, and many more. It is much more convenient than the other heuristic techniques for solving stochastic global optimal. This is because it can use the switching parameter to maintain a balance between the local and global random walks. The CS algorithm takes its source of inspiration from the behavior of brood parasites, a natural occurrence that may be transformed into an optimization problem as follows.
• When acting like a search agent, each cuckoo only lays one egg at a time in a nest that has been randomly searched. The term randomly selected nest corresponds to the problem’s solution.
• A certain number of eggs are passed down from generation to generation. The fitness functions of all agents at the current solution point are evaluated to identify the most suitable solutions.
• The host bird has a chance with probability qa of identifying the cuckoo’s egg inside its nest. It is commonly referred to as switching probability for optimization algorithms and is used to conduct exploitation and exploration.
• Nest positions are modified in the neighborhood such that the eggs in each nest compete to be the best. It is described as a CS algorithm exploitation process.
• Most likely, the parent birds will evacuate the nest and arbitrarily construct a new one. When certain agents are unable to locate a better solution in their immediate region, exploration for a new solution is conducted in this type of situation.
The behavior of local and global random walks is one of this algorithm’s primary concerns. This algorithm’s switching parameter qa balances the usage of a local random walk and a global exploratory random walk. The local random walk can be defined aswhere β is the step size,
Global convergence, as mentioned earlier, is responsible for its effectiveness and the broad range of applications. Levy flights regulate the CS algorithm’s global random walks. The exponentially decreasing tails of the distribution function in isotropic random walks make significant step sizes less likely than in population-based approaches. Animals, birds, and insects use L’evy flights to generate extremely rational random walks for a variety of survival methods, including searching for food. Due to its power characteristics, the L’evy distribution (40) has a strong tail and permits substantially larger step sizes than the normal distribution.
where
In the present scenario, the scaling factor for step size is ω1 > 0. It should be chosen on the basis of the problem’s characteristics. Eq. 38 uses the formula
The step-size β in Mantegna’s algorithm may be computed by using the concept proposed by Yang (2014).
where u and Ξ are opted from the Gaussian distribution, i.e.,
When |β|≥|β0|, where β0 is the least step exists, the distribution of β follows the predicted L
Algorithm 1.Pseudo-code.
Input: Size of the population, shifting parameter, and system parameters (all having constant values)
Output: Determine the cost function’s value TC corresponding to the approximated solution (F, μ1, μ2)
Phase 1: Initialization of host nest population through objective function
while (t < MaxGeneration) or (Stoping framework)
Phase 2: Get the cuckoo at random
Phase 3: Develop a solution employing L
Phase 4: Examine the solution’s effectiveness or objectivity
Phase 5: Choose one nest at random from n nests
if(TCi < TCj)
Substitute j by the updated outcome i
end
Phase 6: Abandon worse nests with fraction (qa)
Phase 7: Create new perspectives while preserving the best options (or nests using better alternatives
Phase 8: Determine the actual best by ranking the solutions
Phase 9: Keep updating t←t+1
end while
Outcomes from post-processing and visualizations
5.2 Particle swarm optimization
An optimization technique named PSO is extensively utilized to tackle a diverse set of situations. The PSO algorithm was first suggested by Kennedy and Eberhart (1995). The grouping behavior of a community of fish or birds that schools together served as the model for such a stochastic optimization technique. The PSO method uses a particle population that roams randomly through the search space. Based on every particle’s best position (p-best) and common/global best positions (g-best) in the search area, its intrinsic velocity as well as position are updated. Each particle’s velocity component is updated according to a predetermined formula. The updated velocity is determined from the particle’s position, current velocity, and the swarm’s local best and common best positions. The modified velocity of each particle is subsequently utilized to determine its new position. This procedure continues until the swarm identifies the best solution.
Assume that Yi and Ui are the particles’ location and velocity vectors of the ith polpulation agent, resp ectively. The velocity formula may be further organised using the procedure given below
where β(1) and β(2) are learning variables with numerical value as 2. ξ1 and ξ2 are two randomly generated vectors having components ranging from 0 to 1. Hence, the ith particle’s updated position formula is expressed as
To control the exploitation and exploration between each particle, an inertia function ψ2(t) is used further by Shi and Eberhart (1998) in the PSO approach. So the reframed equation of velocity can be depicted as
Further, the range of 0.5–0.9 is chosen as the expected value of the inertia function ψ2(t).
Besides this, PSO has been utilized to resolve a numerous of global optimization issues, including difficulties concerning cost and economic efficiency. It is a preferred feature for resolving challenging computational optimization problems because of its flexibility to simultaneously exploiting and exploring the region of search interest. In conclusion, PSO is a dynamic optimization algorithm that uses a swarm of particles to explore and take advantage of the search space. It has become a popular alternative for resolving challenging combinatorial optimization problems because of its capacity to explore and exploit the solution area continuously.
The following is a representation of the PSO technique’s pseudo-code.
Algorithm 2.PSO technique: Pseudo-code.
Input: Initial parameters’ values, density of the population, and learning variables.
Output: Estimate a basic solution
Phase 1: Initialization: locate n particles locations Yn.
Phase 2: Demonstrate G* from
Phase 3: while
for (n agents and dimension d).
Phase 4: Explore updated speed of the ith moving agent
Phase 5: Locate current location for the ith agent
Phase 6: Investigate the cost value at updated locations
Phase 7: Discover the p-best of each agent
end for
Phase 8: Keep Updating g-best G*.
t → t + 1
end while
Phase 9: Updated research findings
Phase 10: Final outcomes of cost optimization problem: TC* at G*.
5.3 Quasi-Newton method
Executing the convergence analysis of the cost function (36) analytically is challenging because of the high degree of convexity and significant non-stationary behavior of the derived cost optimization problem. In the queueing literature, many researchers used traditional optimization approaches to overcome this restriction for numerical simulation. As a result, the Quasi-Newton (QN) methodology is used to illustrate the optimal combinations of the system design variables μ1 and μ2 together with the optimum anticipated cost. The expected cost function’s optimal value (36) is achieved by iteratively searching the values of μ1 and μ2 in the QN methodology. For this purpose, the vector representation Ω0 first initializes the design parameters μ1 and μ2. Next, the cost optimization problem’s gradients are mathematically estimated in the subsequent steps.
Algorithm 3.Quasi-Newton method: Pseudo-code.
Input: Initialization of the vector
Output: Calculate the appropriate cost
Phase 1: Calculate TC(Φ(0)) by interpolating the actual trial solution Φ(0).
Phase 2: while
Phase 3: Compute the gradient of cost function
Phase 4: Keep updating the test solution
end
Phase 5: Final outcome
5.4 Direct-Search method
The Direct-Search (DS) technique is employed to achieve the appropriate value F*, resulting in the anticipated function having its least value, say TC*. The least cost problem can now be analytically represented as follows
The following is a representation of the DS method’s pseudo-code.
Algorithm 4.Direct-Search method: Pseudo-code.
Input: K and all other system parameters.
Output: Initialization of
Phase 1: forF=1 to K − 1
Phase 2: Fix a initial iteration (μ1, μ2)
Phase 3: Utilize the QN approach to calculate the pair
Phase 4: if diverging solution obtained, return to step 2 end if
Phase 5: if
Phase 6:
Phase 7: end if
Phase 8: end
Phase 9: Outcomes
6 Numerical results
The present investigation examines the Markovian circumstances’ significant and quantitative outcomes based on the hyper-exponential service approach. In this context, many different formulae for quality performance measurements in closed vector form are presented for straightforward computation. In order to validate our hypothesis and methodology, this section performs numerical simulations using a variety of numerical experiments. To commence the quantitative simulations, the system variables’ default values are taken as K = 15; F = 7; λ = 0.6; μ1 = 0.8; μ2 = 0.8; p = 0.7 and γ = 2.0. In addition, the distribution of probability in an equilibrium state is mathematically illustrated opting the MATLAB (2018b) software and the matrix solution method.
Based on various considerable adjustments to the system parameter values, the sensitivity investigation for the anticipated customers in the service system (LS) is carried out for the parametric analysis, as shown in Figure 1. The variability of LS with mean arrival rate (λ) for varied values of the system’s capacity (K) is shown in Figure 1I. It makes intuitive sense that the length of the queue would increase with higher values of λ. More demonstration of the variable nature of K is provided because for a fixed extent of λ and incremental variation of K, the value of LS improved in a consistence manner. In other words, at higher values of K, a relatively large value of LS is observed. The value of LS seems to increase for increasing values of λ in Figure 1iii, iv; however, for a fixed value of λ, the opposite behavior is observed for increasing values of μ1 and μ2, which is pretty apparent. Similar trends of LS are perceived for increasing pattern of the other system parameters in the other sub-figures.
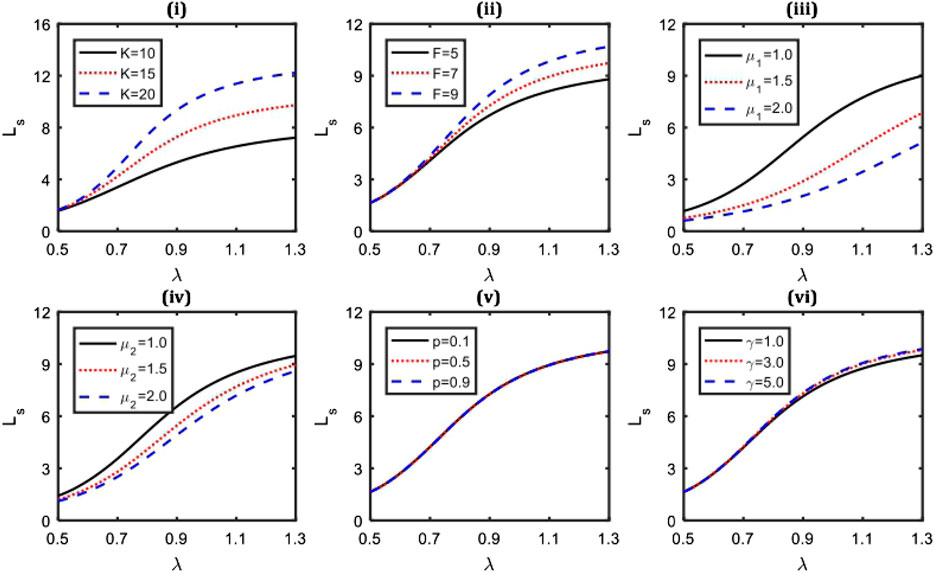
FIGURE 1. Anticipated customers in the system (LS) with respect to λ for different system parameter values.
The consequences of the parameters μ1, and μ2, together with the various combinations of the system parameters K, F, p, and γ, on the throughput of the service system (τP), are illustrated in Figures 2, 3. The system’s throughput (τP) improves as the value of the service rate μ1 appears to increase with the higher values of K, F, and γ, as shown in Figures 2I, ii,iv. However, it can be observed in Figure 2ii, iv that the rate of incremental change in the τp is slightly slower for higher values of γ. The higher values of p in Figure 2iii exhibit the reverse tendency, indicating that the lower value of p in such service systems is best suited to increase the number of consumers served in the system. Particularly in comparison to this, it is possible to recognize that the research outcomes correspond with the perception from Figure 3.
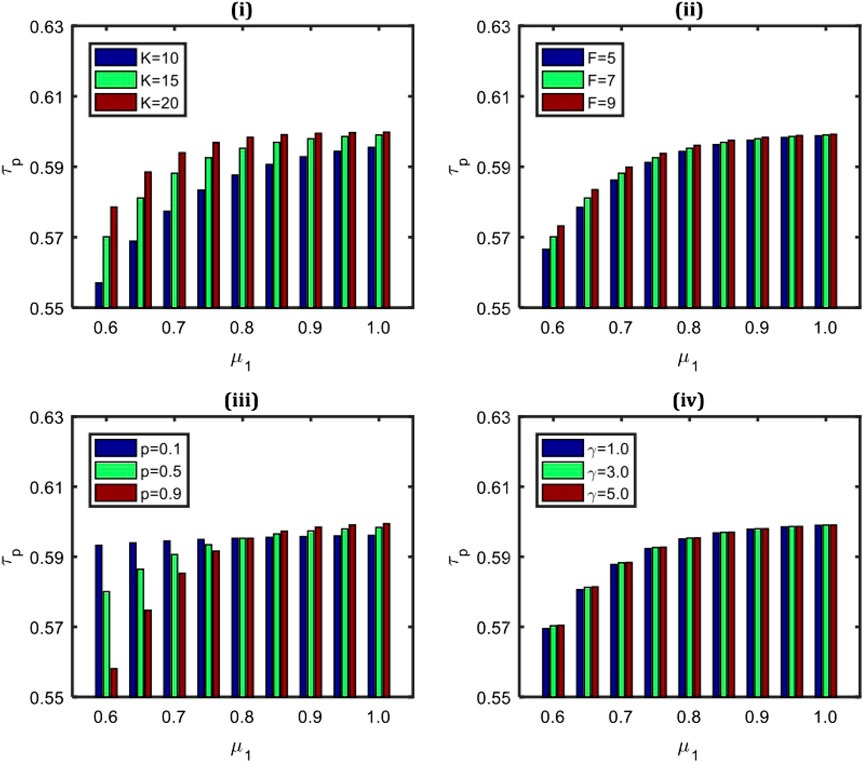
FIGURE 2. System throughput (τP) measured in terms of μ1 for various system parameter values.
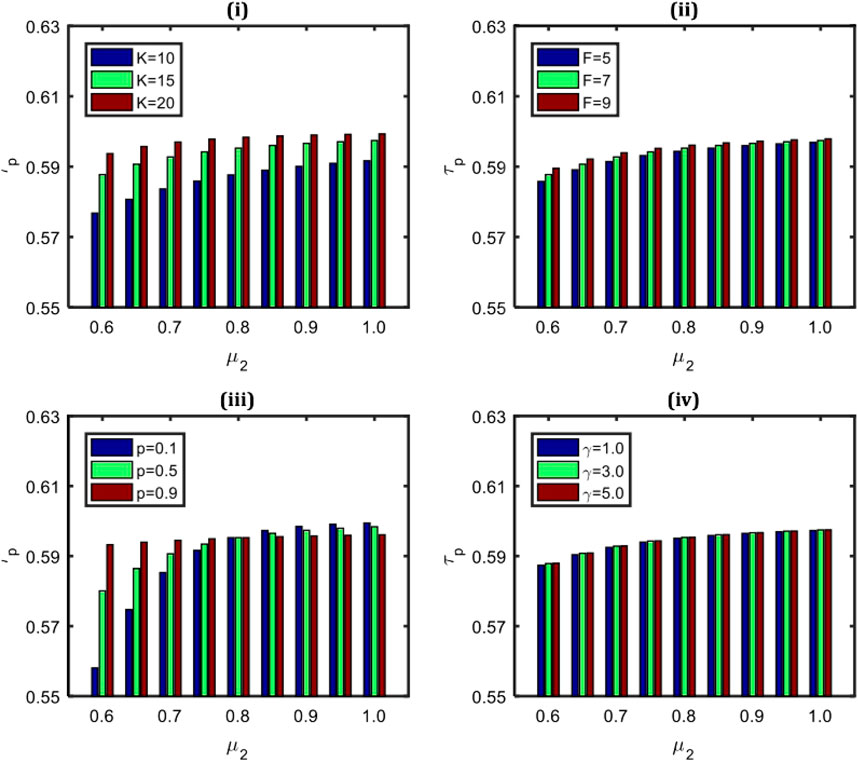
FIGURE 3. System throughput (τP) measured in terms of μ2 for various system parameter values.
Now, some numerical examples are carried out by taking into account the following cost aspects to show that the suggested model and methodology are convenient for the system designers, policymakers, and practitioners in system modeling and decision-making. For analysis purposes, the numerical values of numerous associated cost variables are choosen as follows: Ch = 10; Cb = 50; Cd = 350; Ca = 100; Ck = 20; C1 = 50 and C2 = 50, and for all other default system parameters is taken as used in Figure 1. Figure 4 highlights the consequences of the various values for the system parameters on the anticipated system cost. To examine this effect, numerous values of the combinations (K, λ), (F, λ), (μ1, λ), (p, μ1), (γ, λ), and (γ, μ2) up to a substantial level are presented. The sub-Figure 4i-iii, v demonstrate that the estimated cost of the system keeps rising as λ grows significantly. It is genuine because the system’s associated cost clearly grows significantly in proportion to the higher number of customers. The validation of our formulation can be observed in Figure 4iv, which shows that the lower value of p and higher service rate μ1 minimizes the associated cost (TC) of the system. Similarly, from Figure 4iii, vi, it is clear that anticipated cost of the system become higher with higher service rates μ1 and μ2, respectively. These outcomes demonstrate that an additional service facility might not always be considered into account to enhance system performance.
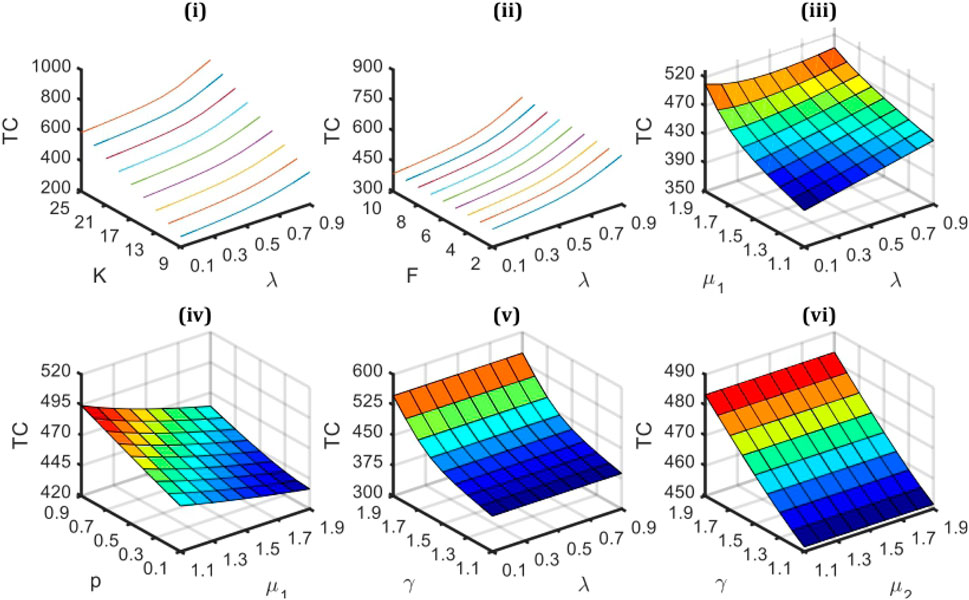
FIGURE 4. The system’s anticipated cost (TC) concerning different combinations of design parameters.
To illustrate the most appropriate strategies and the optimum anticipated cost for the suggested model, three system design parameters F, μ1, and μ2 are recommended. Therefore, we first verify that the anticipated cost (TC) is convex and analogous to the decision variables F, μ1, and μ2. Our intuition indicates that the convex behavior of the desired cost function is guaranteed by the graphic combinations of these parameters’ variable values shown in Figure 5. It should be noticed that F, μ1, and μ2 have optimal values that are nearly identical to 5, 1.0, and 0.8, respectively. Since it is really very difficult task to generate the solution analytically, the nature-inspired optimization technique, CS algorithm, is implemented to determine the optimum system design combinations simultaneously. We fix the range of the decision parameter F as [1 14] and [0.5 3.0] for μ1 and μ2, respectively. Moreover, the combined optimal variations of μ1 and μ2 via the three-dimensional contour plot and surface plot are provided in Figures 6, 7 for a better understanding of research findings. As used in Figure 5, the default system parameter values and associated unit cost elements were taken. The cost function is clearly highly convex for the combined design parameter values μ1 and μ2, which is apparent in Figures 6, 7. So, it implies that engineers and system designers would be benefited more from using queueing modeling while making decisions.Now, some specific generations of the CS algorithm (cf. Figure 8) are specified in the feasible domain for illustration purposes by defining the minimal and higher ranges of the design variables μ1 and μ2 as [0.5 3.0] with F* = 9 as the default value. With the aid of these generations, we present the efficient expected system cost as well as the most effective combinations of decision parameters. As the CS technique is evolutionary in nature, it is straightforward to verify that all search agents in the first generation are distributed randomly throughout the feasible region. Subsequently, they approach closer to the convergence outcomes by investigating unexplored regions, including each subsequent generation. This suggests that the CS approach is efficient for all underlying conceptual experiments. It also demonstrates the capability of the CS algorithm to converge on optimal outcomes within an appropriate time span. From the research findings, as a concluded remark, one can easily observe that the best agent’s coordinates are
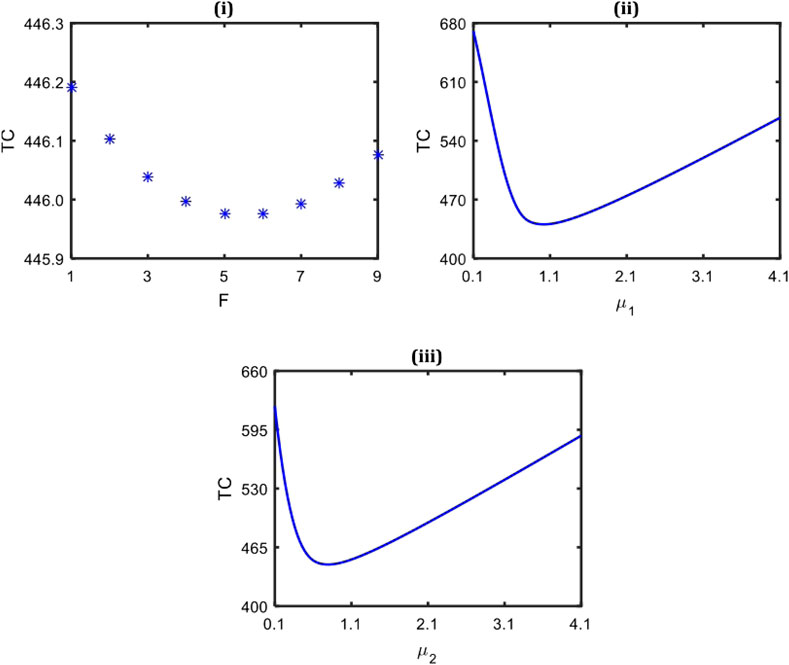
FIGURE 5. The minimum systems’ cost along with the best system design parameters value.
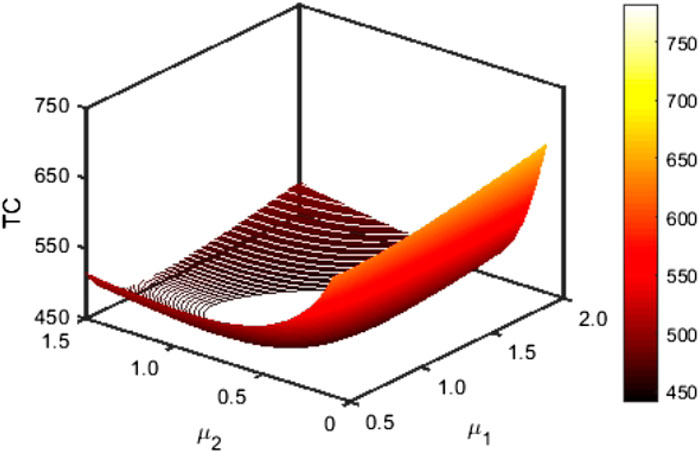
FIGURE 6. Three dimensional contour plot for the optimal combination of (μ1, μ2) wrt optimal cost of the system.
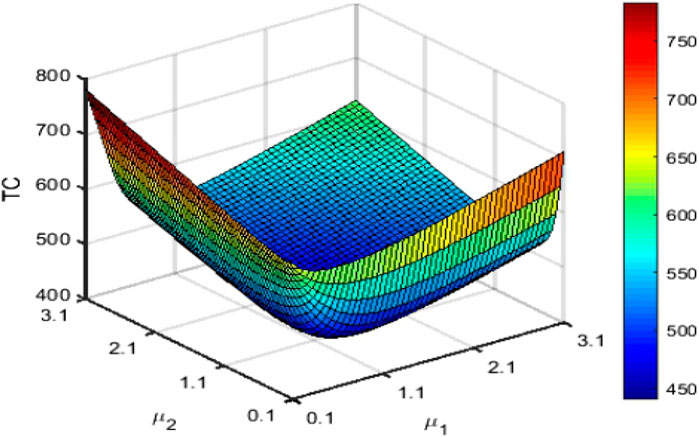
FIGURE 7. Surface plot for the optimal combination of (μ1, μ2) wrt optimal cost of the system.
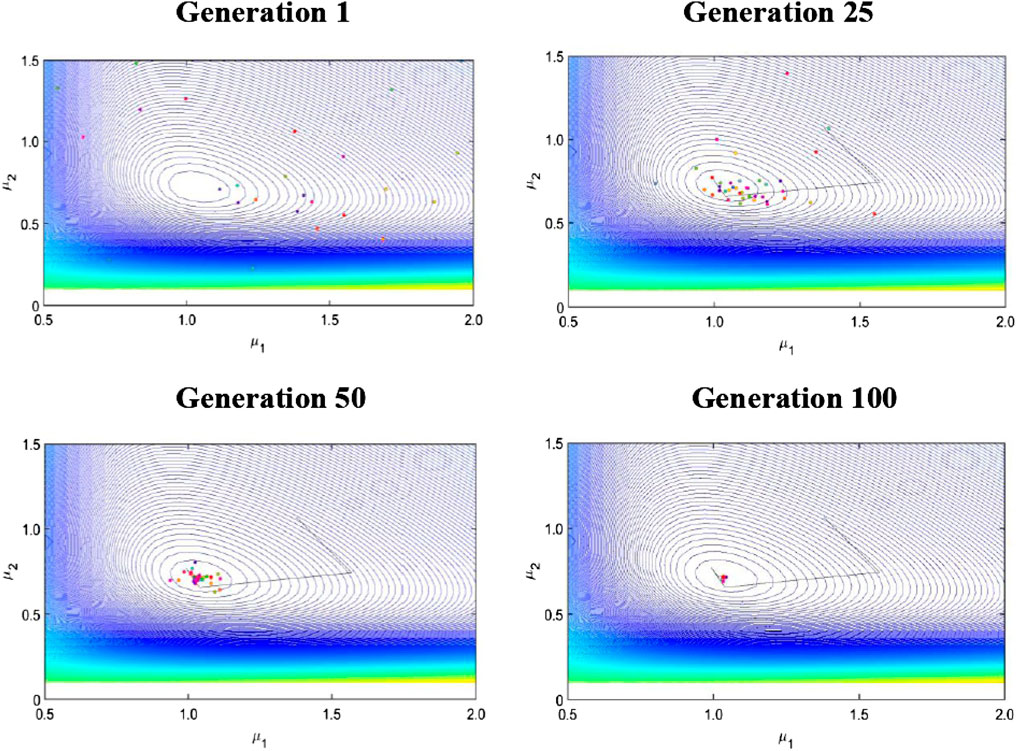
FIGURE 8. Classification of CS optimization technique.
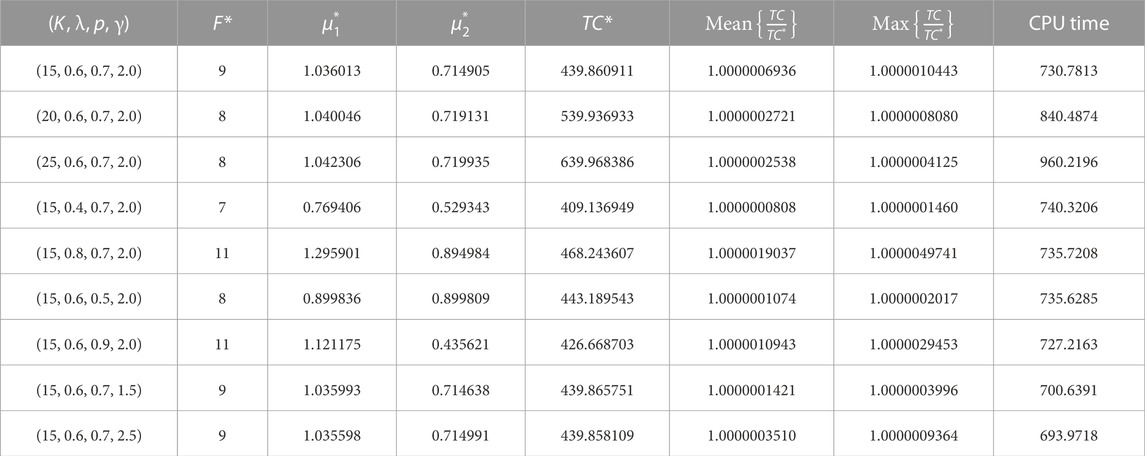
TABLE 1. Optimal choices for
Finally, a comparison between the CS algorithm, the swarm intelligence-based optimization approach, the PSO algorithm, and the traditional optimization techniques, the DS and QN method, is conducted to highlight the validity of the obtained converging results of the CS algorithm. As we know, the optimal outcomes, the statistical parameters, namely, mean ratio and maximum ratio in all independent runs, and computation time (CPU time) are some of the crucial and fundamental aspects to consider when comparing any algorithm’s utility and efficacy. As a result of this fact, some numerical experiments are shown in Tables 1–5. The minimum anticipated cost generated by the PSO, DS, QN, and CS algorithms can be visualized to three to four decimal places. From all of the numerical experiments, it can be observed that the CS methodology’s adequate search quality to reach optimality is significantly superior to the PSO approach. It can also be strongly recommended based on the optimal strategies obtained by the CS algorithm compared to PSO. This demonstrates the robustness and better economic significance of the CS algorithm since the PSO requires numerous computations to update the p-best and g-best outcomes. CS algorithm naturally maintains population diversity due to its random search and cuckoo behavior, which can be beneficial for escaping local optima. While PSO can struggle with maintaining diversity as the particles converge towards a single solution, potentially getting trapped in local optima. The CS algorithm outperforms the semi-classical optimization methodology, QN, and DS methods in all testing scenarios. The QN approach requires a numerical estimation of the gradient or direction of optimality due to the optimization function’s high nonlinearity and high degree of complexity. Hence, the substantial degree of approximations connected to the internal iterations of the QN approach negatively impacts the QN method’s efficiency and searching quality.

TABLE 2. Optimal choices for
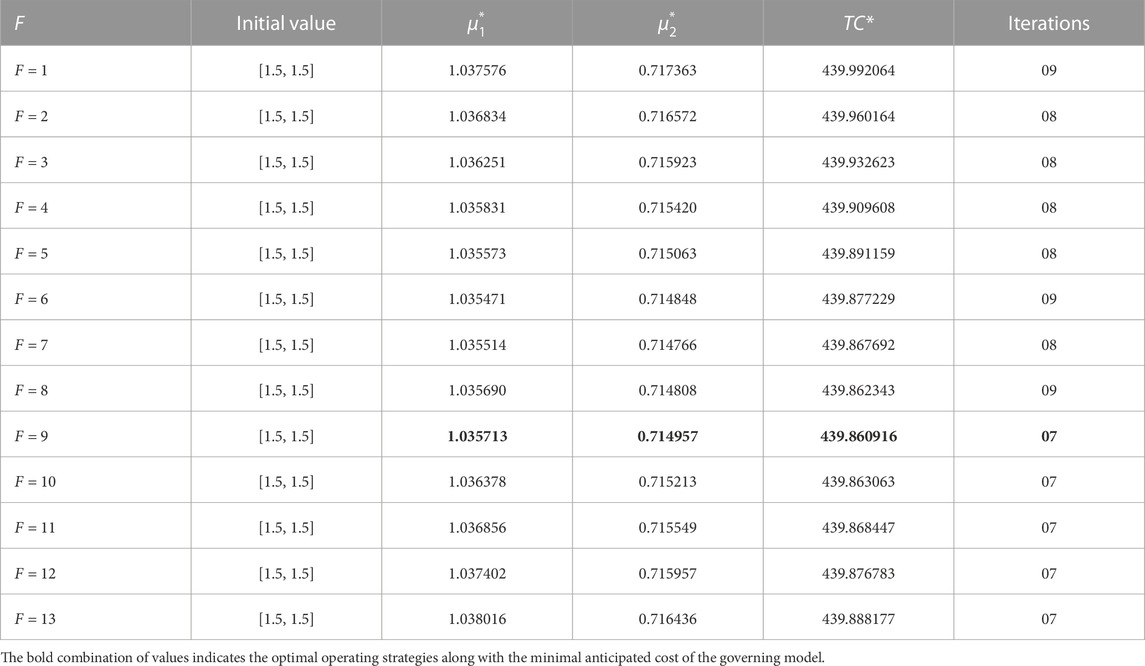
TABLE 3. Ideal variations of
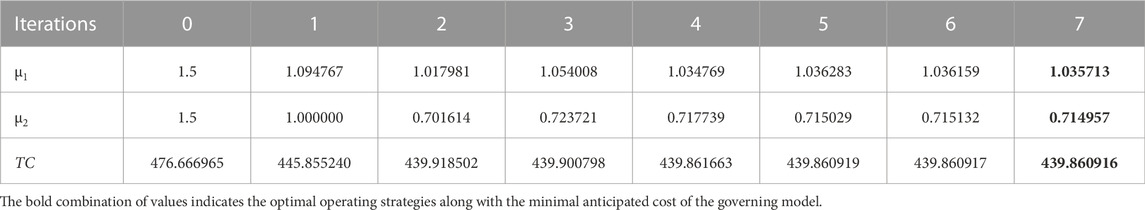
TABLE 4. An illustration of the Direct-Search method’s iterative process using the values K = 15, λ = 0.6, p = 0.7, and γ = 2.0, and initial combination (F, μ1, μ2) = (9, 1.5, 1.5).
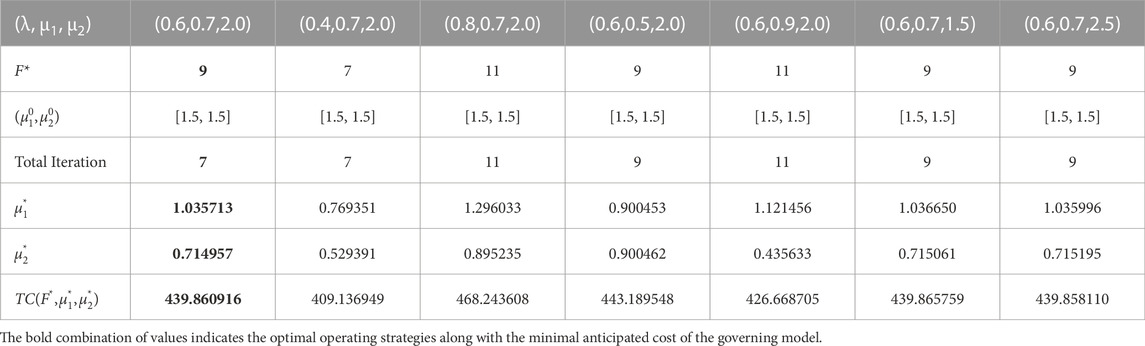
TABLE 5. The best combinations of
As a concluding remark, we can emphasize that improved system efficiency, resource utilization, and customer satisfaction are generally considered to be the foundation of the theoretical implications of the queueing models. For instance, in this section, we have shown that the incremental changes in the arrival rate of customers significantly increase the queue length, and higher service rates reduce average customer waiting times and improve overall system efficiency. Further, several illustrative simulations based on the governing model are provided to validate these implications quantitatively and outcomes from these simulations are then compared with the model’s predictions. Thus, the quantitative results demonstrate a decrease in average waiting times when the service provider’s service rate increases, supporting the theoretical inference of enhanced system performance. This research confirmation supports the theoretical understanding that optimizing certain parameters in the queueing model can effectively enhance system performance and meet the model’s predictions.
7 Managerial insights
The study’s numerical findings in Section 6 can benefit service system managers and decision-makers dealing with complex and non-linear optimization problems. They can optimize the system’s design parameters and minimize the overall anticipated cost of renewable energy systems by implementing the suggested CS algorithm. It may lower anticipated costs, enhance energy demand fluctuations, and improve energy storage management, system reliability, and repair and maintenance policies within renewable energy infrastructures. To avoid maintenance interruptions, system managers may employ these insights in developing preventive service strategies, such as regular maintenance inspections, risk identification and mitigation, and outages.
System managers implementing the suggested approach into practice have to take care a variety of aspects into account. For instance, they must ensure that they have the required data to optimize the system design parameters. Additionally, they should consider the impact of the model parameters on their existing repair and maintenance processes, resources, and costs. System managers and decision-makers should also carefully consider the mathematical validity of the model, particularly when forecasting future service requirements. To make sure that just-in-time operational efficiency is maintained, they should also take economic limitations and the accessibility of quick maintenance services into account.
In a nutshell, researchers, policymakers, and system managers of renewable energy systems can use the study’s mathematical outcomes to optimize demand for energy fluctuations, lower expected costs, and optimize system design parameters. They can ensure efficient service provisioning throughout each stage of the energy service systems and improve the quality of their repair and maintenance services by implementing the suggested recommendations.
8 Conclusion and future perspectives
The proposed model based on renewable energy systems with hyperexponentially distributed service regimes and finite buffer storage has several unique findings and contributions. Firstly, the model considers the impact of admission control policy, which is an essential aspect in any energy sector but is often overlooked in traditional models. Secondly, the model considers a finite buffer storage, a more realistic assumption than infinite buffer in many practical scenarios. Thirdly, the closed-vector form expressions for different renewable system performance measures have been derived using steady-state probability distributions, which can aid in efficiently evaluating the energy system’s performance. Finally, the cost optimization problem is constructed to design the appropriate threshold F*, reasonable service parameters μ1 and μ2, and the minimal anticipated cost associated to the energy system. The current investigation has significant implications for researchers and practitioners seeking to optimize several energy parameters and improve the individual experience.
The economic analysis performed in this study also contributes to its uniqueness. The analysis shows how the established model can support system managers and decision-makers in decreasing the expense of service or maintenance, an extremely desirable component of renewable energy sector. The provision of nature-inspired metaheuristics, such as the CS and PSO techniques, further enhances the practical importance of the model. The validation of the findings using the comparative investigation with the PSO algorithm, QN method, and DS method also adds credibility to the results. Further, the current research introduces novel parametric and optimal analyses for a renewable energy system with an admission control policy and a two-stage hyperexponentially distributed service pattern. Our study illustrates the dynamic behavior of the developed model using several hypotheses based on the queueing-theoretic approach. Specifically, the current research employs the essential assumptions of transition between consecutive transition states to demonstrate the differential equations using the fundamental assumptions of stochastic process. The use of the queueing-theoretic approach enables us to provide a rigorous and analytical framework to analyze the controllable energy system. This framework offers insights into the optimal control policies that can be employed to minimize system costs and improve the individual experience. Our study also provides a detailed analysis of the system’s robust behavior, allowing us to check the impact of distinct design variables on the operational characteristics of the energy system.
Despite its contributions, the proposed model has some limitations that need to be considered. One limitation is the assumption of hyperexponential distribution for service times and startup times. While this assumption may hold in some cases, it may not be applicable in all scenarios. Additionally, the model assumes a limited buffer storage, which may not be accurate in situations where buffer storage is not constrained. Moreover, the model assumes a fixed number of service channels, which may not be realistic in scenarios where the number of active service providers can change over the time.The following potential hypotheses can be introduced to expand the scope of the present investigation.
Extension to other service distributions: Extending the suggested model to other customer service distributions, such as Erlangian, Weibull, and geometric distributions, is one possible direction for future investigation. This will facilitate an evaluation of the performance of the renewable energy systems under multiple service distribution scenarios, offering a more thorough comprehension.
Dynamic server allocation: An additional possibility for future study could involve examining how the suggested model addresses dynamic service distribution. This could result in improved performance, higher efficiency, and reduced expenses associated with of system performance indicators by enabling a more adaptable and effective management of resources in the energy system.
Application to real-world scenarios: The current investigation can further be employed to numerous realistic scenarios such as healthcare systems, computer communication systems, and transportation systems. The viability and applicability of the suggested model in such circumstances may be further examined in future research.
Machine learning-based admission control policies: Using machine-learning-based admission control policies in the proposed model could be another potential research direction. This will allow individuals optimal connectivity and control over energy systems, potentially leading to improved performance and lower expenditure.
Robustness analysis: A more in-depth analysis of the convergence and robustness of the research findings may also be a future research direction. This may involve examining the effects of various types of breakdowns or interruptions on system performance and identifying strategies to mitigate those effects.
Analysis of real-time data: Real-time data analysis via the model having hyper-exponential distribution can facilitate dynamical parameter adjustments, improving forecast accuracy and enabling real-time decision-making.
In Implementation of Modern Technologies: The queueing-based hyper-exponentially service model can find applications in developing domains like cloud computing, edge computing, and the Internet-of-Things (IoT) over time as technology keeps growing. Understanding and improving these modern technologies’ waiting times and service patterns can help with more effective resource management and enhanced customer satisfaction.
Data availability statement
Data sharing is not applicable to this article as no datasets were generated or analyzed during the current study.
Author contributions
SV: Conceptualization, Formal Analysis, Investigation, Methodology, Software, Supervision, Validation, Visualization, Writing–original draft, Writing–review and editing. CS: Investigation, Supervision, Validation, Writing–review and editing. AD: Formal Analysis, Validation, Writing–review and editing. KP: Formal Analysis, Writing–review and editing. MK: Formal Analysis, Writing–review and editing. HK: Formal Analysis, Writing–review and editing. KA: Formal Analysis, Writing–review and editing. MA: Formal Analysis, Writing–review and editing.
Funding
The author(s) declare that no financial support was received for the research, authorship, and/or publication of this article.
Conflict of interest
The authors declare that the research was conducted in the absence of any commercial or financial relationships that could be construed as a potential conflict of interest.
The handling editor HP declared a past Authorship with one of the authors SP.
Publisher’s note
All claims expressed in this article are solely those of the authors and do not necessarily represent those of their affiliated organizations, or those of the publisher, the editors and the reviewers. Any product that may be evaluated in this article, or claim that may be made by its manufacturer, is not guaranteed or endorsed by the publisher.
References
Aghighi, A., Goli, A., Malmir, B., and Tirkolaee, E. B. (2021). The stochastic location-routing-inventory problem of perishable products with reneging and balking. J. Ambient Intell. Humaniz. Comput. 14, 6497–6516. doi:10.1007/s12652-021-03524-y
Baek, J. W., Moon, S. K., and Lee, H. W. (2014). A time-dependent busy period queue length formula for the M/Ek/1 queue. Statistics Probab. Lett. 87, 98–104. doi:10.1016/j.spl.2014.01.004
Baik, S. M., and Ko, Y. M. (2023). Qos-aware energy-efficient workload routing and server speed control policy in data centers: a robust queueing theoretic approach. IISE Trans. 55, 1242–1255. doi:10.1080/24725854.2023.2183531
Balachandran, K. R. (1973). Control policies for a single server system. Manag. Sci. 19 (9), 1013–1018. doi:10.1287/mnsc.19.9.1013
Baskar, S. (2023). Deepnet model empowered cuckoo search algorithm for the effective identification of lung cancer nodules. Front. Med. Technol. 5, 1157919. doi:10.3389/fmedt.2023.1157919
Bulatović, R. R., Đorđević, S. R., and Đorđević, V. S. (2013). Cuckoo search algorithm: a metaheuristic approach to solving the problem of optimum synthesis of a six-bar double dwell linkage. Mech. Mach. Theory 61, 1–13. doi:10.1016/j.mechmachtheory.2012.10.010
Chang, F. M., and Ke, J. C. (2011). Cost analysis of a two-phase queue system with randomized control policy. Procedia-Social Behav. Sci. 25, 137–146. doi:10.1016/j.sbspro.2011.10.535
Chen, W. L. (2018). Reliability and sensitivity analysis of the controllable repair system with warm standbys under the recovery threshold policy. J. Test. Eval. 47 (2), 20170310. doi:10.1520/jte20170310
Dudin, A., Kim, C., Dudina, O., and Dudin, S. (2016). Multi-server queueing system with a generalized phase-type service time distribution as a model of call center with a call-back option. Ann. Operations Res. 239, 401–428. doi:10.1007/s10479-014-1626-2
Dudin, S., and Dudina, O. (2019). Retrial multi-server queuing system with phf service time distribution as a model of a channel with unreliable transmission of information. Appl. Math. Model. 65, 676–695. doi:10.1016/j.apm.2018.09.005
Dwivedi, A., Madaan, J., Chan, F. T., and Dalal, M. (2022). A comparative study of GA and PSO approach for cost optimisation in product recovery systems. Int. J. Prod. Res. 61, 1283–1297. doi:10.1080/00207543.2022.2035008
Efrosinin, D., Krishnamoorthy, A., Vishnevskiy, V., and Kozyrev, D. (2018a). “The effect of a MAP flow on performance measures of controllable queueing system with heterogeneous servers in a random environment,” in 21st international conference on distributed computer and communication networks (DCCN2018), 415–433.
Efrosinin, D., and Sztrik, J. (2018). An algorithmic approach to analysing the reliability of a controllable unreliable queue with two heterogeneous servers. Eur. J. Operational Res. 271 (3), 934–952. doi:10.1016/j.ejor.2018.06.007
Efrosinin, D. V., Farkhadov, M. P., and Stepanova, N. V. (2018b). Study of a controllable queueing system with unreliable heterogeneous servers. Automation Remote Control 79 (2), 265–285. doi:10.1134/s0005117918020066
Flatto, L. (1985). Two parallel queues created by arrivals with two demands II. SIAM J. Appl. Math. 45 (5), 861–878. doi:10.1137/0145052
Flatto, L., and Hahn, S. (1984). Two parallel queues created by arrivals with two demands I. SIAM J. Appl. Math. 44 (5), 1041–1053. doi:10.1137/0144074
Griffiths, J. D., Leonenko, G. M., and Williams, J. E. (2006). The transient solution to M/Ek/1 queue. Operations Res. Lett. 34 (3), 349–354. doi:10.1016/j.orl.2005.05.010
Gupta, S., Joshi, P. K., and Rajeshwari, K. N. (2023). Optimization of M/M/2 queueing model with working vacations. J. Sci. Res. 15 (1), 31–41. doi:10.3329/jsr.v15i1.59348
Gupta, S. M. (1995). Interrelationship between controlling arrival and service in queueing systems. Comput. Operations Res. 22 (10), 1005–1014. doi:10.1016/0305-0548(94)00088-p
Han, H., Liu, Y., Hou, Y., and Qiao, J. (2023a). Multi-modal multi-objective particle swarm optimization with self-adjusting strategy. Inf. Sci. 629, 580–598. doi:10.1016/j.ins.2023.02.019
Han, H., Zhang, L., Yinga, A., and Qiao, J. (2023b). Adaptive multiple selection strategy for multi-objective particle swarm optimization. Inf. Sci. 624, 235–251. doi:10.1016/j.ins.2022.12.077
Heyman, D. P. (1977). The T-policy for the M/G/1 queue. Manag. Sci. 23 (7), 775–778. doi:10.1287/mnsc.23.7.775
Jackson, R. R. P. (1954). Queueing systems with phase-type service. J. Operational Res. Soc. 5 (4), 109–120. doi:10.2307/3007088
Jain, M., and Sanga, S. S. (2020). State dependent queueing models under admission control F-policy: a survey. J. Ambient Intell. Humaniz. Comput. 11 (9), 3873–3891. doi:10.1007/s12652-019-01638-y
Kennedy, J., and Eberhart, R. (1995). “Particle swarm optimization (PSO),” in Proc. IEEE international conference on neural networks (Perth, Australia, 1942–1948.
Khajehzadeh, M., Taha, M. R., and Eslami, M. (2013). A new hybrid firefly algorithm for foundation optimization. Natl. Acad. Sci. Lett. 36 (3), 279–288. doi:10.1007/s40009-013-0129-z
Khayyati, S., and Tan, B. (2022). Supervised-learning-based approximation method for multi-server queueing networks under different service disciplines with correlated interarrival and service times. Int. J. Prod. Res. 60 (17), 5176–5200. doi:10.1080/00207543.2021.1951448
Kocaman, A. S., Abad, C., Troy, T. J., Huh, W. T., and Modi, V. (2016). A stochastic model for a macroscale hybrid renewable energy system. Renew. Sustain. Energy Rev. 54, 688–703. doi:10.1016/j.rser.2015.10.004
Kumar, A., and Jain, M. (2023). Cost optimization of an unreliable server queue with two-stage service process under hybrid vacation policy. Math. Comput. Simul. 204, 259–281. doi:10.1016/j.matcom.2022.08.007
Kumar, P., Jain, M., and Meena, R. K. (2022). Optimal control of fault tolerant machining system with reboot and recovery in fuzzy environment using harmony search algorithm. ISA Trans. 119, 52–64. doi:10.1016/j.isatra.2021.02.027
Latouche, G., and Ramaswami, V. (1999). Introduction to matrix analytic methods in stochastic modeling. SIAM.
Li, B., Li, Y., Liu, X., Liu, X., Zhu, S., and Section, L. K. E. (2023a). Section optimization design of UHPC beam bridges based on improved particle swarm optimization. Front. Mater. 10, 1276118. doi:10.3389/fmats.2023.1276118
Li, D., Wang, L., Guo, W., Zhang, M., Hu, B., and Wu, Q. (2023b). A particle swarm optimizer with dynamic balance of convergence and diversity for large-scale optimization. Appl. Soft Comput. 132, 109852. doi:10.1016/j.asoc.2022.109852
Li, J., Yao, Y., Qin, J., Chen, J., Zhao, Y., Ren, J., et al. (2023c). Research on control strategy of distributed photovoltaic cluster based on improved particle swarm-gray wolf coupling algorithm. Front. Energy Res. 11. doi:10.3389/fenrg.2023.1292899
Liang, Q., and Modiano, E. (2019). “Optimal network control in partially-controllable networks,” in IEEE INFOCOM 2019-IEEE conference on computer communications (IEEE), 397–405.
Liu, T. H., Chang, F. M., Ke, J. C., and Sheu, S. H. (2022). Optimization of retrial queue with unreliable servers subject to imperfect coverage and reboot delay. Qual. Technol. Quantitative Manag. 19 (4), 428–453. doi:10.1080/16843703.2021.2020952
Liu, X., and Fralix, B. (2019). On lattice path counting and the random product representation, with applications to the Er/M/1 queue and the M/Er/1 queue. Methodol. Comput. Appl. Probab. 21, 1119–1149. doi:10.1007/s11009-018-9658-8
Mareli, M., and Twala, B. (2018). An adaptive cuckoo search algorithm for optimisation. Appl. Comput. Inf. 14 (2), 107–115. doi:10.1016/j.aci.2017.09.001
Mitra, S., and Acharyya, S. (2022). Perturbation and repository based diversified cuckoo search in reconstruction of gene regulatory network: a new cuckoo search approach. J. Comput. Sci. 60, 101600. doi:10.1016/j.jocs.2022.101600
Momenitabar, M., Ebrahimi, Z. D., and Mattson, J. (2023). Queueing-based formulation model in a public transit network considering energy storage technology and demand charges. J. Energy Storage 64, 107212. doi:10.1016/j.est.2023.107212
Nagababu, G., Srinivas, B. A., Kachhwaha, S. S., Puppala, H., and Kumar, S. V. A. (2023). Can offshore wind energy help to attain carbon neutrality amid climate change? a GIS-MCDM based analysis to unravel the facts using CORDEX-SA. Renew. Energy 29. 119400. doi:10.1016/j.renene.2023.119400
Neuts, M. F. (1981). Matrix-geometric solutions in stochastic models: an algorithmic approach. Baltimore: The John Hopkins University Press.
Noorollahi, Y., Aligholian, A., and Golshanfard, A. (2020). Stochastic energy modeling with consideration of electrical vehicles and renewable energy resources-a review. J. energy Manag. Technol. 4 (1), 13–26. doi:10.22109/jemt.2019.174242.1162
Pandey, M. K., and Gangeshwer, D. K. (2020)., 979. Springer, 225–231. doi:10.1007/978-981-15-3215-3_21 Analysis of M/Ek/1 queue model in bulk service environmentNumer. Optim. Eng. Sci. Adv. Intelligent Syst. Comput.
Patel, R. P., Nagababu, G., Kachhwaha, S. S., Surisetty, V. V. A. K., and Seemanth, M. (2023). Techno-economic analysis of wave energy resource for India. J. Indian Soc. Remote Sens. 51 (2), 371–381. doi:10.1007/s12524-022-01538-3
Pham, D. T., Ghanbarzadeh, A., Koç, E., Otri, S., Rahim, S., and Zaidi, M. (2006). “The bees algorithm: novel tool for complex optimisation problems,” in Intelligent production machines and systems (Elsevier), 454–459.
Rani, S., Jain, M., and Meena, R. K. (2023). Queueing modeling and optimization of a fault-tolerant system with reboot, recovery, and vacationing server operating under admission control policy. Math. Comput. Simul. 209, 408–425. doi:10.1016/j.matcom.2023.02.015
Safaei, F., Ahmadi, J., and Fouladirad, M. (2022). Optimal N-policy for the maintenance of k-out-of-n systems with dynamic minor repairs considering second-hand component income. Int. J. Prod. Res, 1–18. doi:10.1080/00207543.2022.2120107
Sahu, B., Das, P. K., and Kumar, R. (2023). A modified cuckoo search algorithm implemented with SCA and PSO for multi-robot cooperation and path planning. Cogn. Syst. Res. 79, 24–42. doi:10.1016/j.cogsys.2023.01.005
Samain, S., Doncel, J., Busic, A., and Fourneau, J.-M. (2021). Multiclass energy packet networks with finite capacity energy queues. Perform. Eval. 152, 102228. doi:10.1016/j.peva.2021.102228
Shang, Z., and Wolter, K. (2016). Delay evaluation of openflow network based on queueing model. arXiv preprint arXiv:1608.06491.
Sharma, R. (2014). Mathematical analysis of queue with phase service: an overview. Adv. Operations Res. 2014, 1–19. doi:10.1155/2014/240926
Shehab, M., Khader, A. T., and Al-Betar, M. A. (2017). A survey on applications and variants of the cuckoo search algorithm. Appl. Soft Comput. 61, 1041–1059. doi:10.1016/j.asoc.2017.02.034
Shekhar, C., Jain, M., Raina, A. A., and Iqbal, J. (2017). Optimal (N, F) policy for queue-dependent and time-sharing machining redundant system. Int. J. Qual. Reliab. Manag. 34 (6), 798–816. doi:10.1108/ijqrm-07-2016-0105
Shekhar, C., Varshney, S., and Kumar, A. (2020a). Matrix-geometric solution of multiserver queueing systems with Bernoulli scheduled modified vacation and retention of reneged customers: a meta-heuristic approach. Qual. Technol. Quant. Manag.18 (1), 3966. doi:10.1080/16843703.2020.1755088
Shekhar, C., Varshney, S., and Kumar, A. (2020b). Optimal and sensitivity analysis of vacation queueing system with F-policy and vacation interruption. Arabian J. Sci. Eng. 45 (8), 7091–7107. doi:10.1007/s13369-020-04690-5
Shekhar, C., Varshney, S., and Kumar, A. (2020c). Optimal control of a service system with emergency vacation using bat algorithm. J. Comput. Appl. Math. 364, 112332. doi:10.1016/j.cam.2019.06.048
Shekhar, C., Varshney, S., and Kumar, A. (2021). “Standbys provisioning in machine repair problem with unreliable service and vacation interruption,” in The handbook of reliability, maintenance, and system safety through mathematical modeling (Elsevier), 101–133.
Shi, Y., and Eberhart, R. (1998). “A modified particle swarm optimizer,” in 1998 IEEE international conference on evolutionary computation proceedings. IEEE world congress on computational intelligence (cat. No. 98TH8360) (IEEE), 69–73.
Stidham, S., and Weber, R. (1993). A survey of Markov decision models for control of networks of queues. Queueing Syst. 13 (1-3), 291–314. doi:10.1007/bf01158935
Subbaiah, C. V., and Kannayaram, G. (2021). Heuristic ant colony and reliable fuzzy QoS routing for mobile ad hoc network. J. Ambient Intell. Humaniz. Comput., 1–12. doi:10.1007/s12652-021-03140-w
Talari, S., Shafie-Khah, M., Osório, G. J., Aghaei, J., and Catalão, J. P. (2018). Stochastic modelling of renewable energy sources from operators’ point-of-view: a survey. Renew. Sustain. Energy Rev. 81, 1953–1965. doi:10.1016/j.rser.2017.06.006
Tarasov, V. (2022). Spectral decomposition for a QS based delay model with Erlang and hyperexponential distributions. Phys. Wave Process. Radio Syst. 25 (3), 24–28. doi:10.18469/1810-3189.2022.25.3.24-28
Tarasov, V., and Bakhareva, N. (2018). “Research of non-markovian queuing networks,” in 2018 international scientific-practical conference problems of infocommunications. Science and technology (PIC S&T) (IEEE), 824–828.
Wang, K. H., Chang, K. W., and Sivazlian, B. D. (1999). Optimal control of a removable and non-reliable server in an infinite and a finite M/H2/1 queueing system. Appl. Math. Model. 23 (8), 651–666. doi:10.1016/s0307-904x(99)00002-5
Wang, K. H., Kao, H. T., and Chen, G. (2004). Optimal management of a removable and non-reliable server in an infinite and a finite M/Hk/1 queueing system. Qual. Technol. Quantitative Manag. 1 (2), 325–339. doi:10.1080/16843703.2004.11673079
Wu, C. H., and Yang, D. Y. (2021). Control charts for the expected system size of Markovian queues under F-policy. Qual. Technol. Quantitative Manag. 18 (5), 576–596. doi:10.1080/16843703.2021.1927294
Wu, C. H., Yang, D. Y., and Yong, C. R. (2023). Performance evaluation and bi-objective optimization for F-policy queue with alternating service rates. J. Industrial Manag. Optim. 19 (5), 3819–3839. doi:10.3934/jimo.2022111
Yadin, M., and Naor, P. (1963). Queueing systems with a removable service station. J. Operational Res. Soc. 14 (4), 393–405. doi:10.1057/jors.1963.63
Yang, D. Y. (2022). Computational analysis and optimization of randomized control of N-policy for an M/G/1/K queue with starting failures. Commun. Statistics-Theory Methods 51 (8), 2461–2476. doi:10.1080/03610926.2020.1776874
Yang, D. Y., Chang, P. K., and Cho, Y. C. (2021). Optimal control of arrivals in a G/G/c/K queue with general startup times via simulation. Int. J. Manag. Sci. Eng. Manag. 16 (1), 27–33. doi:10.1080/17509653.2020.1826001
Yang, D. Y., and Wang, K. H. (2013). Interrelationship between randomized F-policy and randomized N-policy queues. J. Industrial Prod. Eng. 30 (1), 30–43. doi:10.1080/10170669.2012.761286
Yang, D. Y., Wang, K. H., and Liou, C. H. (2011). “Randomized controlling arrivals for a finite queue with startup,” in 2011 fourth international joint conference on computational sciences and optimization (IEEE), 122–126.
Yang, D. Y., Wang, K. H., and Wu, C. H. (2010). Optimization and sensitivity analysis of controlling arrivals in the queueing system with single working vacation. J. Comput. Appl. Math. 234 (2), 545–556. doi:10.1016/j.cam.2009.12.046
Yang, X. S. (2009). “Firefly algorithms for multimodal optimization,” in International symposium on stochastic algorithms (Springer), 169–178.
Yang, X. S., and Deb, S. (2009). “Cuckoo search via lévy flights,” in 2009 world congress on nature and biologically inspired computing (NaBIC) (IEEE), 210–214.
Yeh, C., Lee, Y. T., Chang, C. J., and Chang, F. M. (2017). Analysis of a two-phase queue system with < p, F > -policy. Qual. Technol. Quantitative Manag. 14 (2), 178–194. doi:10.1080/16843703.2016.1208489
Yen, T. C., Wang, K. H., and Wu, C. H. (2020). Reliability-based measure of a retrial machine repair problem with working breakdowns under the F-policy. Comput. Industrial Eng. 150, 106885. doi:10.1016/j.cie.2020.106885
Yu, M., Tang, Y., Fu, Y., and Pan, L. (2011). An M/Ek/1 queueing system with no damage service interruptions. Math. Comput. Model. 54 (5-6), 1262–1272. doi:10.1016/j.mcm.2011.03.037
Yue, W., Takagi, H., and Takahashi, Y. (2009). Advances in queueing theory and network applications. Springer.
Zhang, Q., Xu, X., and Mi, S. (2016). A generalized p-value approach to inference on the performance measures of an M/Ek/1 queueing system. Commun. Statistics-Theory Methods 45 (8), 2256–2267. doi:10.1080/03610926.2013.879181
Zhang, T., Zhang, Y. J., Zheng, Q. P., and Pardalos, P. M. (2011). A hybrid particle swarm optimization and tabu search algorithm for order planning problems of steel factories based on the make-to-stock and make-to-order management architecture. J. Industrial Manag. Optim. 7 (1), 31–51. doi:10.3934/jimo.2011.7.31
Keywords: renewable energy systems, admission control policy, hyperexponential distribution, cost optimization, cuckoo search algorithm, particle swarm optimization, Quasi-Newton method
Citation: Varshney S, Shekhar C, Dhanunjaya Reddy AV, Pritam KS, Kantipudi MVVP, Kotb H, AboRas K and Alqarni M (2023) Optimal management strategies of renewable energy systems with hyperexponential service provisioning: an economic investigation. Front. Energy Res. 11:1329899. doi: 10.3389/fenrg.2023.1329899
Received: 30 October 2023; Accepted: 21 November 2023;
Published: 11 December 2023.
Edited by:
Harish Puppala, SRM University, IndiaReviewed by:
Jyotiranjan Nayak, ICFAI Foundation for Higher Education, IndiaVivek Tiwari, Indian Institute of Technology Kanpur, India
Copyright © 2023 Varshney, Shekhar, Dhanunjaya Reddy, Pritam, Kantipudi, Kotb, AboRas and Alqarni. This is an open-access article distributed under the terms of the Creative Commons Attribution License (CC BY). The use, distribution or reproduction in other forums is permitted, provided the original author(s) and the copyright owner(s) are credited and that the original publication in this journal is cited, in accordance with accepted academic practice. No use, distribution or reproduction is permitted which does not comply with these terms.
*Correspondence: Shreekant Varshney, c2t2YXJzaG5leTkxQGdtYWlsLmNvbQ==