 Fuxing Yao
 Shihong Miao
- State Key Laboratory of Advanced Electromagnetic Technology, Hubei Electric Power Security and High Efficiency Key Laboratory, School of Electrical and Electronic Engineering, Huazhong University of Science and Technology, Wuhan, China
With the increasing severity of global warming and the rapid evolution of cyber-attack techniques, the enhancement of distribution network (DN) resilience that can effectively cope with natural disasters and man-made attacks has received extensive attention. Hence, in the context of a high impact low probability (HILP) event where attackers launch malicious attacks after a natural disaster occurs, a multi-stage DN operation strategy for resilience enhancement is proposed considering multi-type resources, such as gas turbines, stationary energy storage systems, mobile energy storage systems (MESSs), repair crews (RCs) and network reconfiguration. Firstly, the operation process of DN is divided into five stages based on the time lag between the natural disaster and the man-made attacks: the normal operation stage, the disaster disruption stage, the post-disaster degradation stage, the man-made attack stage and the defense and recovery stage. Secondly, under the background of a coupled power-transportation system, the optimal scheduling model for each stage of DN is established considering the effects of dynamic changes in traffic flow on the movement process of MESSs and RCs. Finally, the model is converted into a 5-layer mixed integer linear programming (MILP) problem that can be solved by sophisticated optimization software according to the time series relationship, and a case study is carried out with a modified IEEE 33-node system and the corresponding transportation network. The results demonstrate that under extreme scenarios, the proposed model can guarantee the load-side power supply as much as possible through flexible cooperation between multi-type resources, effectively enhancing the resilience of the DN.
1 Introduction
In recent years, the reliability of the power supply has become an indispensable requirement for the development of DN (Cheng et al., 2021). However, DNs are vulnerable to attacks since most of them are directly exposed in the field and rely on widely configured communication devices for information interaction (Zhang et al., 2020). For example, in 2008, due to the ice disaster, a large area of the Hunan power grid in China was damaged, with economic losses of 15 billion dollars (Li et al., 2022a). In December 2015, malicious cyber-attacks caused severe damage to the Ukrainian power grid, more than half of the region lost power for 3–6 h and nearly 73 MWh of electricity was affected (Lai et al., 2018). It is therefore of great importance to improve the ability of DNs to cope with HILP events such as natural disasters and cyber-attacks. Given this, the concept of power system resilience, which refers to the ability of the grid to adapt to changing conditions, make defensive measures to reduce losses and return to normal operation as soon as possible when subjected to a HILP event (Presidential Policy Directive 21, 2013; Gao et al., 2015), has emerged and is gradually becoming the focus of academic research both home and abroad. Over the last few years, global warming has become increasingly serious, natural disasters such as typhoons occur from time to time. On the other hand, the continuous development of the Internet has made malicious man-made attacks more difficult to defend against. All of these pose a great threat to the safe operation of DNs, calling for an urgent need to research DN resilience enhancement.
Nowadays, many effective measures have been proposed, which can help DNs prepare for, adapt to, and gradually recover from HILP events (Zeng et al., 2022). As mentioned in many papers, distributed generators and stationary energy storage systems (SESSs) can effectively enhance the resilience of DNs (Nazemi et al., 2020; Nourollahi et al., 2021). This is because they can form islands and ensure power supply to critical loads when upstream grid power is unreachable (Wang et al., 2015; Ding et al., 2017). Similar to SESSs, MESSs can also be used as emergency backup power sources. Moreover, MESSs are spatially flexible and can transfer energy between multiple buses at the right time, dynamically forming islands (Zhang et al., 2021). Since they need to move on the road, the travel time and distance limit between buses as well as the impact of traffic flow must be considered. As a traditional and important method, network reconfiguration (NR) has also been widely mentioned. It refers to changing the topology of the DN after an outage to realize the transfer of power to the load, thus whittling the impact of fault (Ababei and Kavasseri, 2011). Meanwhile, after a HILP event, RCs should also be dispatched to repair the damaged equipment and resume power supply as soon as possible (Shi et al., 2022). Like MESSs, RCs need to move on the transportation network, so the movement time constraints, restoration time constraints, and the risk of congestion should be considered (Arif et al., 2020). Each of these flexible resources and tools respectively plays an important role and generally works together. In (Shi et al., 2021a), a DN disaster recovery strategy is proposed considering distributed gas turbines, NR, and demand response resources, which can ensure a high percentage of load at service. In (Ashrafi et al., 2021), a dual-objective optimization model is established by combining the optimal dispatch of pre-disaster NR and post-disaster distributed power sources, SESSs, and demand response. In (Javadi et al., 2022), a resilience enhancement model considering mobile generators, MESSs, and NR is developed, reducing 75.85% and 20.12% of load shedding in energy hubs and networks.
However, most of the above studies on DN resilience enhancement consider several of the resources such as distributed generators, SESSs, MESSs, RCs, and NR, but less involve their mutual influence analysis, especially the interplay between MESSs, RCs, and NR. In addition, some of the papers use stochastic optimization to generate disaster scenarios, which simplifies the computational process but cannot cover the worst damage case. Some papers also adopt the idea of robust optimization, but only single damage scenario is considered. Although they can respond to natural disasters such as typhoons, they cannot yet give an effective response strategy if further damage occurs during the post-disaster recovery process, malicious man-made attacks in particular. In view of this, a DN multi-stage optimal operation strategy is proposed considering multi-type resources, in the context of a HILP event where attackers take the opportunity to launch cyber-attacks after a typhoon disaster. The main work of this paper is as follows:
1) Considering the superimposed effects of the typhoon disaster and cyber-attacks, the operation process of the DN is divided into five stages according to the time sequence relationship: the normal operation stage, the disaster disruption stage, the post-disaster degradation stage, the man-made attack stage, and the defense and recovery stage, which are analyzed to form a 5-layer MILP model so that DSO can switch comfortably and respond effectively when extreme scenarios occur.
2) In the context of a coupled power-transportation system, a DN recovery strategy that takes into account the effects of dynamic changes in traffic flow on the movement process of MESSs and the restoration process of RCs is developed, considering gas turbines, SESSs, MESSs, RCs, and NR, which can effectively reduce the load shedding and improve the economy of DN as much as possible.
3) Combining the damage probability of natural disasters and the time limit of malicious man-made attacks, the budgets of typhoons and cyber-attacks are set. In addition, considering the uncertainty of typhoon occurrence time, the randomness of line damage, and the arbitrariness of cyber-attack targets, the idea of robust optimization is adopted to find the worst scenario and optimize the solution to improve the resilience of DN.
The rest is organized as follows: In Section 2, basic assumptions and the framework of the model are elaborated. In Sections 3, 4, the proposed model mathematical formulation and its solution method are introduced. In Section 5, case studies are performed and the results are discussed. Finally, a summary of the whole paper is presented in Section 6.
2 Framework
2.1 Basic assumptions
To simplify the modeling process, this paper makes the following assumptions combined with the reality:
1) Loads are divided into critical ones and ordinary ones. When the DN is unable to meet all of the load demand, ordinary and critical loads will be removed successively according to priority, accompanied by different penalty costs (Shi et al., 2021a).
2) Only the typhoon damage caused to distribution lines is considered. Typhoons may blow off lines, topple poles, or damage insulators, but they are ultimately reflected as interruptions in the power supply, so they can be equated as damage to distribution lines (Lai et al., 2018). Considering that the gas turbines and energy storage devices are located inside the plant and are well protected, the impact of the disaster on them is ignored.
3) Typhoons can attack multiple lines at the same time. In addition, although the precision of weather forecasting is improving year by year, it is still not enough to achieve accurate disaster prediction, and the uncertainty of natural disaster occurrence time needs to be considered. For this reason, this paper sets the corresponding “uncertainty interval” based on the forecast results (Amirioun et al., 2019).
4) The damage to DN is done instantaneously. This paper focuses on the optimal operation strategy of DN under the sequential impact of natural disasters and man-made attacks, hence the specific damage process can be simplified. On the other hand, considering the rapid movement of typhoons as well as the suddenness of man-made attacks, it is approximated that the destruction process can be completed within one dispatch period.
5) With a limited attack budget, malicious attackers always tend to use a “wait-and-see” approach to launch cyber-attacks to make MESSs denial of service (DoS). That is, a fake wireless network is deployed in advance near the selected MESSs candidate buses, and once a MESS moves into the controllable range, the attack is launched quickly, which is analyzed and explained in Section 3.4.
6) The time required to repair distribution lines is fixed (Lai et al., 2018). And once the DSO detects that a MESS is under cyber-attacks, it will immediately send professional staff to fix it. However, considering the complexity of the defense process of cyber-attacks, it is assumed that the attacked MESSs do not resume normal operation until all the damaged distribution lines have been repaired.
2.2 Model architecture
Based on the above assumptions, a DN multi-stage optimal operation model is established, and the framework is shown in Figure 1. During the normal operation stage, DSO optimizes the output of gas turbines, SESSs, and MESSs to minimize the operating cost. In this stage, the gas turbines are shut down since their generation cost is higher than the electricity purchase cost, and DN relies on the upstream grid to supply the load, while SESSs and MESSs arbitrage according to the change of local marginal price. During the disaster disruption stage, natural disasters such as typhoons hit, causing damage to multiple distribution lines and a shortage of power supply to the DN. Next comes the post-disaster degradation stage, when the DSO should improve the resilience of DN, optimize the scheduling of multi-type resources, and realize economic operation as much as possible. Since resilience is visualized as the ratio of the supplied load to the overall demand (Zeng et al., 2022), DSO should make full use of resources such as gas turbines, SESSs, MESSs, and NR to reduce the amount of load shedding; in the meantime, the location of damaged lines should also be identified and RCs should be dispatched. During the man-made attack stage, malicious attackers develop and implement the attack strategy with the most convenient method and the most severe consequences based on the predicted scheduling plan of the DSO. After man-made attacks, the DN will switch into the defense and recovery stage, when the DSO needs to determine the available resources and redefine the scheduling plan to improve resilience and economy, and the attacked equipment should also be located and repaired. When the damaged distribution lines and equipment are repaired, DN will switch back to the normal operation stage.
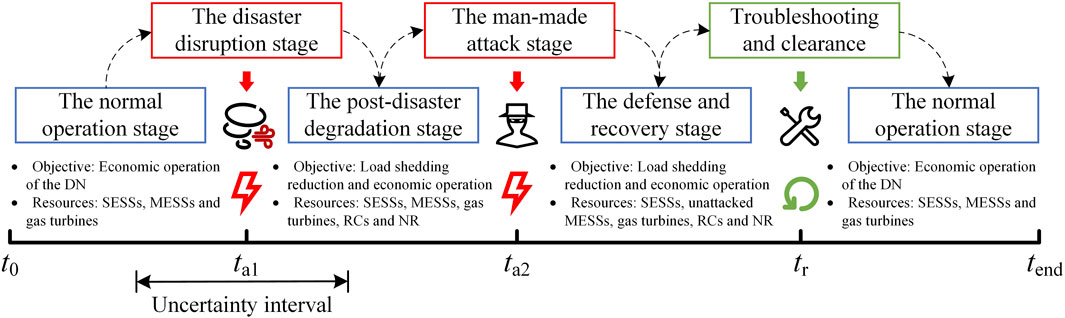
FIGURE 1. Framework of the proposed model.
3 Multi-stage optimization model of DN
3.1 The normal operation stage
The DN is in the normal operation stage when it has not been attacked or all the damaged equipment has been repaired. So the DSO should schedule to minimize the operating cost, whose mathematical model is formulated as follows:
Subject to (2)–(17).
where
As shown in (1), the objective function of the DN during the normal operation stage includes electricity purchase cost, gas turbine generation cost, MESS operating cost and transportation cost, SESS operating cost, and network losses. (2) enforces the DN not to inject power into the upstream grid. (3) denotes the power balance equations of the first bus and the remaining buses. (4) imposes limits on the active and reactive power of the lines that are calculated in (5). (6) implies the bus voltage limits, while the bounds on power outputs and ramping limits of gas turbines are shown in (7). (8)–(10) represent the operation constraint sets of MESSs and SESSs. (11)–(14) are MESS-specific restrictions, where (11) indicates that the connection status and mobile status of MESSs are mutually exclusive, and a MESS can only access at most one candidate bus per scheduling period. (12) shows that only in the connection status can MESSs be charged or discharged. (13) enforces each candidate bus to be accessed by at most one MESS per scheduling period. (14) states that when MESS m is connected to bus n at period t, it needs to travel at least
3.2 The disaster disruption stage
Among all the natural disasters, typhoons occur more frequently. Many studies on DN resilience enhancement use typhoon events as the application scenario (Shi et al., 2022), and this paper also uses it as the background for modeling the disaster disruption stage. For DNs, typhoons may cause wire breakage, pole toppling, and equipment damage, but in general, gas turbines and energy storage devices (including MESSs located in the charging/discharging stations) are mostly inside the plants, which have more robust defense mechanisms and are less likely to be damaged. In contrast, distribution lines and poles are exposed in the field, with higher vulnerability and poorer disaster prevention capabilities, and are more likely to be victims of typhoons, causing interruptions in power supply. Therefore, to simplify the modeling process, it is assumed in this paper that typhoons will only cause damage to distribution lines (Cong et al., 2018).
Typhoons are highly uncertain events that are difficult to predict (Liu et al., 2019), and the occurrence time given by weather forecasts is only a range rather than a precise point, so the meteorological conditions and damage status of DNs under each period are often variable. To ensure that DNs have enough resilience to cope with the worst scenario, this paper uses the idea of robust optimization to model the disaster disruption stage (Zhang et al., 2021), as shown below:
Subject to (19).
where
(19) indicates that the number of distribution lines damaged by the typhoon cannot exceed
3.3 The post-disaster degradation stage
After the typhoon disaster, the power transmission of multiple distribution lines is interrupted and the entire DN is degraded. At this time, DSO should quickly develop corresponding restoration strategies considering the disaster situation, including the dispatch of gas turbines, SESSs, MESSs, RCs, and NR, as shown below:
Subject to (4)–(9), (11)–(17), (21)–(35).
where
The objective function of DN in the post-disaster degradation stage is shown in (20), which needs to account for the cost of load shedding and the interconnection line operation. In this paper, we assume that RCs are composed of the DN’s staff, so their work cost is not included. In addition, to minimize the amount of load shedding, the penalty coefficient is set relatively high (Lai et al., 2018) and is variable according to the priority of the load. Considering that typhoons may cause damage to the upstream grid and multiple DNs will increase their electricity purchases at the same time, (21) is used instead of (2) to relieve the pressure of the upstream grid. (22) is the new power balance equation after considering load shedding. (23) can effectively ensure that the power factor of the grid will not change. (24)–(26) are the topological constraints of DN, where (24) indicates that if a general line is in normal operation, it can only perform power transmission in one direction, while the transmission lines under typhoon attack have to be taken out of operation. (25) states that only after the interconnection lines are put into operation can power transfer take place. (26) indicates that two and more power sources are not allowed to supply loads on the same bus simultaneously to ensure the radial topology of the DN. (27) is the power calculation method for interconnection lines. (28)–(35) are the exclusive limits of RCs. Here, the maintenance process of distribution lines is partially simplified, assuming that RCs start to work from the buses till the midpoints of the lines, during which problems will be dealt with as soon as they are found. Hence, if both ends of a distribution line are visited by RCs, the line is maintained and can be restored to normal. According to these, (28) indicates that only the ends linked by lines that have suffered from typhoon attacks constitute the buses to be maintained, (29) defines the corresponding state variables. (30) indicates that if the state variables at both ends of an attacked line are 0 (that is, both are maintained by RCs), the line will resume normal operation. Similar to MESSs, (31) indicates that the maintenance and mobile status of RCs are mutually exclusive, and an RC can only handle one pending maintenance bus at the same time. (32) states that RCs are not allowed to perform repetitive work. (33) indicates that once RC r starts working around the bus n at period t, it must continue working until all the problems have been solved. Similar to (14), (34) indicates that if RC r finishes the maintenance of bus n at period t, it needs to travel at least
3.4 The man-made attack stage
In this paper, we consider that under the premise of a typhoon disaster, malicious attackers conduct man-made attacks and result in further degradation of the DN. Since the occurrence time of the typhoon is somewhat uncertain, it is very hard for attackers to prepare in advance. Meanwhile, in the aftermath of the typhoon disaster, the attackers do not have sufficient time to prepare either in the short period before the defense and recovery measures are developed, so it has a limited attack budget (Huang et al., 2021). With such a tight budget, the attackers must quickly identify the most vulnerable point of the DN and generate an attack strategy (Yan et al., 2019). At the same time, the DSO’s defensive strategies against damage caused by the typhoon should also be considered, such as the dispatch of MESSs, to identify the most appropriate attack that will cause maximum damage to the DN. Compared to the folly of damaging distribution lines, gas turbines, or energy storage devices physically, cyber-attacks are more popular with attackers because they can be operated remotely, are difficult to be found and defended, and inexpensive. So we assume that malicious attackers tend to use cyber-attacks to degrade the DN.
With the help of wide-configured communication devices, modern DNs are much more efficient and competitive to meet growing global energy challenges (Reda et al., 2022). However, this also makes them somewhat vulnerable in the cyber-physical space (Chen et al., 2022). As we know, for stationary sites such as gas turbines and SESSs, the dispatch center is connected to them via wired networks. For mobile devices such as MESSs, they need to contact DSO through wireless communication technologies (Sharma et al., 2017). Compared with wired networks composed of optical fibers or coaxial cables, the transmission medium of wireless communication technologies is completely open and not physically protected, making them more vulnerable to cyber-attacks and more difficult to defend against. So the wireless communication networks adopted by MESSs are weaknesses of the DN. On the other hand, as flexible resources, MESSs can efficiently form microgrids under extreme conditions to ensure the power supply of critical loads, which makes them pivotal to the DN and often favored targets for man-made attacks. Therefore, we assume that under the limited attack budget, malicious attackers tend to use cyber-attacks to cause MESSs DoS.
Unlike SESSs, MESSs can travel flexibly on the transportation network, which poses some difficulties to cyber-attacks. A MESS may be on the way from one bus to another, but the attackers have limited scope to launch attacks by using the configuration of fake base stations or other methods (Bitsikas and Pöpper, 2021). However, compared with the number of buses in the whole DN, the number of MESS candidate buses is greatly reduced, since although it is an ideal goal to realize plug-and-play of MESSs, the DN does not have enough budget so far. That is to say, the candidate buses of MESS are limited. No matter how MESSs move on the transportation network, they will eventually interact with DN at the candidate buses, which provides certain convenience for attackers. So this paper further assumes that the attackers prefer to launch cyber-attacks by “waiting for the targets to come”, e.g., configure fake base stations near the candidate buses and deploy fake wireless networks in advance, so that once a MESS enters the controllable range, they can quickly launch attacks to make it DoS, as shown in Figure 2.

FIGURE 2. Diagram of the whole process of cyber-attacks and defense.
Similar to the disaster disruption stage, the mathematical model of the man-made attack stage is as follows.
Subject to (37).
where
3.5 The defense and recovery stage
The DSO keeps in touch with MESSs and their candidate buses in real time during the normal operation stage. They rely on the communication network to keep information synchronized with each other so that the DSO can combine the data available to determine whether the operating status of MESSs is as expected. Once MESSs suffer from malicious man-made attacks, the wireless communication network between them and the DSO will be disturbed or even destroyed, so they cannot feedback on their locations and connection status. What’s more, to improve the camouflage, the attackers may feedback false information to the DSO. However, this cannot stump the DSO. Combined with the information reported by the candidate buses, the DSO can feel that some MESSs have lost contact and quickly switches into the defense and recovery stage, during which it redefines the scheduling plan in conjunction with the currently available resources. At the same time, it is also necessary to identify the “controlled candidate buses” according to the historical data of the abnormal MESSs, to prepare for subsequent repair. And the remaining MESSs should not be allowed to travel to the “controlled candidate buses” to protect them from being attacked, as shown in Figure 2. Due to the long repair time required for cyber-attacks, it is assumed that the impact of the malicious man-made attacks is cleared and the DN is switched back to the normal operation stage till all lines are restored (that is, time
The scheduling model for the defense and recovery stage is essentially similar to that of the post-disaster degradation stage, except that the MESSs who suffer from man-made attacks are out of operation, and the remaining MESSs are no longer allowed to travel to the “controlled candidate buses”, as shown below. Where (39) in place of (11), shows that if a MESS suffers from attacks, it will exit operation. And (40) implies that if MESS m is connected to bus n at period t and is under attack, the DSO will no longer allow the remaining MESSs to travel to bus n for charging or discharging.
Subject to (4)–(9), (12)–(17), (21)–(35), (39), (40).
4 Methodology
The multi-stage optimization model of DN is ultimately a min-max-min-max-min problem mathematically, with a complex model structure and a large number of binary variables, so it is nonlinear and cannot be transformed by duality theory, and thus cannot be solved with the help of column-and-constraint generation or Benders decomposition algorithm. Fortunately, there is a temporal sequential relationship between the multi-stage model, which means that the variables in the previous stage will be used as initial conditions for the next stage in the form of constants, so it can be solved independently in chronological order. Based on this, each stage is mathematically formulated as a MILP problem, which can be solved using off-the-shelf commercial optimization software (Zeng et al., 2022), so the Gurobi solver is used in MATLAB/YALMIP interface. It should be mentioned that we need to find the worst scenario, which is a combination of natural disasters and man-made attacks, to ensure the robustness of the model. That is why we use the Particle Swarm optimization algorithm or go through all failure scenarios to find the worst one. This method seems clumsy but is also very effective when there is no better choice. The model solving process is shown as Supplementary Figure S1.
5 Case studies
5.1 Case parameters
In this paper, the modified IEEE 33-node system is used for case studies, as shown in Figure 3. The system contains 32 general lines, 5 interconnection lines, 6 gas turbines, 2 SESSs, and 4 MESSs. The parameters of gas turbines and SESSs are shown in Tables 1, 2. All MESSs have the same parameters, with active and reactive power output limits of 150 kW and 120 kVar, and a rated capacity of 500 kWh. The upper limits of active and reactive power of the lines are set to 5,000 and 2,000 kVar. The initial values as well as the upper and lower limits of SOC for all energy storage devices are 0.5, 0.9, and 0.1, while the charging and discharging efficiency is taken as 0.9. Considering that the voltage at each bus of the system may fluctuate, the maximum and minimum values of voltage are taken to be 1.1 p.u. and 0.9 p.u. (Zhang et al., 2021). The duration of the scheduling period is set to 30 min and the time share tariff is shown in Table 3 (Li et al., 2022).
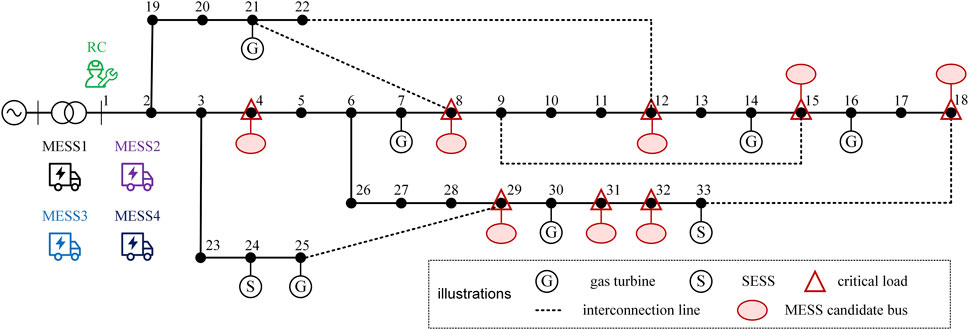
FIGURE 3. Topology of the modified IEEE 33-node system.
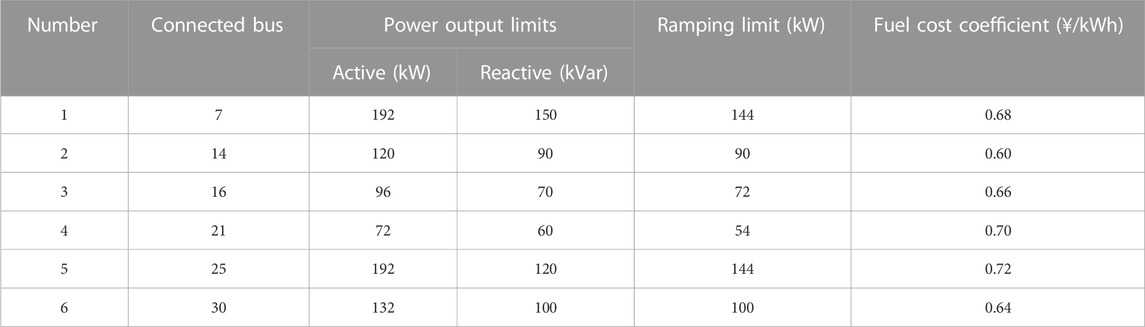
TABLE 1. Parameters of gas turbines.
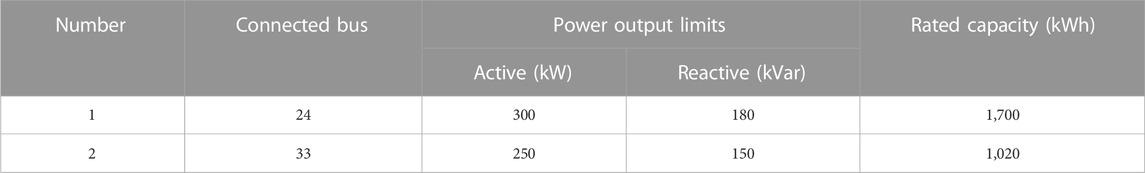
TABLE 2. Parameters of SESSs.
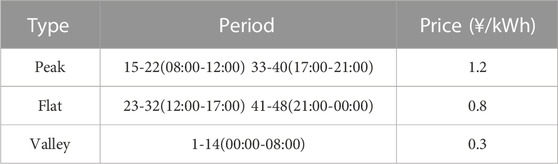
TABLE 3. Time share tariff.
The daily load data of a regional DN is used, and its curve is shown in Figure 4. The active and reactive power of the load at each bus can be obtained by equivalent conversion according to (Baran and Wu, 1989). Buses 4, 8, 12, 15, 18, 29, 31, and 32 are set as critical loads buses, while the others are connected to ordinary loads. To effectively secure the power supply, MESS charging and discharging stations are located at all critical load buses. The penalty coefficient of critical load shedding and ordinary load shedding is set at 1000¥/kW and 20¥/kW. In addition, combined with the fuel cost of cars, the transportation cost coefficient of MESSs is taken as 0.6¥/km, and the operating cost coefficients of SESSs and MESSs are set as 0.04¥/kWh and 0.06¥/kWh. The cost coefficient of network losses is taken as 0.005¥/kWh, while the commissioning cost coefficient of interconnection lines is taken as 5¥/time. After a typhoon disaster, the power purchased from the upstream grid will be limited, which is set to 2,500 kW.

FIGURE 4. Curve of load demand.
The transportation network of the system is shown in Supplementary Figure S2. The nodes in the figure correspond to the buses of DN, each road is accessible in both directions, and the values marked are the actual distances without considering the congestion factor (Zhang, 2021). During the peak hours of traveling, some roads are subject to different degrees of congestion, and the roads with congestion risk and their traffic flow are listed in Supplementary Figure S1. Assuming that both MESSs and RCs move at a speed of 30 km/h, their traveling time between any two buses can be calculated according to the Floyd-Warshall Algorithm. 17:00-19:00 is set as the uncertainty interval based on the meteorological forecast results, and it is considered that a typhoon may occur at any period during this interval (that is, the 33rd, 34th, 35th, or 36th period). In order to find the worst scenario, while taking into account the lead time, it is assumed that the man-made attacks occur in the next period after the typhoon. In addition, to simplify the modeling process, the budgets of the typhoon and man-made attacks are taken as 3 and 1. The number of RC is set to 1, and the initial positions of MESSs and the RC are set at bus 1. The line between buses 1 and 2 is used as the substation outlet and is laid in the form of a cable, which cannot be affected by the typhoon. The repair time of the damaged lines is taken as 2 h.
Since the normal operation stage is the basis for DN dispatch, and the resilience enhancement measures are mostly implemented in the post-disaster degradation stage as well as the defense and recovery stage, the subsequent analysis will focus on these three. Four scenarios are involved, which are listed below:
Scenario 1: In the 36th period, lines 2, 18, and 20 exit operation at the same time.
Scenario 2: In the 36th period, lines 16, 21, and 31 exit operation at the same time.
Scenario 1-after: In the 36th period, lines 2, 18, and 20 exit operation at the same time, and in the subsequent 37th period, MESS1 suffers from man-made attacks and bus 29 no longer permits access to MESSs.
Scenario 2-after: In the 36th period, lines 16, 21, and 31 exit operation at the same time, and in the subsequent 37th period, MESS4 suffers from man-made attacks and bus 18 no longer permits access to MESSs.
5.2 Result analysis
5.2.1 The normal operation stage
The scheduling results of DN in the normal operation stage are shown in Figure 5. As can be seen, DN relies on electricity purchases from the upstream grid to meet most of its load demand, but it also activates gas turbines. This is because most of the time (15th-48th periods), the local marginal price is higher than the unit generation cost of gas turbines. However, during the 1st-13th periods, the local marginal price is low, and it is still more economical for buses far from the substation to use power from the upstream grid even considering the network losses, so the gas turbines are turned off. The 14th period is the transition between the two states. It is also observed that although the output of the energy storage devices fluctuates, they arbitrage based on the variation of the local marginal price, that is, they charge during the 1st-14th and 23rd-32nd periods, discharge during the 15th-22nd and 33rd-40th periods. And in the 41st-48th periods, they do not participate in the optimal operation of the DN.
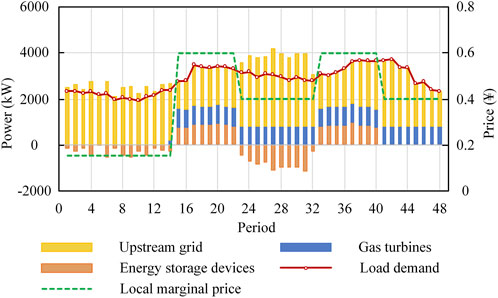
FIGURE 5. Scheduling results of DN in the normal operation stage.
To fully illustrate the above phenomenon, the SOC variation curves of the energy storage devices are made, as shown in Supplementary Figure S3. It can be seen that the SOC of each device is close to 0.9 in the 14th and 32nd periods and close to 0.1 in the 22nd and 40th periods. This is because the electricity price is the lowest in the 1st-14th periods and the energy storage devices will tend to charge at this time to store energy for discharging in the 15th-22nd periods. Similarly, during the 23rd-32nd periods, each unit is recharged to restore power supply capacity in preparation for the 33rd-40th periods. This effectively reduces the operating cost of the DN. And the SOC of each energy storage device keeps the lowest limit value of 0.1 during the 41st-48th periods. This is because the periods are near the end of the day, and the price of electricity is unchanged, there is no room for arbitrage subsequently, to avoid the cost of charging and discharging, the energy storage devices tend to withdraw from operation.
The changes of MESSs connected buses are shown in Supplementary Figure S4. It can be found that MESSs are not always in the connection status under all periods, which is because they need some transportation time. Based on their mobile speed, it is known that MESSs will have one period in the mobile state when the connected buses change, which is represented by a blank in the figure. In addition, it can be seen that the MESSs tend to connect to buses 4, 8, 12, and 29 when they need to be charged, while connecting to buses 15, 18, 31, and 32 when discharge is required. This is because the former buses are closer to the upstream grid and connecting them for charging reduces the network losses; meanwhile, the later 4 buses are relatively back, and it would cause higher network losses if gas turbines or even the upstream grid are used to energize the nearby loads, so the MESSs would prefer to connect to them for load supply.
5.2.2 The disaster disruption stage
To ensure the robustness of the model, the worst scenario needs to be generated. However, considering the uncertainty of typhoon occurrence time and the randomness of line damage, there are many possible scenarios, and it is difficult to select the scenario with the largest load shedding from them. A clumsy but effective method is therefore proposed: Firstly, deactivate MESSs and the RC, optimize the remaining resources of DN, and eliminate the scenarios with no load shedding. Then, the full scheduling resources are considered and the filtered scenarios are re-optimized to obtain the worst scenario according to their load shedding. The principle of the method is that the resilience of the DN is reduced when MESSs and the RC are not involved. In this condition, if it is still able to maintain the power supply for all loads, it will not have load shedding with MESSs and the RC involved. The worst scenario generation results are shown in Table 4.
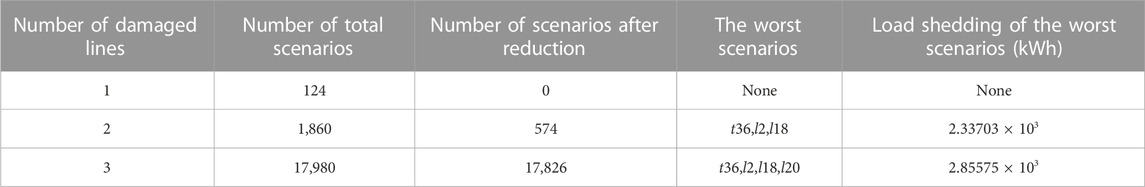
TABLE 4. Results of the worst scenario generation.
As can be seen from Table 4, the system can respond effectively to
5.2.3 The post-disaster degradation stage
The scheduling results, SOC variation curves of energy storage devices, and topology change of the DN under Scenario 1 are shown in Figures 6, 7; Supplementary Figure S5. It can be seen that all gas turbines are working at the maximum output and each energy storage device is in discharge status. In the 36th-38th periods, lines 2, 18, and 20 are withdrawn from operation, and DN is disconnected from the upstream grid. Although there are energy storage devices, they are still unable to maintain the power supply of the whole network, so there is a large amount of load shedding. In the 39th-41st periods, line 2 is restored, and DN can re-establish connection with the upstream grid. At this time, interconnection line 33 is put into operation to restore the load located on buses 21 and 22, but there is still a small amount of load shedding because lines 18 and 20 are in fault status. In the 42nd-44th periods, line 18 is also recommissioned, but by this time the SOC of the energy storage devices has reached the bottom and they cannot continue to supply energy, limited by the electricity purchase constraint, DN still needs to remove part of the ordinary loads. To improve the system economy, the DSO will eventually choose to remove some loads located at buses 21 and 22 and decommission interconnection line 33 in the 42nd period; while in the 43rd and 44th periods, the load demand is reduced and DN can supply the removed loads, so the interconnection line 33 will be put back into operation again. In the 45th-48th periods, all lines are restored and the load demand is further reduced. The DN can switch back to normal operation.

FIGURE 6. Scheduling results of DN in Scenario 1.
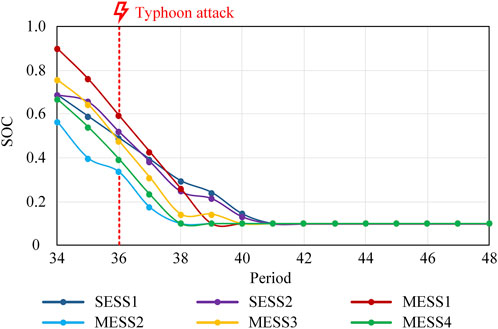
FIGURE 7. SOC variation curves of energy storage devices in Scenario 1.
In addition, the access buses of MESSs are not changed during the whole failure process, which is mainly because: in the 36th-41st periods, the MESSs are relied on to reduce load shedding, and they cannot continue to supply the surrounding loads during the movement, so from the reliability point of view, each MESS should keep its original access bus unchanged. In the 42nd period and beyond, the power of each MESS is depleted and it makes no sense to change its access bus, so from the economy point of view, each MESS should still be connected to its original access bus.
Since Scenario 1 does not reflect the coupling relationship between MESSs, NR, and RCs, Scenario 2 is introduced, and the results are shown in Supplementary Figure S6. As can be seen, after the faults occur, bus 22 is removed, buses 17 and 18 form Island 1, and buses 32 and 33 form Island 2. In this context, interconnection line 35 is put into operation, and MESS2 travels from bus 31 to bus 32 for discharge. As Island 2 contains SESS2 to assist in power supply, the energy consumption rate of MESS2 is slower than that of MESS4. To avoid poor availability due to over-discharge, the DSO chooses to commission interconnection line 36 and provide support for Island 1 from Island 2 in the 38th period. In the 39th period, line 16 returns to normal, Island 1 disappears, and Island 2 continues to supply the local loads with the combined effect of SESS2 and MESS2. During the 40th and 41st periods, the power in both energy storage devices is depleted and the interconnection line 36 has to be put into operation again. In the following 42nd and 45th periods, lines 21 and 31 are restored in turn, and DN finally returns to normal operation.
Comprehensive analysis shows that both MESSs and SESSs can be used as backup power sources to supply isolated loads after a HILP event. In contrast, MESSs are more flexible since they can go to the buses nearby to discharge according to the emergency power support demand of the islands to minimize the operating cost of the interconnection lines due to NR. For the islands that do not contain gas turbines, SESSs, or MESSs candidate buses, the connection to the main network can be restored with the help of NR. Meanwhile, the addition of RC can repair the damaged lines as soon as possible, so that the DN can gradually return to normal operation and avoid its massive load shedding after the energy stored in MESSs and SESSs is depleted. The interplay of MESSs, NR, and RCs can effectively reduce the amount of load shedding and improve the resilience of DN.
5.2.4 The man-made attack stage
The man-made attack stage also adopts the idea of robust optimization, which combines the budget to find the attack scheme that maximizes load shedding. Considering the small number of MESSs and their access buses, this paper adopts the traversal method. It is assumed that the malicious attacker launches attacks at the next period of the typhoon disaster, resulting in a MESS DoS, and the impact is not cleared until all lines damaged by the typhoon resume normal operation. Accordingly, the amount of load shedding and the operating cost of Scenario 1 and Scenario 2 under various attack schemes are counted, which are shown in Tables 5, 6. The most severe attack scheme in Scenario 1 is that in the 37th period, MESS1 is taken out of operation and bus 29 no longer allows access to the remaining normal MESSs. This is evidenced by Figure 7, where the SOC of MESS1 is the largest in the 37th period, and thus it causes the most severe impact on the DN after suffering an attack. For the sake of presentation, this attack scheme is defined as Scenario 1-after. Considering that in the 37th period of Scenario 2, MESS2 is in the mobile status, this paper does not calculate its exposure to the attack. Therefore, the most severe attack scheme in Scenario 2 is that at the 37th period, MESS4 is withdrawn from the operation and bus 18 is no longer allowed to access the remaining MESSs. Similarly, this attack scheme is defined as Scenario 2-after.
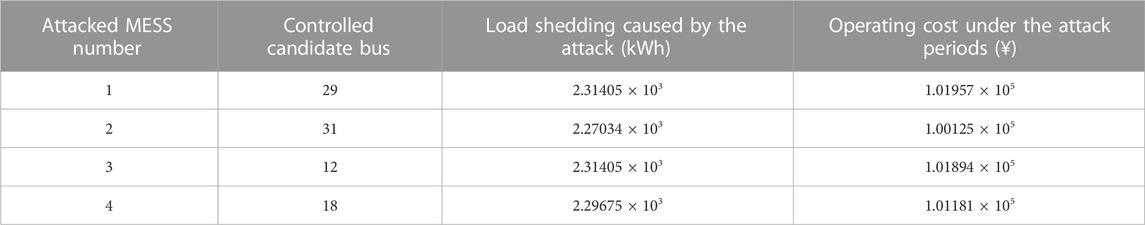
TABLE 5. Comparison of attack schemes under Scenario 1.
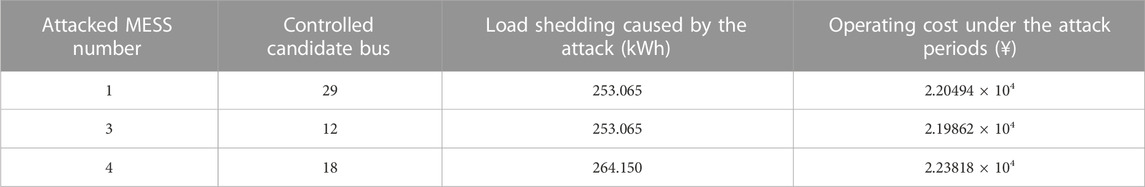
TABLE 6. Comparison of attack schemes under Scenario 2.
5.2.5 The defense and recovery stage
The SOC variation curves of energy storage devices and topology change of the DN under Scenario 1-after are shown in Figure 8; Supplementary Figure S7. It can be seen that after the attack on MESS1 in the 37th period, the SOC decrease rate of the rest energy storage devices is unchanged. This is because before that, the DN has been disconnected from the upstream grid and cannot maintain the power supply for its loads. At this time, if the power output of the rest energy storage devices is increased to make up for the power shortage caused by the withdrawal of MESS1, although the amount of load shedding can be reduced in a short period, the stored energy will be consumed prematurely, which will still cause a large amount of load shedding in the subsequent periods, and may even result in greater economic losses due to the inability to meet the demand of critical loads, so the scheduling plan of the rest energy storage devices is not changed. In addition, the topology change of the DN under Scenario 1-after is consistent with Scenario 1 during the 37th-44th periods. In the 45th period and beyond, MESS1 can resume normal operation, which will travel to bus 32 to optimize the power flow distribution and reduce the overall operating cost.
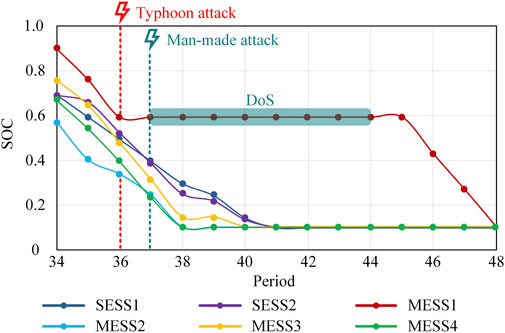
FIGURE 8. SOC variation curves of energy storage devices in Scenario 1-after.
Similarly, the SOC variation curves of energy storage devices and topology change of the DN under Scenario 2-after are analyzed, as shown in Figure 9; Supplementary Figure S8. Before the DN suffers man-made attacks, lines 16, 21, and 31 are out of operation, buses 17 and 18 form Island 1, and buses 32 and 33 form Island 2. During the 37th period, MESS4 decommissions and bus 18 denies access to the remaining MESSs. To minimize the amount of load shedding, the DSO has to commission interconnection line 36 and provide power support to Island 1 from Island 2. At the same time, MESS2 will go to bus 32 for discharge. Considering the large load demand of the two islands, to avoid the availability of MESS2 from deteriorating, in the 38th period, the DSO will send MESS3 to take over its discharge. In the 39th period, line 16 returns to normal, and Island 1 disappears. Only a small amount of load demand exists within Island 2, which can be handled by MESS3 with guaranteed availability in subsequent periods, so the location of MESS3 is not changed. Meanwhile, MESS2 will go to bus 15 for discharge to minimize network losses. In the 40th period, the SOC of both SESS2 and MESS3 is close to 0.1, and the interconnection line 36 is recommissioned. In the subsequent 41st period, MESS1 will go to bus 32 to take over the task of MESS3. Considering the high amount of energy stored in MESS1, the DSO will exit interconnection line 36 again. In the 42nd-44th periods, the power of all energy storage devices is depleted, so the interconnection line 36 is recommissioned. At the 45th period and beyond, MESS4 resumes normal operation and will stay at bus 18 to optimize power flow.
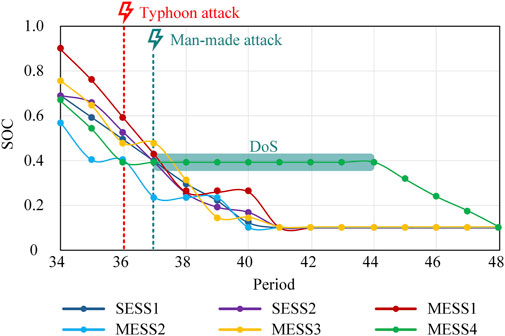
FIGURE 9. SOC variation curves of energy storage devices in Scenario 2-after.
The above analysis shows that after a HILP event, if a MESS is withdrawn from operation due to man-made attacks, resulting in further degradation of the DN, the remaining MESSs need to make up for the power shortage caused by this MESS as much as possible with the cooperation of NR and RCs while ensuring the completion of their subsequent power supply tasks, to reduce the amount of load shedding and improve the overall economy.
5.3 Validity evaluation
To verify the effectiveness of the proposed model, the following four scheduling strategies are further set up for comparison by referring to (Lai et al., 2018; Lei et al., 2019; Zeng et al., 2022), as shown in Supplementary Table S2:
Strategy A: Disregard the impact of man-made attacks and only defend against natural disasters, while not considering the involvement of MESSs and only dispatching gas turbines, SESSs, RCs, and NR to enhance the resilience of the DN; Strategy B: Similarly disregard the impact of man-made attacks and defend against natural disasters only, but fully dispatching gas turbines, SESSs, MESSs, RCs, and NR to enhance the resilience of the DN; Strategy C: Consider the dual impact of natural disasters and man-made attacks, but disregard the involvement of RCs, assume that the lines cannot be repaired after damage, and only dispatch gas turbines, SESSs, MESSs, and NR to enhance the resilience of the DN; Strategy D: Consider the dual impact of natural disasters and man-made attacks, and fully dispatch gas turbines, SESSs, MESSs, RCs, and NR to enhance the resilience of the DN, which is the model proposed in this paper.
Supplementary Table S3 shows the application results of the four scheduling strategies when the worst scenario (that is, Scenario 1-after) occurs. It should be noted that RCs are involved in strategies A, B, and D. With their help, all damaged lines and MESSs will be repaired in the 45th period, and the DN will thus return to the normal operation stage, so only the load shedding and the operation cost in the 36th–44th period are compared. As can be seen from the table, Strategy A does not consider the participation of MESSs and excludes vulnerable wireless communication, which can be free from man-made attacks, but due to the lack of flexible scheduling resources, it is difficult to provide emergency power support after natural disasters such as typhoons, which still generates a large amount of load shedding and triggers high operating cost. In contrast, both the amount of load shedding and the operating cost of Strategy B are reduced because it can adequately dispatch MESSs and other resources to effectively enhance the resilience of the DN after the typhoon. However, once man-made attacks occur in the post-disaster degradation stage, Strategy B is inevitably tired to cope with them, thus incurring partial load shedding and additional operating cost. Then comes Strategy C. Although it considers the dual impact of natural disasters and man-made attacks, it does not account for the restoration effect of RCs, so the damage caused by the typhoon will last throughout the dispatch process and continue to generate load shedding, so it has the worst application result among the four. Strategy D, the model proposed in this paper, fully takes into account the dual impact of natural disasters and man-made attacks, and is able to dispatch gas turbines, SESSs, MESSs, RCs, and NR to effectively improve the resilience of the DN, so it is at the lowest level in terms of both the load shedding and the operating cost.
In addition, some literature assumes that the time of the natural disaster is known and fixed, but disasters such as typhoons are characterized by high suddenness and rapid movement, their occurrence time, location, and scale are uncertain. Although the accuracy of weather forecasting is improving year by year, it is not enough to achieve accurate prediction, so there is a demand to consider the uncertainty of natural disaster occurrence time in the scheduling model. In this paper, we set the corresponding “uncertainty interval” based on the weather forecast results, and consider that the disaster may cause damage to the DN at any point of time during the period so that the worst scenario can be identified and dispatched for defense, which is more realistic and robust.
6 Conclusion
A multi-stage optimal operation strategy for DNs to tackle sequential natural disasters and man-made attacks is proposed in this paper. Firstly, the operation process of DN is segmented based on the time difference between natural disasters and malicious man-made attacks. Secondly, in the context of a coupled power-transportation system, the optimal operation models of different stages are established considering multi-type resources. Then a complex model with a large number of binary variables is formed, and it is transformed into a 5-layer MILP problem based on the time series relationship. Finally, 4 scenarios are introduced to validate the effectiveness of the proposed model and strategy, and the following conclusions are drawn:
After a HILP event, the energy storage devices can be used as backup power sources to support the isolated loads. Compared to SESSs, MESSs are more flexible as they can travel to the candidate buses for discharge according to the emergency power support demand, securing the power supply to the load and minimizing the operating cost of the interconnection lines. For islands that do not contain gas turbines, SESSs, or MESSs candidate buses, the connection to the main network can be restored with the help of NR, which will reduce the amount of load shedding. And the addition of RCs can repair the damaged lines as soon as possible so that the DN can gradually return to normal operation and avoid a large number of load shedding when the energy stored in MESSs and SESSs is depleted. If a MESS is out of operation due to man-made attacks, the remaining MESSs need to make up for the resulting power shortage as much as possible by cooperating with NR and RCs to reduce load shedding and operating cost with the guarantee of completing their subsequent tasks.
Future research can be conducted in the following directions. Firstly, preventive countermeasures such as pre-disaster RCs deployment and distribution lines reinforcement, as well as emergency countermeasures such as fault isolation can be further considered. Secondly, a capacity allocation strategy of MESSs for DN resilience enhancement can be studied. Combined with the resources available in DN, the number of MESSs to be built can be optimally analyzed, and the rated power and capacity of each MESS can be determined. Thirdly, optimization algorithms with the ability to handle large-scale binary variables can be investigated, to improve the computational efficiency of the model.
Data availability statement
The original contributions presented in the study are included in the article/Supplementary Material, further inquiries can be directed to the corresponding author.
Author contributions
FY: Writing–review and editing, Conceptualization, Methodology, Writing–original draft. SM: Supervision, Validation, Writing–review and editing. TW: Data curation, Investigation, Validation, Writing–review and editing. CC: Writing–review and editing. JW: Data curation, Writing–review and editing. WW: Data curation, Writing–review and editing.
Funding
The author(s) declare financial support was received for the research, authorship, and/or publication of this article. The authors appreciate the financial support provided by the Science and Technology Project of State Grid Corporation of China (5419-202199551A-0-5-ZN).
Conflict of interest
The authors declare that the research was conducted in the absence of any commercial or financial relationships that could be construed as a potential conflict of interest.
The authors declare that this study received funding from State Grid Corporation of China. The funder had the following involvement with the study: study design.
Publisher’s note
All claims expressed in this article are solely those of the authors and do not necessarily represent those of their affiliated organizations, or those of the publisher, the editors and the reviewers. Any product that may be evaluated in this article, or claim that may be made by its manufacturer, is not guaranteed or endorsed by the publisher.
Supplementary material
The Supplementary Material for this article can be found online at: https://www.frontiersin.org/articles/10.3389/fenrg.2023.1290168/full#supplementary-material
References
Ababei, C., and Kavasseri, R. (2011). Efficient network reconfiguration using minimum cost maximum flow-based branch exchanges and random walks-based loss estimations. IEEE Trans. Power Syst. 26 (1), 30–37. doi:10.1109/TPWRS.2010.2052076
Aini, A., and Salehipour, A. (2012). Speeding up the Floyd–Warshall algorithm for the cycled shortest path problem. Appl. Math. Lett. 25 (1), 1–5. doi:10.1016/j.aml.2011.06.008
Amirioun, M. H., Aminifar, F., and Shahidehpour, M. (2019). Resilience-promoting proactive scheduling against hurricanes in multiple energy carrier microgrids. IEEE Trans. Power Syst. 34 (3), 2160–2168. doi:10.1109/TPWRS.2018.2881954
Arif, A., Wang, Z., Chen, C., and Wang, J. (2020). Repair and resource scheduling in unbalanced distribution systems using neighborhood search. IEEE Trans. Smart Grid 11 (1), 673–685. doi:10.1109/TSG.2019.2927739
Ashrafi, R., Amirahmadi, M., Tolou-Askari, M., and Ghods, V. (2021). Multi-objective resilience enhancement program in smart grids during extreme weather conditions. Int. J. Electr. Power Energy Syst. 129, 106824. doi:10.1016/j.ijepes.2021.106824
Baran, M. E., and Wu, F. F. (1989). Network reconfiguration in distribution systems for loss reduction and load balancing. IEEE Trans. Power Deliv. 4 (2), 1401–1407. doi:10.1109/61.25627
Bitsikas, E., and Pöpper, C. (2021). Don't hand it over: vulnerabilities in the handover procedure of cellular telecommunications. ACSAC '21 Annu. Comput. Secur. Appl. Conf., 900–915. doi:10.1145/3485832.3485914
Chen, Z., Liu, Z., and Wang, L. (2022). A modified model predictive control method for frequency regulation of microgrids under status feedback attacks and time-delay attacks. Int. J. Electr. Power Energy Syst. 137, 107713. doi:10.1016/j.ijepes.2021.107713
Cheng, L., Wan, Y., Qi, N., and Tian, L. (2021). Review and prospect of research on operation reliability of power distribution and consumption system considering various distributed energy resources. Autom. Electr. Power Syst. 45 (22), 191–207. doi:10.7500/AEPS20200828012
Cong, H., He, Y., Wang, X., and Jiang, C. (2018). Robust optimization for improving resilience of integrated energy systems with electricity and natural gas infrastructures. J. Mod. Power Syst. Clean. Energy 6 (5), 1066–1078. doi:10.1007/s40565-018-0377-5
Ding, T., Lin, Y., Bie, Z., and Chen, C. (2017). A resilient microgrid formation strategy for load restoration considering master-slave distributed generators and topology reconfiguration. Appl. Energy 199, 205–216. doi:10.1016/j.apenergy.2017.05.012
Gao, H., Chen, Y., Huang, S., and Xu, Y. (2015). Distribution systems resilience: an overview of research progress. Autom. Electr. Power Syst. 39 (23), 1–8. doi:10.7500/AEPS20150717002
Huang, G., Li, G., Xiao, Y., Bie, Z., and Sun, S. (2021). Optimal placement for integrated electricity and gas energy system considering natural disasters and man-made attacks. Power Syst. Technol. 45 (3), 959–969. doi:10.13335/j.1000-3673.pst.2020.1047
Javadi, E. A., Joorabian, M., and Barati, H. (2022). A bi-level optimization framework for resilience enhancement of electricity and natural gas networks with participation of energy hubs. Int. J. Electr. Power Energy Syst. 142 (A), 108312. doi:10.1016/j.ijepes.2022.108312
Lai, K., Wang, Y., Shi, D., Illindala, M. S., Zhang, X., and Wang, Z. (2018). A resilient power system operation strategy considering transmission line attacks. IEEE Access 6, 70633–70643. doi:10.1109/ACCESS.2018.2875854
Lei, S., Chen, C., Zhou, H., and Hou, Y. (2019). Routing and scheduling of mobile power sources for distribution system resilience enhancement. IEEE Trans. Smart Grid 10 (5), 5650–5662. doi:10.1109/TSG.2018.2889347
Li, J., Wang, D., Fan, H., Yang, D., Fang, R., and Sang, Z. (2022b). Hierarchical optimal control method for active distribution network with mobile energy storage. Autom. Electr. Power Syst. 46 (10), 189–198. doi:10.7500/AEPS20211008005
Li, Z., Tang, W., Lian, X., Chen, X., Zhang, W., and Qian, T. (2022a). A resilience-oriented two-stage recovery method for power distribution system considering transportation network. Int. J. Electr. Power Energy Syst. 135, 107497. doi:10.1016/j.ijepes.2021.107497
Liu, L., Padilla, L., Creem-Regehr, S., and House, D. (2019). Visualizing uncertain tropical cyclone predictions using representative samples from ensembles of forecast tracks. IEEE Trans. Vis. Comput. Graph. 25 (1), 882–891. doi:10.1109/TVCG.2018.2865193
Nazemi, M., Moeini-Aghtaie, M., Fotuhi-Firuzabad, M., and Dehghanian, P. (2020). Energy storage planning for enhanced resilience of power distribution networks against earthquakes. IEEE Trans. Sustain. Energy 11 (2), 795–806. doi:10.1109/TSTE.2019.2907613
Nourollahi, R., Salyani, P., Zare, K., and Mohammadi-Ivatloo, B. (2021). Resiliency-oriented optimal scheduling of microgrids in the presence of demand response programs using a hybrid stochastic-robust optimization approach. Int. J. Electr. Power Energy Syst. 128, 106723. doi:10.1016/j.ijepes.2020.106723
Presidential Policy Directive 21, (2013). Presidential policy directive (PPD) 21. Washington, DC, USA: The White House.
Reda, H., Anwar, A., and Mahmood, A. (2022). Comprehensive survey and taxonomies of false data injection attacks in smart grids: attack models, targets, and impacts. Renew. Sustain. Energy Rev. 163, 112423. doi:10.1016/j.rser.2022.112423
Sharma, D. D., Singh, S. N., Lin, J., and Foruzan, E. (2017). Agent-based distributed control schemes for distributed energy storage systems under cyber attacks. IEEE J. Emerg. Sel. Top. Circuits Syst. 7 (2), 307–318. doi:10.1109/JETCAS.2017.2700947
Shi, Q., Li, F., Olama, M., Dong, J., Xue, Y., Starke, M., et al. (2021b). Network reconfiguration and distributed energy resource scheduling for improved distribution system resilience. Int. J. Electr. Power Energy Syst. 124, 106355. doi:10.1016/j.ijepes.2020.106355
Shi, Q., Li, F., Olama, M., Dong, J., Xue, Y., Starke, M., et al. (2021a). Post-extreme-event restoration using linear topological constraints and DER scheduling to enhance distribution system resilience. Int. J. Electr. Power Energy Syst. 131, 107029. doi:10.1016/j.ijepes.2021.107029
Shi, Q., Liu, W., Zeng, B., Hui, H., and Li, F. (2022). Enhancing distribution system resilience against extreme weather events: concept review, algorithm summary, and future vision. Int. J. Electr. Power Energy Syst. 138, 107860. doi:10.1016/j.ijepes.2021.107860
Wang, Z., and Wang, J. (2015). Self-healing resilient distribution systems based on sectionalization into microgrids. IEEE Trans. Power Syst. 30 (6), 3139–3149. doi:10.1109/TPWRS.2015.2389753
Yan, M., He, Y., Shahidehpour, M., Ai, X., Li, Z., and Wen, J. (2019). Coordinated regional-district operation of integrated energy systems for resilience enhancement in natural disasters. IEEE Trans. Smart Grid 10 (5), 4881–4892. doi:10.1109/TSG.2018.2870358
Yuan, W., Wang, J., Qiu, F., Chen, C., Kang, C., and Zeng, B. (2016). Robust optimization-based resilient distribution network planning against natural disasters. IEEE Trans. Smart Grid 7 (6), 2817–2826. doi:10.1109/TSG.2015.2513048
Zeng, Y., Qin, C., Liu, J., and Xu, X. (2022). Coordinating multiple resources for enhancing distribution system resilience against extreme weather events considering multi-stage coupling. Int. J. Electr. Power Energy Syst. 138, 107901. doi:10.1016/j.ijepes.2021.107901
Zhang, G., Zhang, F., Zhang, X., Wu, Q., and Meng, K. (2020). A multi-disaster-scenario distributionally robust planning model for enhancing the resilience of distribution systems. Int. J. Electr. Power Energy Syst. 122, 106161. doi:10.1016/j.ijepes.2020.106161
Zhang, H., Ma, S., Ding, T., Lin, Y., and Shahidehpour, M. (2021). Multi-stage multi-zone defender-attacker-defender model for optimal resilience strategy with distribution line hardening and energy storage system deployment. IEEE Trans. Smart Grid 12 (2), 1194–1205. doi:10.1109/TSG.2020.3027767
Keywords: distribution network, resilience, natural disaster, man-made attack, robust optimization
Citation: Yao F, Miao S, Wang T, Chen C, Wang J and Wei W (2023) A resilience-oriented multi-stage operation strategy for distribution networks considering multi-type resources. Front. Energy Res. 11:1290168. doi: 10.3389/fenrg.2023.1290168
Received: 07 September 2023; Accepted: 09 October 2023;
Published: 20 October 2023.
Edited by:
Dong Han, University of Shanghai for Science and Technology, ChinaReviewed by:
Yongxi Zhang, Changsha University of Science and Technology, ChinaHan Wang, Shanghai Jiao Tong University, China
Copyright © 2023 Yao, Miao, Wang, Chen, Wang and Wei. This is an open-access article distributed under the terms of the Creative Commons Attribution License (CC BY). The use, distribution or reproduction in other forums is permitted, provided the original author(s) and the copyright owner(s) are credited and that the original publication in this journal is cited, in accordance with accepted academic practice. No use, distribution or reproduction is permitted which does not comply with these terms.
*Correspondence: Shihong Miao, c2htaWFvQGh1c3QuZWR1LmNu