 Zhenbing Zhao
 Jing Xiong1,4
 Yu Han
 Siyu Miao
- 1School of Electrical and Electronic Engineering, North China Electric Power University, Baoding, China
- 2Engineering Research Center of Intelligent Computing for Complex Energy Systems, Ministry of Education, North China Electric Power University, Baoding, China
- 3Hebei Key Laboratory of Power Internet of Things Technology, North China Electric Power University, Baoding, China
- 4Department of Information Engineering, Sichuan Vocational and Technical College of Communications, Chengdu, China
Introduction: To solve the problems of small proportion of bolts in aerial images of power transmission lines, small differences between classes, and difficulty in extracting refined features, this paper proposes a method for detecting power transmission line bolts and their defects based on positional relationships.
Methods: Firstly, a spatial attention module is added to Faster R-CNN, using two parallel cross attention to obtain cross path features and global features respectively, and spatial feature enhancement is performed on the features output from the convolution layer. Then, starting from the spatial position relationship of bolts and their defects, using the relative geometric features of candidate regions as input, the spatial position relationship of bolts and their defects on the image is modeled. Finally, the position features and regional features are connected to obtain enhanced features. The bolt position knowledge on the connecting plate is added to the detection model to improve the detection accuracy of the model.
Results and discussion: The experimental results show that the mAP value of the algorithm in this paper is increased by 6.61% compared to the Faster R-CNN detection model in aerial photography of transmission line bolts and their defect datasets, with the AP value of normal bolts increased by 1.73%, the AP value of pin losing increased by 4.45%, and the AP value of nut losing increased by 13.63%.
1 Introduction
Under the urgent requirement of achieving carbon peaking and carbon neutrality goals, the structure of China’s power system form is undergoing fundamental changes (Zhuo et al., 2023). With the construction and development of new power systems, new power equipment such as power electronics and large-scale energy storage devices will be widely used, and the requirements for flexible and controllable and safe and stable power grids are becoming increasingly high (Sheng et al., 2021). Bolts are present in large numbers in power transmission lines and play a key role in fixing and connecting various components. However, due to long -term working in the wild, various components will be affected by natural environment and the external mechanical load tension and the internal power load of the power system. These factors can cause the bolts connected to various components to produce defects such as loose nuts, losing, and stripped pins, which seriously affects the stable transmission of electrical energy (Zhao et al., 2021; Zhao and Ding, 2022). Therefore, in order to ensure the safe operation of transmission lines, it is crucial to carry out regular inspection of transmission line bolts and their defects.
Traditional transmission line inspection methods require electric workers to climb the tower, and in order to accurately record the cause of faults and carry out timely repairs, workers need to carry a variety of working tools when climbing the tower, which is not only economically costly, dangerous working environment and extremely inefficient inspection. Therefore, with the continuous development of deep learning technology, more and more scholars have started to adopt deep learning for the analysis and processing of transmission line images. Artificial intelligence technology has become a current hotspot and has performed powerfully in many fields, especially in target detection with many excellent results (Ge et al., 2017). And the main task of target detection is to find out all the targets of interest in the image and determine their class and location. Deep learning-based target detection algorithms are mainly divided into two categories, one is the Faster R-CNN (Ren et al., 2017) (Faster Regions with Convolutional Neural Network Features) series, a two-stage detection model based on region suggestion. One is a regression-based single-stage detection model based on the YOLO (Redmon et al., 2016) (You Only Look Once) series and the SSD (Liu et al., 2016) (Single Shot Detection) series.
To achieve automatic detection of transmission line bolts and their defects, many scholars have introduced target detection algorithms into the detection of bolts and their defects to reduce the reliance on traditional manual inspection. A transmission line bolt detection method for processing massive UAV (Unmanned Aerial Vehicle) image data using UAV inspection images was proposed by Feng et al. (2018). This method firstly establishes a sample library, extracts HOG (Histogram of Oriented Gradients) features and constructs SVM (Support Vector Machine) classification to achieve recognition of high-resolution UAV inspection images. However, this method is susceptible to the influence of image illumination and effects. A deep learning-based transmission line bolt detection system for transmission line bolts with inconspicuous features, small size and difficult detection in inspection images was proposed by Zhang et al. (2021). This method adopts the principle of hierarchical detection, using the SSD algorithm to locate the defective bolt connection parts and cut out the connection parts, increasing the proportion of bolts in inspection images. Secondly, this method uses data augmentation to expand the dataset, and finally uses the YOLOv3 algorithm to detect defective bolts. An automatic detection model called Automatic Visual Shape Clustering Network (AVSCNet) was constructed to detect losing pins for transmission line bolts that are prone to losing pins by Zhao et al. (2020). First, an unsupervised clustering method for bolometric visual shapes is proposed and applied to construct a defect detection model that learns differences in visual shapes. Next, three deep convolutional neural network optimisation methods are used in the model: feature enhancement, feature fusion, and region feature extraction. Regression calculation and classification are applied to the region features to obtain defect detection results. However, during the training of the model, many hyperparameters need to be set manually and do not have automatic learning capabilities. To solve the problems of too small bolt targets, small differences between different categories and difficulty in extracting fine features, a detection method with a dual attention mechanism was proposed by Qi et al. (2021). This method analyzes and enhances visual features at different scales and locations respectively. This method uses multi-scale attention modules to enhance fine features in the bolt region and spatial attention modules to increase the feature differences between the bolt and the background to improve the prediction of the bolt region. The Ultrasmall Bolt Defect Detection Model (UBDDM) based on Deep Convolutional Neural Network (DCNN) was proposed by Luo et al. (2023). Which included Ultrasmall Object Perception Module (UOPM) and Local Bolt Detection Module (LBDM), and introduces a hybrid attention mechanism and multi-scale feature fusion to further improve the network’s ability to extract shallow features. A novel and high-accuracy defect detection method based on deep learning technology, named insulator defect detection network (I2D-Net) was proposed by Fu et al. (2023), which improves the ability of defect location in the presence of interference factors. An efficient and high-performance defect detection model called DDNet is proposed by Gong et al. (2023) to recognize defects from images of unmanned aerial vehicles. The attention mechanism was adopted in the improved detection model in order to enhance the representation learning of the image. However, the model only focuses on enhancing the bolt features, without incorporating the inherent bolt position information into the detection.
Transmission lines have problems such as small targets for bolts and their defects, limited information on targets, difficulty in feature extraction, and small differences between target classes. To alleviate these problems to a certain extent and promote the widespread application of deep learning in the detection of bolts and their defects in transmission lines, this article proposes the following methods. Firstly, the spatial attention module is added to the Faster R-CNN model to help the model acquire global features to achieve the purpose of bolts and their defects feature enhancement. Then the location inference module is used to add location relations to the detection model to reduce the leakage and false detection of bolts and their defects detection, which can improve the detection effect of the model.
2 Research background
As a crucial connection component, bolts are present in large numbers on all types of fixtures, which are widely distributed and numerous in transmission lines. However, the bolts and their defects account for a very small proportion of the aerial images, making them easy to miss detection when they are directly detected together with the fixtures. In Figure 1, the original bolt image is nearly impossible to identify within the complicated background of the aerial image. The detection model is often at risk of losing important features when extracting bolt features, rendering bolt detection a challenging task.
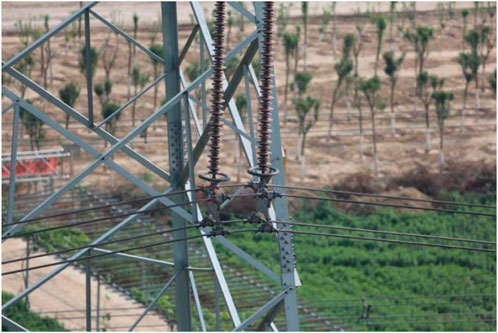
FIGURE 1. Aerial photograph of the original bolts of the transmission line.
Therefore, this paper discards the idea of directly detecting bolts and their defects on aerial images, but instead annotates the metal tool targets, mainly joint plates, to build a dataset of bolts and their defects. Afterwards, carries out the detection of transmission line bolts and their defects afterwards. This design method can effectively increase the proportion of bolt targets in the image, reduce the influence of complex background on bolt detection, and effectively reduce the information loss of bolt targets. We add a spatial attention module to the detection model to improve the model’s ability to extract bolts and their defect features.
Figure 2 shows several sets of cropped yoke plate images. It can be seen that the bolts and their defect targets in the image are distributed in a triangular pattern, and the cropped image is clearer than the original aerial image. The cropped image size is smaller, which can make the detection speed faster.
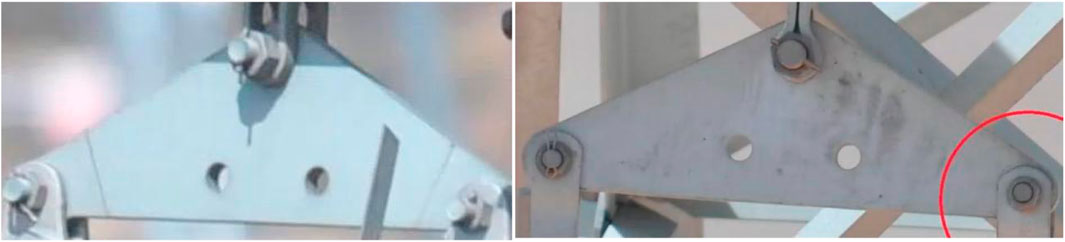
FIGURE 2. Transmission line bolts and their defects.
As the bolts on the transmission line coupling plate generally have a fixed position, the coupling plate target is chosen for the labeling of transmission line bolts and their defect data sets. Figure 3 shows the structure of the transmission line joint board, which is a board-shaped connection for the parallel assembly of multiple branches, mostly used for the parallel assembly of double insulator strings and multiple insulator strings, the assembly of insulator strings with double and multiple wires and the assembly of double pulling wires and other connections. There are various types of plates, such as L-plate, LZ-plate, LF-plate, LJ-plate and LE-plate, etc. The different types of plates are subject to different forces depending on their structure. In this paper we primarily focus on L-plates. The coupling plate in Figure 3 is the most typical and common L-shaped coupling plate, which is used for assembling double tension insulator strings with a single conductor, single insulator strings with two split conductors, and also for forming triple insulator strings in parallel. In Figures 3A–C are bolt installation positions. It can be found that the position of the bolts on the L-shaped coupling plate is fixed and the connection of the midpoints of each bolt can form a triangle. Therefore, a priori knowledge can be added to the detection of the bolts and their defects, and the inference of the bolt position relationship can be added after the (Region Proposal Network) RPN generates the candidate region in order to improve the fit of the bolt detection frame to the target, and at the same time improve the detection accuracy of the model.
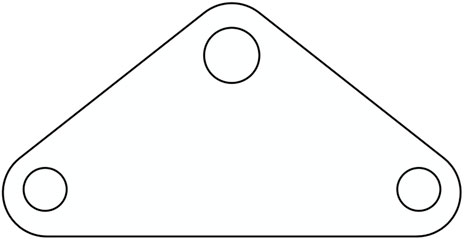
FIGURE 3. Structure of the transmission line coupling board.
3 Materials and methods
The overall block diagram of the bolt and its defect detection model in this paper is shown in Figure 4. Firstly, to address the problem of small differences between classes of bolts and their defects and small bolt targets, spatial attention is added after the feature extraction network ResNet-101 to help capture global dependencies for each pixel through two crossover networks, so that the bolts and their defect targets can obtain global contextual information efficiently and quickly. The specific process is divided into two branches. One is to obtain the feature map H by convolutional downscaling of the features output from the convolutional layer, and then input H into the cross-attention module to produce a new feature map H*. At this point, H* contains horizontal and vertical contextual information, after which H* is inputted again into the cross-attention module to output the feature map H**. The other branch is to keep the output features unchanged. Afterwards, the features of the two branches are fused together to obtain global contextual information. Secondly, to address the lack of inference capability for bolt and its defect detection, a location relationship inference module is added after the model generates the box of interest. The main approach is to take the bounding box of the candidate region as input, learn the spatial discrepancy of the region as the edge of the region node, then output the location relationship knowledge to enhance the location features, and finally connect the location features with the region features for regression classification process to obtain the final detection results.
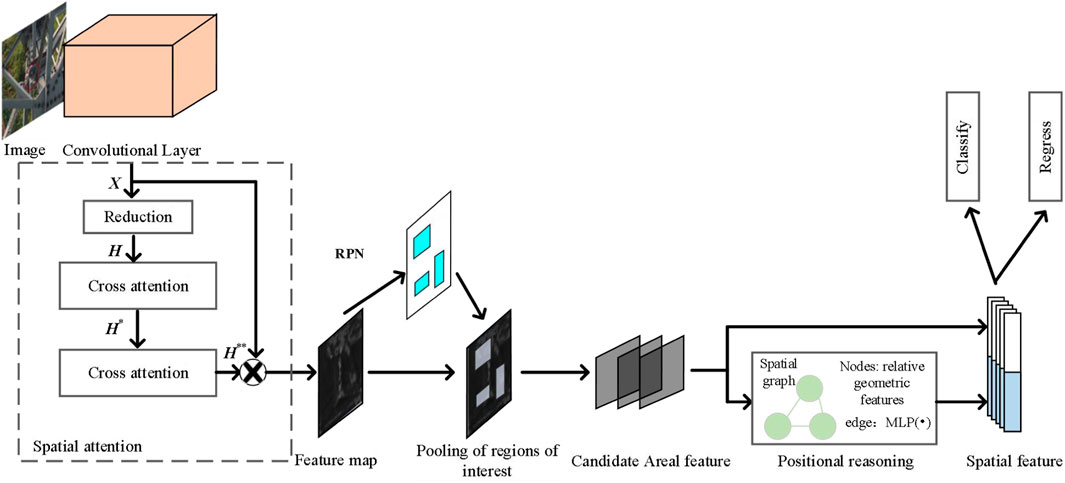
FIGURE 4. Overall block diagram of the bolt and its defect detection model.
3.1 Spatial attention
Bolts as a large number of fixed connection components in the transmission line, their distribution exists in a certain pattern, especially in the bolts on specific fixtures, the location of the bolts is more basically fixed. The original Faster R-CNN only focuses on the local area of the image when detecting, without considering the spatial pattern of the transmission line bolt distribution. Moreover, UAV aerial photographs the transmission line bolt maps will be affected by lighting, equipment jitter and other factors. This is not conducive to obtaining a finer feature map in the convolution layer. Therefore, this paper adds spatial attention after the convolutional layer, and by introducing the cross-attention module twice, it helps the detection model to obtain contextual information of the whole image, capture global dependencies, and regions with similar features enhance each other, making the bolts stand out in the full field of view and helping the convolutional layer to obtain a feature map with more obvious features.
In order to help the model obtain global contextual information, this paper introduces the Recurrent Criss-Cross Attention (RCCA) module (Huang et al., 2019) to help feature enhancement of regional features with similar characteristics in a more efficient way. In this paper, we choose the Spatial Attention module, which works as shown in Figure 5 and is composed by two cross-cross attentions, as a simple and efficient way to perform feature enhancement.
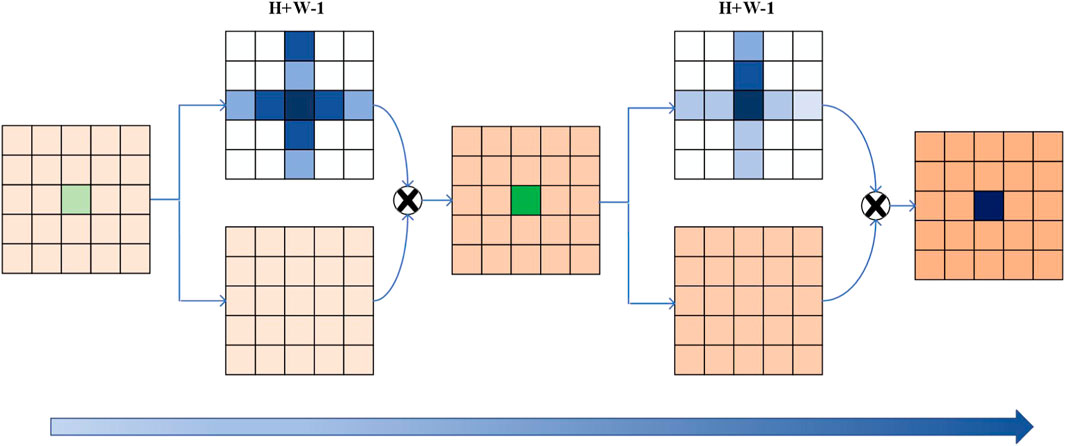
FIGURE 5. Spatial attention module.
Firstly, local features are transmitted through a cross attention module to collect contextual information in both horizontal and vertical directions. Then, by inputting the feature map generated by the first cross attention module into another module, the additional contextual information obtained from the cross path ultimately enables each pixel to capture the full image dependency relationship.
The structure diagram of the cross-attention module is shown in Figure 6. The input feature map is
where
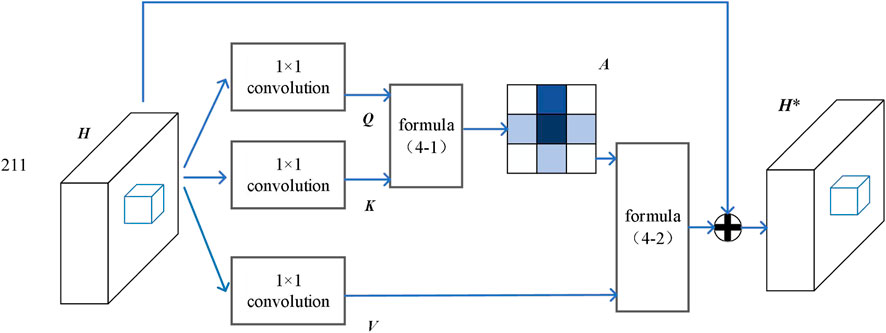
FIGURE 6. Structure of the cross-attention model.
The other branch V is obtained by 1*1 convolution
where
3.2 Positional reasoning
Bolts on transmission line coupling plates generally have a fixed position, geometrically in a triangle, and existing target detection models are only for individual targets, with little attention paid to the positional geometric relationships between targets. In this paper, we choose a positional relationship inference module to improve the detection accuracy of the model by using the fixed position information of the bolts on the coupling plates. This is done by using the feature
First, the location features
where a () indicates the difference between the two regions.
By stacking M MLPs to obtain M location-relative area maps, the edge values of the M location-relative area maps are accumulated and averaged, and they are summed with the unit matrix I to obtain the edge connections:
Afterwards, the location and area features are connected using matrix multiplication to obtain the enhanced features
where
4 Experimental design and result analysis
In this paper, the State Grid’s “Specification for Image Labeling of Defects in Overhead Transmission Line Equipment (Trial)” and the PASCAL VOC (Everingham et al., 2010) dataset construction method are referred to when constructing the dataset, and the data are annotated in strict accordance with the annotation specification. The dataset is mainly based on a large number of inspection images obtained by UAV inspection with image acquisition equipment, and the inspection image library is filtered and optimized according to manual empirical knowledge, using the joint board target as the main target, providing important data support for the construction of the bolt and its defect detection database.
This paper uses the widely used Precision (P), Recall (R), Intersection over Union (IoU), Average Precision (AP) and mean Average Precision (mAP) in the field of object detection as an evaluation indicator for the accuracy of bolts and their defective targets.
P, R, and IoU are defined in Eqs 6–8 respectively. APti is the accuracy of the target in category i at an IoU threshold of t, and is defined in Eq. 9 as the value of the area bounded by the Precision-Recall (PR) curve and the coordinate axis. The final mAP is the average of the accuracies of all classes at 10 different IoU thresholds and is used to assess the overall accuracy of the model, which is defined in Eq. 10.
where TP denotes correct positive samples, FP denotes incorrect positive samples, TN denotes correct negative samples, FN denotes incorrect negative samples, Spre denotes detection results, Sgt denotes actual results, i denotes the ith category of bolts or defects, t denotes the threshold of IoU, and C denotes the total number of all categories.
In this paper, transmission line bolts and their defective datasets are selected for experimentation, containing three categories of the normal bolt, pin losing and nut losing, with the specific number of labels for each category shown in Figure 7, with a total of 340 images. It can be seen that the transmission line bolts and their defects dataset constructed in this paper has fewer defective samples and more normal samples, showing a serious long-tail distribution, which is in line with the current general status quo of more normal samples and fewer defective samples for transmission line bolt components.

FIGURE 7. Transmission line bolts and their defect data set categories.
4.1 Comparative experiment on improvement methods
In order to verify the effectiveness of the method in this paper, experiments were carried out using Faster R-CNN as the baseline model and ResNet-101 as the backbone network. The commonly used evaluation metrics in target detection models, mAP, as well as AP, were selected to evaluate the model. The detection results before and after adding the spatial attention module and position relation inference are shown in Table 1. It can be seen that the detection of bolts and their defects by the method in this paper is significantly better than the traditional Faster R-CNN detection model, which does not consider the spatial context information in the detection of bolts and their defects, and only detects the bolts themselves without inference capability The original Faster R-CNN detection model does not consider the spatial context information in the detection of bolts and their defects. Therefore, this paper adds a spatial attention module and a position relationship inference module to the Faster R-CNN detection model. The improved model improves the mAP by 6.61%, which significantly improves the detection accuracy of the model for transmission line bolts and their defect dataset, which shows the superiority of the proposed improvement.
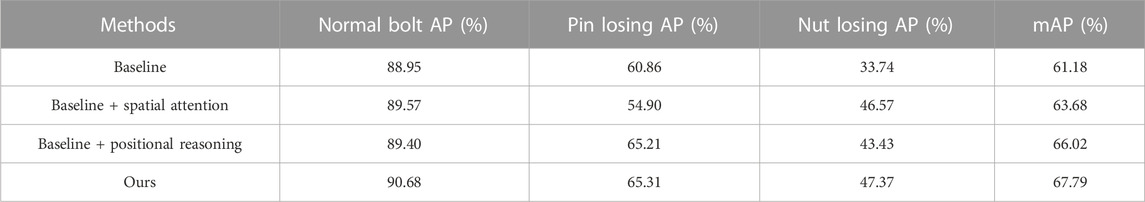
TABLE 1. Ablation experiment.
Table 1 also gives the results of AP values for the baseline model with Faster R-CNN as the detection model and ResNet-101 as the backbone network, the baseline model with spatial attention added, the baseline model with positional relationship inference added, and the method in this paper. It can be seen that adding spatial attention to the baseline model can effectively enhance the label features, especially for the nut losing feature which is difficult to be detected by the baseline model, the feature enhancement effect of spatial attention is obvious, and the AP value of nut losing is improved by 12.83%.
The addition of the location relationship inference module to the baseline model can also effectively improve the detection effect of the model. Especially for the pin losing and nut losing with a small number of labels, the AP values increased by 4.35% and 9.69% respectively. This indicates that the location relationship inference module can effectively exploit the location relationship between bolts. This improves the detection capability of the model, alleviates the long tail effect of the dataset and helps improve the detection accuracy of targets with fewer labels. Finally, the baseline model with Faster R-CNN as the detection model and ResNet-101 as the backbone network is added to the proposed method with the spatial attention module and the position relationship inference module respectively. It can be seen that, on top of the baseline detection model, the AP values of the three types of tags, namely, normal bolt, pin losing and nut losing, increase in this paper method, where the baseline detection The nut losing, which has a lower accuracy, has increased by 13.63% and the mAP has increased by 6.61%.
It can be seen that the location relationship-based transmission line bolt and its defect detection algorithm proposed in this paper are very effective in detecting the state of the bolt. The spatial attention module is used to effectively extract global context information and capture global dependencies, which can effectively help the model extract finer and more comprehensive features. The location relationship inference module is used to add detection box location information to the detection model, which gives the model certain inference capabilities. This method enables the model to use tags with good detection effects and numerous tags, helping to improve detection accuracy for tags with poor detection effects and a small number of tags. Through the above methods, the overall detection ability of the model is improved. In addition, this paper also adds spatial attention and location relationship inference modules to the Faster R-CNN detection model with VGG16 as the backbone network, and the experimental results are shown in Table 2. The results show that the detection effect of the model with VGG16 as the backbone network is significantly worse than that of the model with ResNet-101 as the backbone network. This is because VGG16 performs poorly in feature extraction in the detection of transmission line bolts and their defects, and is unable to extract fine image features for the bolts and their defects. Therefore, the spatial attention module of the method in this paper effectively helps the feature extraction network to perform feature enhancement. When the Faster R-CNN detection model replaces the backbone network, the improvements in this paper can still help the Faster R-CNN detection model to improve its detection capability, especially for the defect samples with few samples and difficult labels to identify, the improvements in this paper can significantly improve its detection accuracy, for example, the AP value of pin losing in this dataset, For example, the AP value of pin losing in this dataset increased by 8.62%, the AP value of nut losing increased by 48.45%, and the total mAP increased by 18.83%.
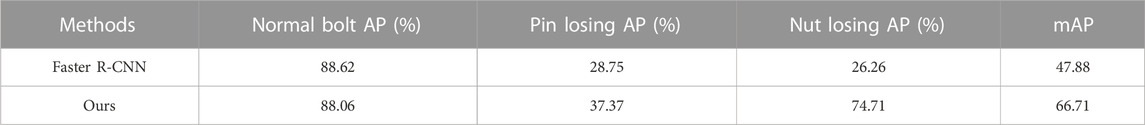
TABLE 2. Model detection results before and after improvement of the backbone network for VGG16.
4.2 Comparative experiment between this method and other methods
In order to further verify the effectiveness of the proposed method for detecting bolts and their defects, experiments were conducted to compare the proposed method with state-of-the-art target detection methods on the same dataset of fixtures, and the methods conducted for comparison included RetinaNet (Lin et al., 2020), Faster R-CNN, Cascade R-CNN (Cai and Vasconcelos, 2018), and Sparse R-CNN (Sun et al., 2021). As shown in Table 3, the experimental results show that the method in this paper has a higher accuracy for target detection of bolts and their defect datasets.
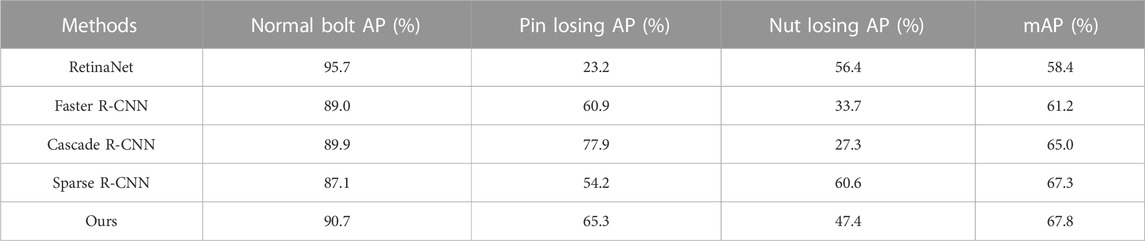
TABLE 3. Multiple model detection accuracy.
Table 3 presents several comparative methods, and without considering the computational effort, this method has a significant improvement in accuracy compared to other detection methods, with the mAP of 67.8%. In Table 3, the accuracy of this method is 9.4% higher than that of the single-stage detection method RetinaNet, 6.6% higher than that of the two-stage detection method Faster R-CNN, 2.8% higher than that of the multi-stage detection method Cascade R-CNN, and 0.5% higher than that of Sparse R-CNN, so this method The performance of this paper is better than other detection methods to a certain extent. The experimental data in Table 3 demonstrates that the detection accuracy of this method is generally higher than that of the comparative detection methods and has some practical value.
As shown in Figure 8, several sets of images of the detection results of bolts and their defects on the coupling plate from different shooting angles. Among them, (A), (C), (E), and (G) are the baseline detection results, and (B), (D), (F), and (H) are the detection results of the proposed method. There are four sets of test results in total. In the first set of results, the detection accuracy of both normal bolt and pin losing increased, and the confidence of individual labels increased up to 3.5%. Moreover, the detection frame of each label in this paper fits the label better. In the second set of detection results, the Faster R-CNN detection model failed to detect the difficult samples in the lower left corner, while the proposed method detected the normal bolts in the lower left corner. This is because the spatial attention module added in this article can effectively assist the model in detection, so that smaller targets will not miss detection. In the third set of detection results, both Faster R-CNN and the proposed method detected three labels, but the confidence level of each detection frame of the proposed method is higher, which indicates that the proposed method has a better detection ability. In the fourth set of detection results, the tail of the bolt appears in the Faster R-CNN detection image. While in the actual annotation process, the tail of the bolt is not involved in the annotation. However, Faster R-CNN incorrectly detects the tail of the bolt as a losing pin bolt, and the proposed method successfully avoids such misjudgment.
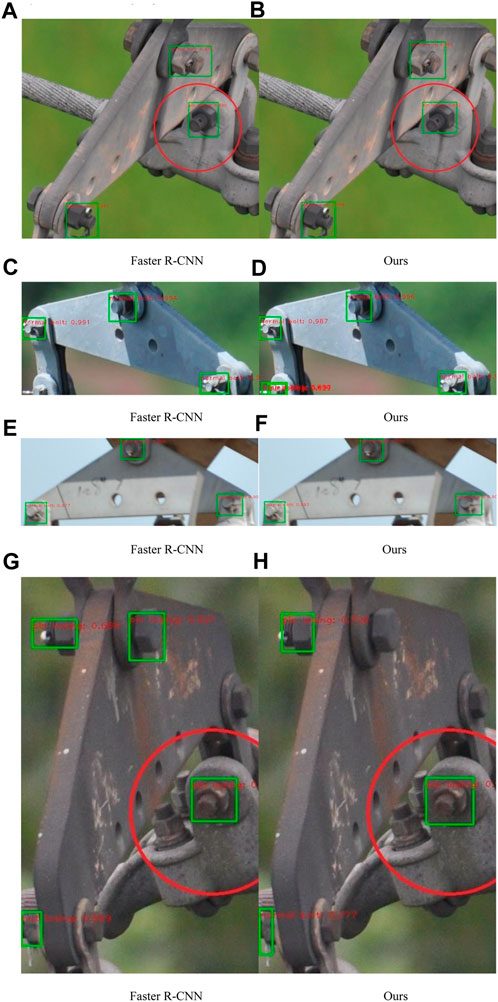
FIGURE 8. Comparison of bolts defect detection results between Faster R-CNN and the proposed method (A) Faster R-CNN (B) Ours (C) Faster R-CNN (D) Ours (E) Faster R-CNN (F) Ours (G) Faster R-CNN (H) Ours.
5 Conclusion
In order to accurately detect transmission line bolts and their defects, this paper uses a joint board to construct a dataset of bolts and their defects, and further conducts the detection of normal bolts, pin losing and nut losing on the fixture. To address these problems of small bolt targets, low image resolution and lack of inference capability of the detection model, a Faster R-CNN detection model based on location relationship inference is used for experimental validation on the self-built dataset. It is demonstrated that adding a spatial attention module after the feature extraction network can effectively help the model enhance the global context information and improve the feature extraction ability of the model; adding a location relationship inference module after the region suggestion can increase the inference ability of the model, help the dataset alleviate the long-tail effect and improve the AP value of the category with a small number of labels. 6.61%, effectively improving the accuracy of bolt and its defect detection, and laying a good foundation for the task of transmission line bolt and its defect detection.
Data availability statement
The original contributions presented in the study are included in the article/supplementary materials, further inquiries can be directed to the corresponding author.
Author contributions
ZZ: Conceptualization, Data curation, Funding acquisition, Investigation, Project administration, Resources, Supervision, Writing–review and editing. JX: Conceptualization, Methodology, Validation, Visualization, Writing–original draft. YH: Writing–original draft, Writing–review and editing. SM: Supervision, Writing–review and editing.
Funding
The author(s) declare financial support was received for the research, authorship, and/or publication of this article. This research is supported by the National Natural Science Foundation of China (61871182, U21A20486); Supported by Natural Science Foundation of Hebei Province (F2020502009, F2021502008, F20211502013); Supported by the Fundamental Research Funds for the Central Universities (2023JC006).
Acknowledgments
Heartfelt thanks to everyone who contributed to this paper.
Conflict of interest
The authors declare that the research was conducted in the absence of any commercial or financial relationships that could be construed as a potential conflict of interest.
Publisher’s note
All claims expressed in this article are solely those of the authors and do not necessarily represent those of their affiliated organizations, or those of the publisher, the editors and the reviewers. Any product that may be evaluated in this article, or claim that may be made by its manufacturer, is not guaranteed or endorsed by the publisher.
References
Cai, Z., and Vasconcelos, N. (June 2018). “Cascade R-CNN: delving into high quality object detection,” in Proceedings of the IEEE/CVF conference on computer vision and pattern recognition (Salt Lake City, UT, USA, 6154–6162. doi:10.48550/arXiv.1712.00726
Everingham, M., Gool, V., Williams, C., Winn, J., and Zisserman, A. (2010). The pascal visual object classes (voc) challenge. Int. J. Comput. Vis. 88 (2), 303–338. doi:10.1007/s11263-009-0275-4
Feng, M., Luo, W., Yu, L., Zhang, P., Hao, X., Fan, Q., et al. (2018). A bolt detection method for pictures captured from an unmanned aerial vehicle in power transmission line inspection. J. Electr. Power Sci. Technol. 33 (4), 135–140. doi:10.3969/j.issn.1673-9140.2018.04.019
Fu, Q., Liu, J., Zhang, X., Zhang, Y., Ou, Y., Jiao, R., et al. (2023). A small-sized defect detection method for Overhead transmission lines based on convolutional neural networks. IEEE Trans. Instrum. Meas. 72, 1–12. doi:10.1109/TIM.2023.3298424
Ge, W., Luo, H., Zhou, G., Fan, B., and Ma, Y. (June 2017). “The application of internet of things technology in power transmission line condition monitoring system,” in Proceedings of the International conference on fuzzy systems and data mining (Hualien, Taiwan: IOS Press BV), 485–493. doi:10.3233/978-1-61499-828-0-485
Gong, Y., Zhou, W., Wang, K., Wang, J., Wang, R., Deng, H., Liu, G., et al. (2023). Defect detection of small cotter pins in electric power transmission system from UAV images using deep learning techniques. Electr. Eng. 105, 1251–1266. doi:10.1007/s00202-022-01729-8
Hu, H., Gu, J., Zhang, Z., Dai, J., and Wei, Y. (June 2018). “Relation networks for object detection,” in Proceedings of the IEEE/CVF conference on computer vision and pattern recognition (Salt Lake City, UT, USA: IEEE), 3588–3597. doi:10.48550/arXiv.1711.11575
Huang, Z., Wang, X., Wei, Y., Huang, L., Shi, H., Liu, W., et al. (2019). CCnet: criss-cross attention for semantic segmentation. IEEE/CVF Int. Conf. Comput. Vis. Seoul, South Korea 45 (6), 6896–6908. doi:10.1109/TPAMI.2020.3007032
Lin, T., Goyal, P., Girshick, R., He, K., and Dollár, P. (2020). Focal loss for dense object detection. IEEE Trans. Pattern Analysis Mach. Intell. 42 (2), 318–327. doi:10.1109/tpami.2018.2858826
Liu, W., Anguelov, D., Erhan, D., Szegedy, C., Reed, S., and Fu, C. (2016). “Ssd: single shot multibox detector,” in European conference on computer vision (Amsterdam, Netherlands: Springer), 21–37. doi:10.1007/978-3-319-46448-0_2
Luo, P., Wang, B., Wang, H., Ma, F., Ma, H., and Wang, L. (2023). An ultrasmall bolt defect detection method for transmission line inspection. IEEE Trans. Instrum. Meas. 72, 1–12. doi:10.1109/TIM.2023.3241994
Qi, Y., Wu, X., Zhao, Z., Shi, B., and Nie, L. (2021). Bolt defect detection for aerial transmission lines using Faster R-CNN with an embedded dual attention mechanism. J. Image Graph. 26 (11), 2594–2604. doi:10.11834/jig.200793
Redmon, J., Divvala, S., Girshick, R., and Farhadi, A. (2016). “You only look once: unified, real-time object detection,” in IEEE conference on computer vision and pattern recognition (Las Vegas, NV, USA), IEEE, 779–788.
Ren, S., He, K., Girshick, R., and Sun, J. (2017). Faster R-CNN: towards real-time object detection with region proposal networks. IEEE Trans. Pattern Analysis Mach. Intell. 39 (06), 1137–1149. doi:10.1109/TPAMI.2016.2577031
Sheng, G., Qian, Y., Luo, L., Song, H., Liu, Y., and Jiang, X. (2021). Key technologies and application prospects for operation and maintenance of power equipment in new type power system. High. Volt. Eng. 47 (9), 3072–3084. doi:10.13336/j.1003-6520.hve.20211258
Sun, P., Zhang, R., Jiang, Y., Kong, T., Xu, C., Zhan, W., et al. (June 2021). “Sparse R-CNN: end-to-end object detection with learnable proposals,” in Proceedings of the IEEE/CVF conference on computer vision and pattern recognition (Nashville, TN, USA, 14449–14458. doi:10.1109/CVPR46437.2021.01422
Zhang, S., Wang, H., Dong, X., Li, Y., Li, Y., and Wang, X. (2021). Bolt detection technology of transmission lines based on deep learning. Power Syst. Technol. 45 (7), 2821–2829. doi:10.13335/j.1000-3673.pst.2020.1336
Zhao, Z., and Ding, J. (2022). Weakly supervised detection method for pin-missing bolt of transmission line based on Improved PCL model. Sci. Technol. Eng. 22 (23), 10169–10178. doi:10.3969/j.issn.1671-1815.2022.23.035
Zhao, Z., Jin, C., Qi, Y., Zhang, K., and Kong, Y. (2021). Image classification of transmission line bolt defects based on dynamic supervision knowledge distillation. High. Volt. Eng. 47 (2), 406–414. doi:10.13336/j.1003-6520.hve.20200834
Zhao, Z., Qi, H., Qi, Y., Zhang, K., and Zhao, W. (2020). Detection method based on automatic visual shape clustering for pin-missing defect in transmission lines. IEEE Trans. Instrum. Meas. 69 (9), 6080–6091. doi:10.1109/TIM.2020.2969057
Keywords: transmission line bolts, bolts defects, target detection, attention mechanism, positional relationship
Citation: Zhao Z, Xiong J, Han Y and Miao S (2023) Transmission line bolts and their defects detection method based on position relationship. Front. Energy Res. 11:1269087. doi: 10.3389/fenrg.2023.1269087
Received: 29 July 2023; Accepted: 05 September 2023;
Published: 14 September 2023.
Edited by:
Fuqi Ma, Xi’an University of Technology, ChinaReviewed by:
Shuaiqi Liu, Hebei University, ChinaTadachika Ozono, Nagoya Institute of Technology, Japan
Xian Tao, Chinese Academy of Sciences (CAS), China
Copyright © 2023 Zhao, Xiong, Han and Miao. This is an open-access article distributed under the terms of the Creative Commons Attribution License (CC BY). The use, distribution or reproduction in other forums is permitted, provided the original author(s) and the copyright owner(s) are credited and that the original publication in this journal is cited, in accordance with accepted academic practice. No use, distribution or reproduction is permitted which does not comply with these terms.
*Correspondence: Siyu Miao, c2l5dW1pYW9faGJ1QDE2My5jb20=