 Hui Wang
 Xu Liao1,2
- 1School of Electrical Engineering and Information Technology, Changchun Institute of Technology, Changchun, China
- 2National and Local Joint Engineering Research Center for Smart Distribution Network Measurement, Control and Safe Operation Technology, Changchun, China
- 3State Grid JILIN Electric Power Research Institute, Changchun, China
With the continuous infusion of renewable energy sources, smart buildings have evolved from single-load characteristics into dual characteristics with both electric energy production and consumption capability. Concurrently, the peak and off-peak periods of electricity consumption are influenced by climatic factors, which leads to complexity and deviation from the time-of-use tariffs set by electricity markets, which consequently result in a loss of revenue from grid-based electricity sales. Thus, adopting an innovative pricing mechanism to offset the revenue deficit in the grid assumes paramount significance. Built upon a dual-layer framework that employs intelligent optimization algorithms, this study proposes a pricing strategy for introducing the retail electricity provider into smart building clusters with peer-to-peer power sharing as the core. First, the independent operation model of intelligent buildings and electric energy sharing model without the participation of retail power suppliers are respectively established. Subsequently, with the aim to minimize alliance costs, a novel energy sharing pricing model involving retail electricity suppliers is developed, and a combination of particle swarm optimization and alternating direction multiplier methods is used for distributed solutions within a representative model. This approach yields optimal energy sharing transaction volumes and pricing while ensuring the confidentiality of each participating entity. Lastly, from the perspectives of the power grid, retail electricity suppliers, and multi-building smart alliances, this study conducts simulation analyses of key parameters that influence the bargaining effectiveness of retail electricity suppliers. These parameters encompass the upper limit of pricing, market supervision coefficient, and discount coefficient associated with the grid-based electricity sales to suppliers. Through these analyses, the study further validates the efficacy of the proposed strategy.
1 Introduction
In recent years, the escalating concerns surrounding global warming and depletion of fossil energy reserves have garnered widespread attention. As a result, countries across the globe are steadfastly committed to advancing low-carbon economic practices. Within this context, addressing the escalating energy demands within China becomes pivotal, and this necessitates a robust exploration of renewable energy systems (Zhao et al., 2023). Consequently, smart buildings (SBs) with both electric energy production and consumption capability have emerged (Li et al., 2020). On the one hand, a single SB is usually composed of distributed photovoltaics; cogeneration of cooling, heating, and power; energy storage; and electricity/heating/cooling loads and can realize energy interaction with the outside world through the distribution network, the medium- and low-voltage gas distribution networks (Mofidi and Akbari, 2020). Moreover, the integration of multiple smart buildings can foster a smart building cluster system through energy interconnection. This collaborative framework empowers all SB participants to engage in peer-to-peer (P2P) power trading, effectively harmonizing power supply and demand dynamics, and thereby reducing reliance on the power grid (Liu et al., 2021; Zhou et al., 2021). The realization of such power sharing mechanisms bears immense significance in bolstering grid electricity sales revenue.
However, the daily net load profile of SBs often diverges from the temporal trend of time-of-use tariff prevalent in the broader power market, which culminates in a reduction in grid revenue. Both domestic and international research have diligently examined P2P power sharing within the smart building cluster paradigm (Singh and Baredar, 2017; Hu et al., 2019). Notably, efforts have been directed toward devising a Nash game model that orchestrates power trade negotiations among key stakeholders, encompassing wind, solar, and hydrogen subjects. Prior investigations have successfully employed the augmented Lagrangian multiplier method to optimize power sharing transaction volumes, characterized by their model simplicity and robust convergence (Ma et al., 2021). Further contributions have extended the P2P energy sharing model to an n-agent cooperation framework, broadening the versatility of the model (Wu et al., 2022).
Nonetheless, the inherent variability in photovoltaic power generation, intricacies of privacy preservation during P2P energy transactions, and self-interested pursuit of the lowest operating costs by SBs collectively exacerbate the challenges faced by the local power grid (LPG) in orchestrating efficient SB scheduling (Yang et al., 2018). To mitigate these complexities, the power grid urgently requires accurate predictions of the internal random source load of SBs and the judicious scheduling of SBs, so as to set the time-of-use price properly.
In the context of a conventional distribution network structure, the power grid exerts direct control over the pricing of power acquisition for lower-level buildings through the implementation of time-of-use electricity rates. This has led to concerns regarding the potential economic losses stemming from the increasing integration of renewable energy sources (Simkhada et al., 2022). As a result, there has been a growing interest in exploring the potential of introducing a retail electricity provider (REP) as an intermediary to manage this complex and contentious task on behalf of the grid. Literature pertaining to the introduction of REP highlights certain strategies to mitigate passive deceleration of the REP’s operations. Notably, the REP is established as an autonomous profit-generating entity, distinct from the local power grid (LPG), and is responsible for precise forecasting within the intricate lower-level energy system and a comprehensive exploration of the SB energy scheduling methodology (Wang et al., 2018; Xu et al., 2020). An optimized time-of-use electricity pricing scheme is formulated to promote the orderly transfer of flexible loads in the lower-level SB through the market mechanism, so as to meet the requirements of the upper-level power grid for peak shaving and valley filling and maximize its own operating benefits (Zhang et al., 2019). Within the realm of literature, a REP pricing model characterized by market oversight and user satisfaction considerations is proposed (Zhou et al., 2017; Immonen et al., 2020; Zhu et al., 2021). In this framework, each time the REP establishes an electricity price, the lower-level SB invariably seeks a scheduling plan that minimizes its individual operational costs at that specific electricity price. This approach facilitates the provision of a commodity demand for purchasing power vectors to the REP. Conceptually, this model, in taking the REP as a “wholesale-retail” role, seeks for a daily profit maximization model, which can be specifically depicted as “(wholesale price − retail price) * electric power vector and accumulation.” It is worth noting that solving this model entails addressing a non-trivial max–min non-linear problem, characterized by the intricate interaction between the electricity price variables and power variables, leading to computational intricacies (Zhang et al., 2021). Weishang et al. (2022) introduced a two-layer non-linear strategy grounded in the game theory for optimizing REP pricing, which effectively addresses the optimal pricing puzzle for individual SB. Moreover, Wang et al. (2023) illustrated that the double-layer max–min optimal pricing problem in between a single SB subject, REP, and the grid can be solved maturely through the strong duality theory and KKT condition theory. Nevertheless, notable gaps persist within the present body of research concerning the double-layer max–min optimal pricing problems that involve REPs, grid, and building clusters composed of numerous SB entities.
Addressing the inherent challenges within multi-smart building electricity price management, the power grid faces two unresolved issues: 1) as the prevalence of mixed renewable energy access rises, the P2P power sharing interaction costs may experience an upward trajectory, resulting in a limited total investment cost of the system. 2) The utilization of conventional optimization solvers to determine electricity transaction volumes per building raises concerns about user privacy. Moreover, the conventional grid’s electricity sales model fails to adequately account for the nuanced interests of lower-level user buildings, resulting in price conflicts.
To address these problems, this study introduces an optimal pricing strategy for REP in the context of SB clusters. Specifically, the layer particle swarm algorithm is employed on the upper layer to derive electricity price variables, while the alternating direction multiplier method (ADMM) is utilized on the lower level to allocate P2P power transaction volumes, thereby safeguarding the privacy of each participant. This dual-layer methodology not only enhances solution efficiency but also bolsters power grid revenue and reduces the system’s overall operational costs. The primary contributions of this study encompass the following:
1) Strengthening power interaction: by constructing a SB clusters power sharing model, the study augments power interactions among various buildings, thereby augmenting the assimilative capacity of wind and photovoltaic power sources.
2) Coordinated electricity pricing: the introduction of REP facilitates the harmonization of electricity prices between the upper-level power grid and lower-level buildings. In this process, the REP garners a portion of revenue while optimizing power grid sales income.
3) Enhanced solution methodology: a dual-layer solution methodology, integrating particle swarm optimization and the ADMM, is proposed. This approach ensures individual privacy while substantially expediting solution convergence.
The subsequent sections of this article are organized as follows: Section 2 builds the framework of P2P power sharing grid–operator–SB clusters; Section 3 presents an independent SB operation model; Section 4 establishes building clusters P2P power sharing model; case analysis and conclusions are shown in Section 5 and Section 6, respectively; and the overall workflow.
2 Framework of SB power sharing and REP bargaining
This section intricately models the three distinct tiers: LPG, REP, and SB clusters, ensuring a robust safeguarding of internal equipment configuration and energy flows for each participant during the implementation of P2P transactions.
The upper-level LPG assumes the role of supplying external power support, thus fostering an equilibrium within the SB’s power system. At the middle level, REP, as a “wholesale-retail” intermediary, is responsible for setting the optimal electricity price and influencing SBs flexible load shift through market mechanisms (Wei and Lin, 2017; Schneiders et al., 2022), which alleviates the impact of LPG on SBS peak shaving pressure. The set electricity price by the REP is intricately calibrated within the bounds of market constraints, with a diligent pursuit of self-interest driving its determination. Situated at the lower tier, the SBs comprise multiple building entities. Each entity not only encompasses diverse energy production and consumption capabilities—ranging from electricity and heat to cold, gas, and carbon dioxide—but also boasts autonomous dispatching, independent management, and individual operators vested with the authority to trade in electricity. The overall operation framework is presented in Figure 1.
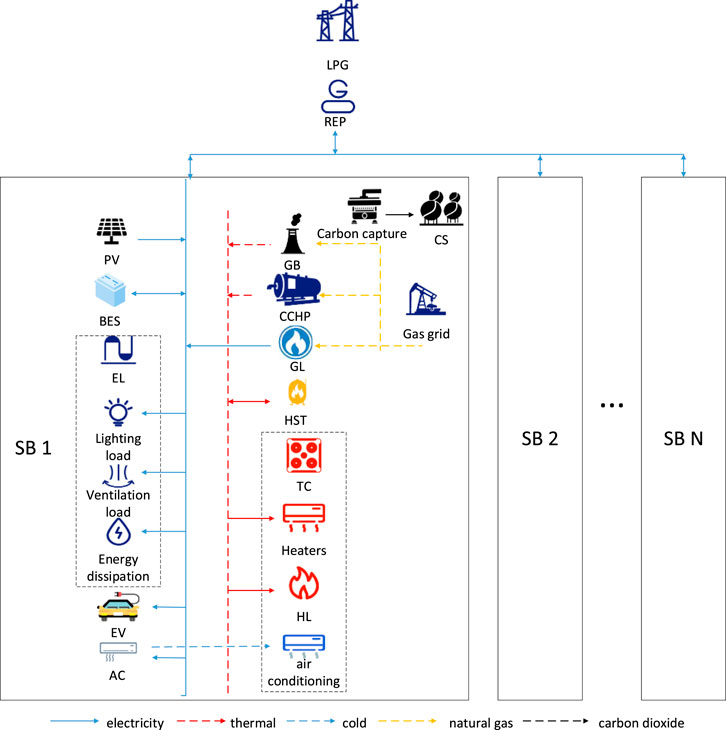
FIGURE 1. Power sharing framework of grid–REP–SBs.
3 SB isolated operating model
In this section, the mathematical models, operational constraints, and minimum operating cost objective functions of key constituent devices in SBs are modeled. The lowest cost dispatch model for SBs under REP time-of-use tariff is mainly based on the SB isolated operation model without considering P2P, and then extends the SB alliance P2P power sharing model based on the ADMM. In addition, each smart building can dispatch autonomously with the goal of its own cost minimization and externally interacts only with the gas and electricity distribution networks.
3.1 Mathematical modeling of major equipment in SBs
Each isolated SB encompasses a diverse array of devices, exemplified in Figure 1. In this section, we only conduct detailed modeling of the three key equipment types, namely, the flue gas diversion carbon capture system, energy storage system, and temperature control system (Wang et al., 2018). The distributed photovoltaic model is presented in the works of Zhang et al. (2019). The electric heating demand response model is expounded upon in the literature of Rahman et al. (2021), while insights into the electric vehicle load model can be gleaned from the studies conducted by Ge et al. (2022). The coupling characteristics of the gas turbine electric heating system are meticulously documented in the literature authored by Wang et al. (2020).
3.1.1 Modeling of carbon capture systems for flue gas splitting
The carbon emissions of gas boilers and CCHP units are positively correlated with their thermal power output.
where
With the aim of advancing the attainment of the “carbon peaking, carbon neutrality” objective and mitigating erratic carbon emissions, an increasing number of SBs have embraced the integration of carbon capture devices subsequent to flue gas diversion. This strategic adoption facilitates the effective capture, storage, and controlled concentration of CO2.
where ϖ denotes the flue gas split ratio and ε denotes the carbon capture efficiency.
3.1.2 Energy storage system model
In this section, a comprehensive model is constructed, encompassing diverse energy storage mechanisms within SBs, spanning electricity, heat, and CO2. These energy storage devices facilitate temporal energy displacement, effectively fostering dynamic power equilibrium adjustments. The energy storage model encompasses several key facets, which include energy storage and release power constraints, operational state uniqueness constraints, power–capacity coupling, capacity limitations, initial and final energy parity, and constraints on state transitions.
where
3.1.3 Temperature control system model
As one of the main loads of SBs, the temperature control load is mainly used in pipeline heating or central air-conditioning refrigeration, etc., to control the temperature in order to achieve a satisfactory temperature felt by the human body. The indoor temperature fluctuation in building i is fundamentally contingent upon a linear interplay involving equipment heating and cooling power, as well as the disparity between indoor and outdoor temperatures.
where
3.2 Operational constraints model
In this section, only equipment power constraints, gas turbine climb constraints and start–stop constraints, demand-side response constraints, and multiple energy flow balance constraints are modeled.
3.2.1 Device power constraints
where
3.2.2 Gas turbine climbing constraints and start–stop constraints
where
3.2.3 Demand-side response constraints
where
3.2.4 Multi-energy flow balance constraints
Smart buildings contain various energy flows such as electricity, heat, cold, natural gas, and carbon dioxide. Their power balance constraints are as follows:
where
where
where
3.3 Minimum operating cost objective function model under isolated operation mode
Within this section, the focus lies on formulating the minimal operational cost
where
By employing the aforementioned formula, the minimum operational cost
4 P2P power sharing model within SBs
Within this section, building upon the established framework of isolated operation models for multiple smart buildings, we employ the ADMM to formulate a multi-agent P2P power sharing paradigm within the SB clusters. Specifically, the modeling is carried out from four aspects: the necessary preparations for P2P power sharing among the bodies of SBs, REP bargaining model in the alliance mode, construction of a power sharing model based on the ADMM (with the aim of maximizing alliance benefits), and construction of the energy mapping contribution function to achieve reasonable redistribution of alliance benefits.
4.1 Preparation for introduction of P2P power sharing
To clearly demonstrate the process of electric energy sharing between N smart building bodies,
Given the considerable spatial span between SBs and the utilization of the extensive power grid for transmitting power in P2P transactions, the obligation to pay network connection fees arises. Consequently, this study establishes distinct unit costs for P2P power interactions based on varying spatial distances between SBs. This approach not only facilitates a more gradual and organized power interaction gradient between SBs but also enhances the convergence of the calculation example toward a singular solution. The transmission cost of electrical energy interaction between SB i and SB j can be calculated as follows:
where
4.2 REP bargaining model under SB model
Expanding upon the previously discussed introduction of P2P dynamics, the subsequent integration of REP serves to harmonize the vested interests between the upper-level power grid and users, mitigating the discord that may arise between the users and power grid owing to electricity pricing matters. Therefore, the forthcoming analysis will delve into a comprehensive modeling approach, examining both constraints and objective functions from a dual perspective.
4.2.1 Constraint modeling
Market monitoring constraints on the tariff mean value limits selected in this section:
where
To ensure an adequate profit margin for the REP, electricity purchasing prices from the market are frequently subject to discounts:
where
The imperative of the REP to collaborate with the grid in demand management is evidenced by the necessity to devise electricity pricing mechanisms that influence the load redistribution within the building clusters. The disparity
where
4.2.2 Objective function modeling
To enhance the profitability of the RE, under this electricity pricing scheme, a strategic approach that involves deducting the electricity procurement cost
Nonetheless, formula (18) exhibits a limitation by neglecting the presence of rooftop photovoltaic systems in SBs, which enables the scenario of electricity sales from the SBs to REP. To enhance the model’s accuracy, an enhancement is introduced whereby the REP procures the electricity price scalar
Then, REP empirically develops an effective time-of-use tariff and analyzes it in comparison with the time-of-use tariff. Specifically, load forecasting has been employed, utilizing the ELMAN neural network, with a detailed reference available in the work of Eskandari et al. (2022). While this aspect is not the central focus of this study and thus will not be reiterated here. It is worth noting that the initial generation of electricity prices can be facilitated by employing algorithms such as deep learning. Such algorithms establish a correlation model between historical electricity prices and power dynamics, as evident in the works by Xie et al. (2023) and Liang et al. (2020). Moreover, a new purchase power variable of SBs can be brought into the model of fuzzy training to obtain the initial electricity price closer to the optimal value, thereby improving the convergence speed of calculation.
4.3 Model for solving subproblem P of lowest SB operation cost
Due to its commendable convergence properties, straightforward formulation, and robustness, the ADMM stands as a suitable tool for resolving optimization challenges featuring variable equality constraints within a distributed framework. Therefore, this study uses the ADMM to solve the subproblem P of the minimum operating cost of the SB cluster, and uses the P2P power interaction in the resultant minimum cost dispatching scheme as the subproblem Q of the SB cluster revenue redistribution to calculate the contribution of each participant degree input parameters.
With the integration of electricity sharing transaction variables across intelligent buildings, the inherent output constraint intervals for each device remain unchanged. However, it is noteworthy that the resultant output values experience dynamic optimization in alignment with the electricity balance equation, influenced by the intricate interplay of energy interactions. After introducing the electricity sharing transaction variable between SBs, the new electricity balance equation of each SB in the system is defined as
After the introduction of power sharing, the minimum operating cost
After the introduction of P2P power sharing, the total operating cost
Then, using the equation constraint
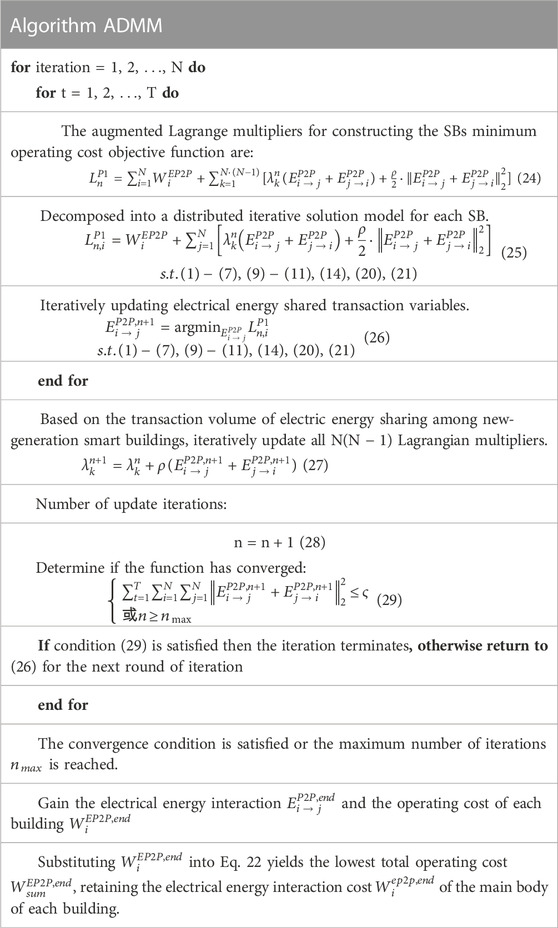
TABLE 1. ADMM solving steps.
Progressively refine the power sharing transaction variables through iterative updates. During each distinct iteration, sequential iterative refinements are executed in accordance with the primary SB bodies' index i, ranging sequentially from 1 to n. Concurrently, the secondary intelligent building index, designated as j, traverses the same range from 1 to n, excluding instances where it equals i. It is noteworthy that electric energy interactions modified in the present evolutionary phase necessitate an update of variable values before their integration into the solution. This iterative process continues until all 2N(N − 1) electric energy interaction variables have been effectively updated.
4.4 Subproblem Q solution model for rational redistribution of SB revenue
Within this section, we delve into the modeling of the revenue redistribution subproblem, denoted as Q, subsequent to the P2P power sharing framework of SBs. This modeling endeavor prominently encompasses three pivotal facets: 1) resolving the cumulative sum of redistributed benefits, thereby comprehensively addressing the overall quantum of benefits to be reallocated; 2) determining the proportional contribution ratios attributed to each individual SB participating in the P2P power sharing network; and 3) redistributing revenue according to the proportion of contribution to achieve benefits for all participants.
First, the total operating cost
Subsequently, the energy mapping contribution function is constructed with reference to the economic knowledge, and the contribution ratio of each SB participating in P2P electric energy sharing is solved according to the electric energy interaction
1) Universality across all SBs partaking in the P2P power sharing network.
2) Predominance of energy supply-side contribution over energy-receiving counterpart.
3) Amplification of unit power sharing transaction contribution during peak demand periods relative to off-peak intervals.
4) Incremental contribution correlation with escalating transaction volume.
5) Convergence to zero contribution when transaction volume becomes null.
6) The contribution is always greater than or equal to 0.
The supplied electric energy
Construct the energy sharing contribution
To further promote energy interaction, the linearly ascending contribution profile can be adeptly translated into an exponential upsurge. Furthermore, a normalization process can be administered to preempt the potential escalation of the power series beyond manageable proportions.
where
Based on the contribution ratios of each SB actively engaged in the P2P power sharing, a judicious and equitable reallocation of revenue is effectuated. The benefit
Then, the cost
Finally, the REP optimal pricing strategy for SB clusters with P2P power sharing has been modeled.
5 Case analysis
In this section, we substitute the same load data into three models with different scheduling strategies, thus forming a control group. Then, a comparative analysis is carried out from the subproblem P of the minimum cost of the building cluster and the subproblem Q of benefit redistribution. Finally, the analysis of the three variables of the electricity price upper limit, market supervision and absorption, and REP’s discount coefficient for power purchases from the grid are, respectively, conducted, which proves the flexibility and necessity of REP’s bargaining and explains the impact on the revenue and costs of the SBs, grid, and REP.
5.1 Framework design of three models of smart buildings
From the perspective of progressive development, this section undertakes a rigorous comparative analysis based on models ①, ②, and ③: model ① is the isolated operation mode of multiple SBs under the large market electricity price, the objective function is Eq. 12, and the constraint conditions are formulas (1–11); model ② is the SB P2P electricity sharing mode under the large market electricity price, its objective function refers to Eq. 19, and the constraints are from formulas (1–7), (9–11), (14), (20–21), and (25–35); and model ③ is an REP bargaining and SB clusters P2P electricity sharing model, its objective function is Eq. 19, and the constraint conditions can be added to the constraints of model ② from formulas (15–17). The specific model comparison is shown in Figure 2.
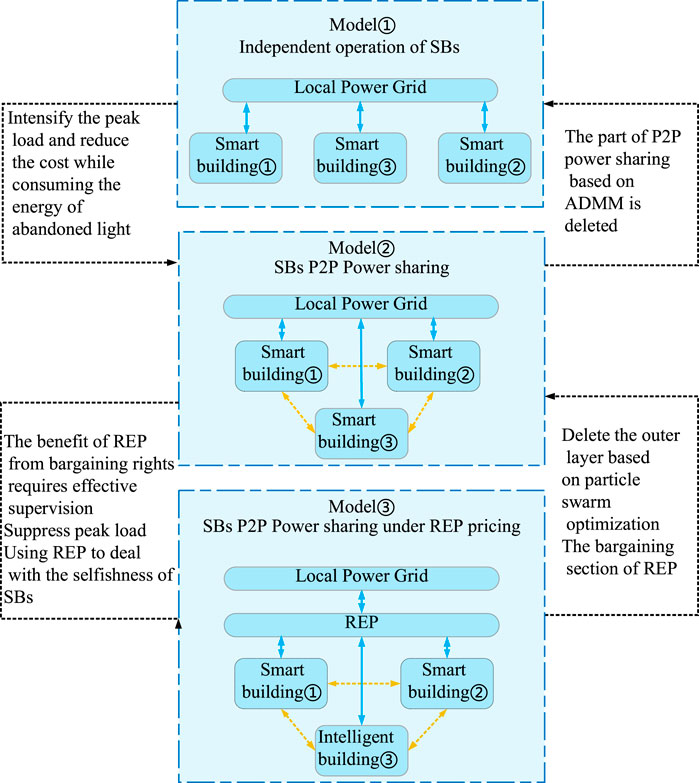
FIGURE 2. Comparison of three smart building operation models.
5.2 Model ③ calculation parameter
In this section, we mainly take the most complete model ③ as the core arithmetic example. The particle swarm optimization (PSO) algorithm is employed on the upper layer. The initial particle swarm is subject to a maximum of 20 iterations, and its population comprises 50 individuals. In Eq. 31, the upper limits of the REP-generated tariffs
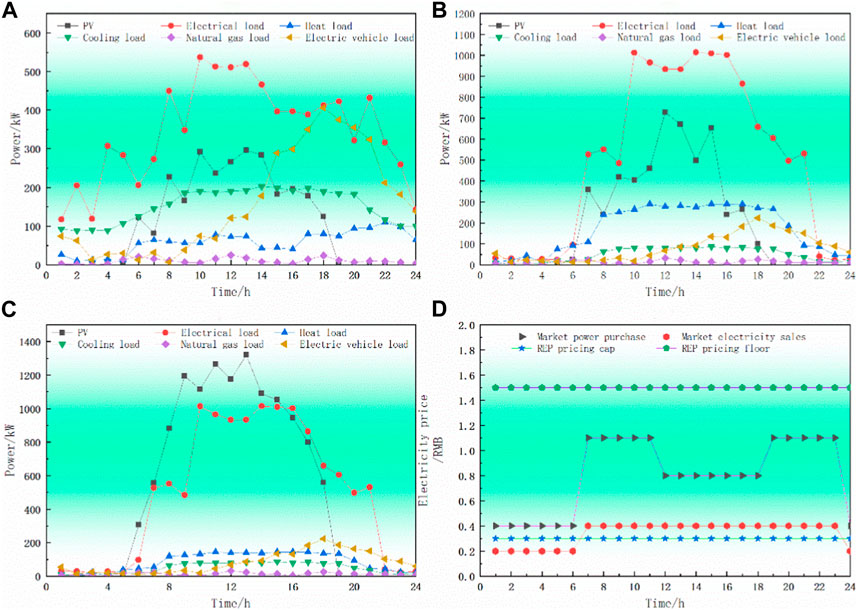
FIGURE 3. Day-ahead prediction curves of photovoltaic and electricity–heat–gas–cooling loads of smart buildings. (A) Smart building ①: residential smart building. (B) Smart building ②: industrial smart building. (C) Smart building ③: business smart building. (D) Electricity price of grid and the upper and lower limits of REP pricing.
5.3 Analysis of results of lowest alliance operation cost subproblem P
This part is conducted within the computational environment provided by an Intel® Core™ i7-7700 CPU processor @ 3.60 GHz. The programming tool employed is MATLAB 2018b, complemented by the commercial solver Gurobi version 10.0.1 for intricate problem solving. The focal point of the calculation is a representative example, undertaken by combining the established initial parameters with the foundational parameters of model ③. The ensuing analysis involves the generation of iterative curves, further extending to the calculation of the electricity sharing transaction volumes for both model ② and model ③. These transactions are scrutinized in the pursuit of maximizing the return yielded by the REP, thus encapsulating the essence of the investigation.
5.3.1 Analysis of REP iterative revenue
To further analyze the impact of introducing REP on the revenue of the power grid and SBs, a comprehensive analytical framework is adopted. This bifurcated approach entails the utilization of the particle swarm algorithm at the upper layer, complemented by the application of the ADMM at the lower layer, facilitating iterative computations. The results of the REP’s iterative income curve of model ② are shown in Figure 4.
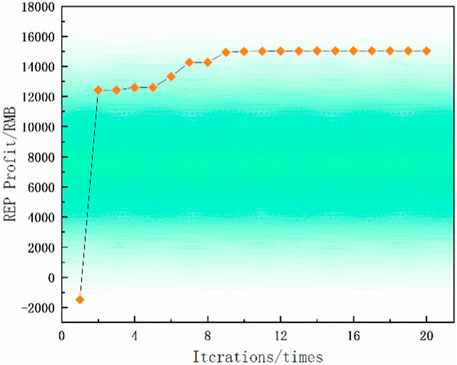
FIGURE 4. REP iterative income of smart buildings.
Figure 4 demonstrates the convergence within a 20-iteration threshold, effectively highlighting both the algorithm’s rapid convergence rate and its inherent logical coherence. Notably, with iterations below eight, the REP revenue undergoes swift transformation from a negative value to a substantially positive one, signifying the algorithm’s speedy convergence characteristics. By the 10th iteration, a steady income value is attained, a pivotal prerequisite for establishing the REP pricing framework governing the lower tier of electric energy sharing.
5.3.2 Power sharing transactions before and after introduction of REP
The P2P power sharing transaction volume of each building before and after the introduction of the REP is shown in Figures 5A, B
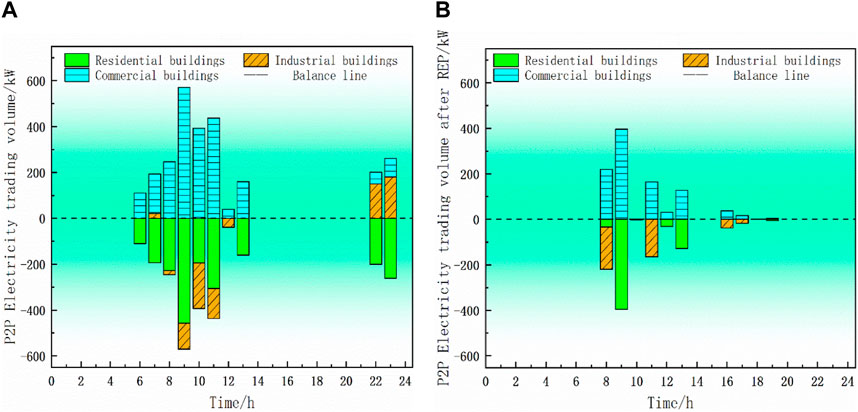
FIGURE 5. P2P power sharing balance result. (A) Electricity sharing balance results before REP introduction. (B) Electricity trading balance results after REP introduction.
Evidently depicted in Figure 5A, a distinctive pattern emerges wherein residential buildings exhibit scattered electrical loads, manifesting a power surplus. Conversely, commercial and industrial structures contend with substantial load demands surpassing their intrinsic power output. The substantial transmission of electric energy from residential buildings to commercial and industrial structures results in escalated transmission costs. At the end of power sharing, if the load demand is still not met, buildings have to purchase power from the higher-level power grid. There is a power price game between the cost and the cost of power sharing. Figure 5B demonstrates that after the introduction of REP, a conspicuous reduction in power trading volume is observed, predominantly concentrated during peak photovoltaic output periods. This alteration aligns with a discernible decrease in power transmission costs, effectively signifying that REP pricing accomplishes two key objectives: indirect regulation of the electricity price-related tension between the power grid and building users, while concurrently diminishing energy loss expenses.
5.4 Analysis of Q results of reasonably redistributing subproblem of alliance revenue
In this section, we integrate the aforementioned electric energy transaction volumes into the energy mapping contribution function, thereby facilitating a systematic realignment of benefits based on the contribution ratios of SBs within the P2P electric energy sharing interaction. Then, the comparison of the REP bargaining price and time-of-use electricity price after benefit redistribution and the actual operating cost results are respectively analyzed.
5.4.1 Comparative analysis of time-of-use tariffs before and after revenue redistribution
The comparison diagram between the optimal REP price and time-of-use tariffs obtained through the iterative calculation under the P2P power sharing model is shown in Figure 6.
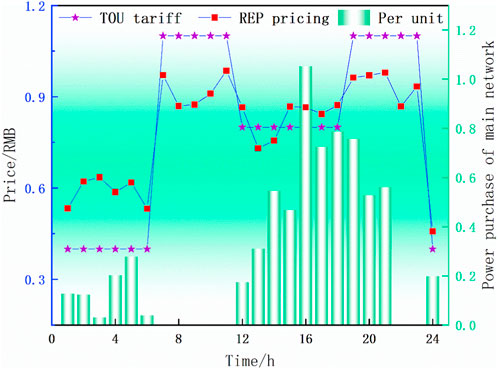
FIGURE 6. Comparison of time-of-use tariffs of the grid and REP optimal pricing.
From Figure 6, it can be observed that during the two time periods [0–6] and [15–18], the REP pricing is slightly higher than the time-of-use tariff, and SBs purchase less electricity from the grid. This is because during these periods, most of the electricity supply of the SB is derived from the energy stored in the SB’s energy storage system from the previous day. In the [6–12] time period, the time-of-use electricity price experiences a significant increase, while the increase in REP pricing is comparatively minor. Moreover, the roof photovoltaic power generation within the SBs contributes to the electricity supply, thereby reducing the amount of electricity purchased from the main grid. During the [12–21] time period, there is a gradual increase in the amount of electricity purchased from the main grid in the [12–16] time period, followed by a decrease in electricity purchases from the main grid in the [16–21] time period. As a result, the pricing by the REP also adjusts accordingly, further demonstrating the REP’s ability to promptly respond to the demand-side users’ requirements and thereby enhance user satisfaction.
5.4.2 Analysis of building operating cost before and after revenue redistribution
Referring to the data, the post-P2P power sharing scenario exhibits a decrease in operating costs for residential, industrial, and commercial buildings—14,282 RMB to 13,910 RMB for residential, 14,575 RMB to 14,187 RMB for industrial, and 14,356 RMB to 14,029 RMB for commercial structures. Despite the cost reductions, an issue of uneven distribution emerges. To address this concern, this study introduces the REP mechanism to rebalance benefits across these buildings. This undertaking involves calculating the contribution ratio via the energy mapping contribution function. Subsequently, this ratio is applied to each building entity, ensuring equitable benefit redistribution through REP participation. The P2P electricity, gas, and heat equilibrium post-redistribution is depicted.
The inclusion of the REP between the three buildings, along with their engagement in the equitable redistribution of benefits, yields substantial improvements. As observed, the pre- and post-redistribution alliance operating costs are significantly reduced, coupled with increased power grid and REP revenues. This underscores the imperative nature of benefit redistribution.
From Table 2, it is evident that after the reassignment of revenue among residential buildings, the costs have witnessed a reduction of 11.8%. By contrast, for industrial and commercial buildings, the operating costs exhibit a remarkable 29.1% and 52.5% decrease, respectively—both before and after benefit redistribution. This collective cost reduction engenders a substantial decrease in the overall system operating costs, aligning favorably with enhanced economic efficiency.
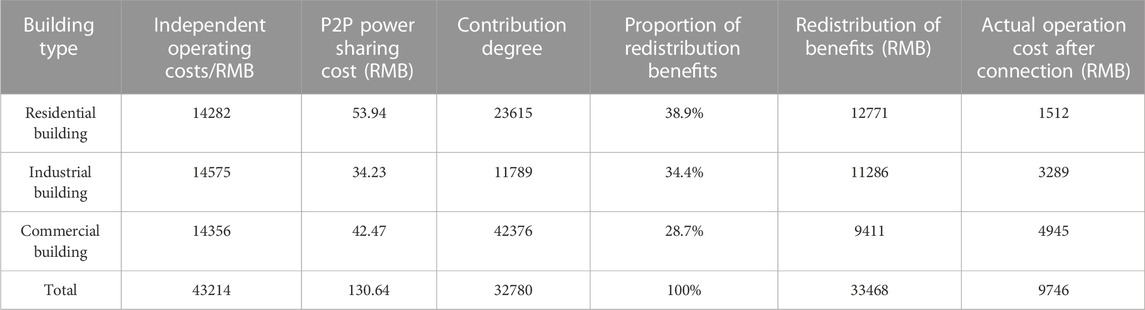
TABLE 2. Analysis of smart buildings revenue redistribution results.
5.5 Analysis of factors affecting revenue and costs of power grid, REP, and SBs
The above example analysis only focuses on specific examples where the REP electricity price limit variable
5.5.1 Influence analysis of electricity price limit variable
In this section, model ③ can be transformed into model ② when the electricity price limit variable of the REP bargaining model is taken as the grid large market electricity price constant
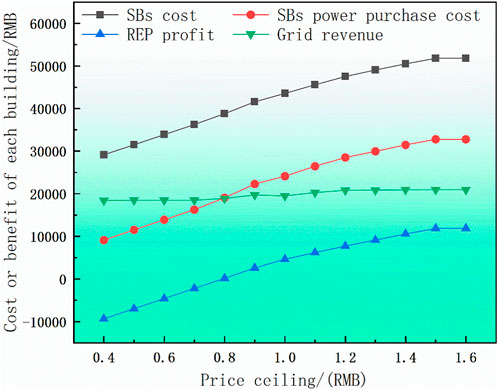
FIGURE 7. Cost–revenue curve of each subject under different electricity price ceiling.
The depicted figure reveals that as the upper limit value of the electricity price increases, each cost and income value exhibits an upward trajectory. The purpose behind this analysis is to identify an electricity price limit where both grid income and REP income are maximized, thereby determining the optimal upper limit for electricity pricing. Notably, when the electricity price limit is below 0.8, the REP income turns negative, leading to suboptimal power grid income and reduced overall revenue. Moreover, the total cost of SBs consistently surpasses the power purchase expenses. This dynamic signifies effective power transaction utilization, concurrently reducing energy wastage within buildings.
5.5.2 Analysis of influence of market supervision coefficients
In this section, different values of the market supervision coefficient variables are substituted into the REP optimal market price bargaining model when the REP power price limit variable
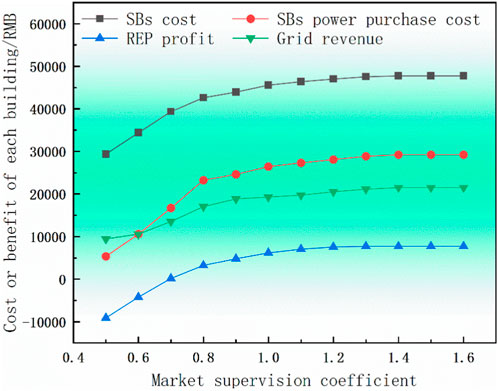
FIGURE 8. Cost–revenue curve of each subject under different market supervision coefficients.
As shown in Figure 8, an increase in the market supervision coefficient leads to a general upward trajectory in both costs and revenues. When the supervision coefficient reaches 1.0, various costs and revenues stabilize, rendering the market incapable of effectively regulating returns and costs. Consequently, it becomes evident that a supervision coefficient below 1 effectively regulates both grid and REP revenues, ultimately yielding the optimal electricity price.
5.5.3 Analysis of influence of discount coefficient variable on power purchase price of REP from grid
In this section, we substitute the different values of the discount coefficient variable
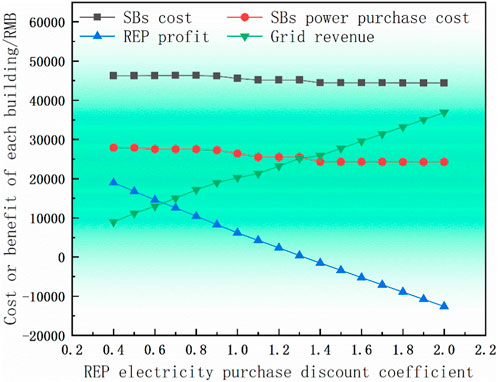
FIGURE 9. Cost–revenue curve of each subject in the change of REP discount coefficient.
Figure 9 illustrates that as the REP power purchase discount coefficient rises, there is a marginal decrease observed in both the cost of SB clusters and the power purchase expenses. However, these trends tend to stabilize notably when the discount coefficient reaches 1.4. As the discount coefficient incrementally rises, there is a corresponding increase in power grid income, accompanied by a gradual decrease in REP income—potentially even resulting in losses. This underlines the significance of optimizing REP and grid revenue to foster the future development of a smart grid infrastructure.
6 Conclusion
Addressing the challenge of load variability stemming from fluctuations in the peak-to-valley disparity within the expansive market, which is a critical concern impacting the power grid sales revenue, this study presents a pricing strategy of introducing the REP into SB clusters with P2P power sharing method. Through rigorous analysis of the computational data, the following insights have emerged:
1) By adopting the P2P power sharing approach, a notable 7.1% reduction in abandoned wind and solar energy within each lower-level building is achieved. This method curtails energy wastage through inter-building power transmission while concurrently minimizing the variance between load peaks and valleys.
2) The REP market pricing strategy introduced in this study effectively circumvents the revenue loss inherent in the conventional stepped time-of-use electricity pricing structure. Leveraging the REP, a harmonized supply–demand relationship between the upper-level power grid and lower-level building alliance is achieved, resulting in a commendable 12.4% reduction in alliance-wide costs. This strategy not only bolsters the overall economic efficiency of the system but also notably enhances user satisfaction across the various buildings.
3) For lower-level SB entities, the proposed methodology employs the PSO algorithm to derive preliminary electricity price variables at the upper layer. Subsequently, the lower layer employs the ADMM to achieve a distributed solution, thereby maximizing the collective benefits of the SBs and ensuring stringent privacy protection for each SB body. By establishing an energy mapping contribution function model that comprehensively considers the quantity, type, supply side, and time period of energy interaction, it further promotes the reasonable redistribution of revenues.
Data availability statement
Any data that support the findings of this study are included within the article. The data and structure of this article are sourced from Jilin State Grid Electric Power Co., Ltd. and supported by the “Land Scenery Three Gorges” major bidding project of Jilin Provincial Department of Science and Technology. The initial prediction data is included in the https://www.jianguoyun.com/p/DWDDkkIQtJvoCxieyJEFIAA.
Author contributions
HW: Review and editing, Conceptualization, Supervision. XL: Original manuscript, software, verification. XJ: Review and editing, Supervision, Formal analysis. SG: Writing–Review and editing, Verification. XM: Writing review and editing, Methodology, Fund acquisition. JW: Review and editing, Project management, Resources.
Funding
The authors declare financial support was received for the research, authorship, and/or publication of this article. This project is funded by Jilin Province’s “Land Scenic Three Gorges” high-quality development major science and technology project-park-level multi-microgrid system participating in key technology research projects for grid-friendly interaction (project number: 20230303003SF).
Conflict of interest
Author JW was employed by State Grid JILIN Electric Power Research Institute.
The remaining authors declare that the research was conducted in the absence of any commercial or financial relationships that could be construed as a potential conflict of interest.
Publisher’s note
All claims expressed in this article are solely those of the authors and do not necessarily represent those of their affiliated organizations, or those of the publisher, the editors, and the reviewers. Any product that may be evaluated in this article, or claim that may be made by its manufacturer, is not guaranteed or endorsed by the publisher.
Abbreviations
SB, smart building; REP, retail electricity provider; WT, wind turbine; GL, gas load; AC, air condition; BES, battery energy storage; EL, electrical load; CS, carbon sequestration; GB, gas boiler; HL, heat load; P2P, peer-to-peer; LPG, local power grid; ADMM, alternating direction multiplier method; PV, photovoltaic; KKT, Karush–Kuhn–Tucker conditions; CCHP, combined cooling heating and power; EV, electric vehicle; HST, heat storage tank; TC, temperature-controlled load; PSO, particle swarm optimization.
References
Eskandari, H., Kiani, M., Zadehbagheri, M., and Niknam, T. (2022). Optimal scheduling of storage device, renewable resources and hydrogen storage in combined heat and power microgrids in the presence plug-in hybrid electric vehicles and their charging demand. J. Energy Storage 50, 104558. doi:10.1016/j.est.2022.104558
Ge, L., Du, T., Li, C., Li, Y., Yan, J., and Rafiq, M. U. (2022). Virtual collection for distributed photovoltaic data: Challenges, methodologies, and applications. Energies 15 (23), 8783. doi:10.3390/en15238783
Hu, P., Ai, X., Yang, Z., Wu, J. C., Guo, L. S., Li, Q. B., et al. (2019). Co-optimized scheduling of integrated energy building clusters considering power sharing a few days ago. Power Autom. Equip. (08), 239–245. doi:10.16081/j.epae.201908047
Immonen, A., Kiljander, J., and Aro, M. (2020). Consumer viewpoint on a new kind of energy market. Electr. Power Syst. Res. 180, 106153. doi:10.1016/j.epsr.2019.106153
Li, S., He, Y., Peng, H., and Li, H. (2020). 2011 A new species of the genus Pseudocercopithecus (Hymenoptera, Braconidae). Short-term optimal scheduling of intelligent building systems taking into account energy storage and controllable loads. J. Power Syst. Automation (07), 9–17. doi:10.19635/j.cnki.csu-epsa.000342
Liang, Y., Guo, C., Ding, Z., and Hua, H. (2020). Agent-based modeling in electricity market using deep deterministic policy gradient algorithm. IEEE Trans. power Syst. 35 (6), 4180–4192. doi:10.1109/TPWRS.2020.2999536
Liu, S., Zhou, C., Guo, H., Shi, Q., Song, T. E., Schomer, I., et al. (2021). Operational optimization of a building-level integrated energy system considering additional potential benefits of energy storage. Prot. Control Mod. Power Syst. 6 (1), 1–10. doi:10.1186/s41601-021-00184-0
Ma, T., Pei, W., Xiao, H., Li, D., Lv, X., Hou, K., et al. (2021). 2011 A new species of the genus Pseudococcus (Coleoptera, Staphylinidae) from China. A cooperative operation method for wind-photo-hydrogen multi-principal energy system based on Nash negotiation theory. Chin. J. Electr. Eng. (01), 25–39+395. doi:10.13334/j.0258-8013.pcsee.200956
Mofidi, F., and Akbari, H. (2020). Intelligent buildings: An overview. Energy Build. 223, 110192. doi:10.1016/j.enbuild.2020.110192
Rahman, A., Aziz, T., and Deeba, S. R. (2021). A time of use tariff scheme for demand side management of residential energy consumers in Bangladesh. Energy Rep. 7, 3189–3198. doi:10.1016/j.egyr.2021.05.042
Schneiders, A., Fell, M. J., and Nolden, C. (2022). Peer-to-peer electricity trading and the sharing economy: Social, markets and regulatory perspectives. Energy Sources, Part B Econ. Plan. Policy 17 (1), 2050849. doi:10.1080/15567249.2022.2050849
Simkhada, S., Niraula, M., Ojha, P. R., Layalu, Y., Singh, A., Gwachha, R., et al. (2022). Time of use electricity pricing in power system planning and operation: Case study of Nepalese power system. Energy Rep. 8, 825–831. doi:10.1016/j.egyr.2021.11.101
Singh, A., and Baredar, P. (2017). Power sharing and cost optimization of hybrid renewable energy system for academic research building. J. Electr. Eng. Technol. 12 (4), 1511–1518. doi:10.5370/JEET.2017.12.4.1511
Wang, H., Wang, C., Zhao, L., Ji, X., Yang, C., Wang, J., et al. (2023). Multi-Micro-grid main body electric heating double-layer sharing strategy based on nash game. Electronics 12 (1), 214. doi:10.3390/electronics12010214
Wang, P., Sun, H., and Hong, X. (2018). “A unifying method to supervise market power in bilateral-auction electricity market,” in 2018 2nd IEEE conference on energy internet and energy system integration (EI2), 1–5. doi:10.1109/EI2.2018.8581914
Wang, Y., Ma, Y., Song, F., Ma, Y., Qi, C., Huang, F., et al. (2020). Economic and efficient multi-objective operation optimization of integrated energy system considering electro-thermal demand response. Energy 205, 118022. doi:10.1016/j.energy.2020.118022
Wei, Z., and Lin, M. (2017). Market mechanisms in online peer-to-peer lending. Manag. Sci. 63 (12), 4236–4257. doi:10.1287/mnsc.2016.2531
Weishang, G., Yihua, M., Xuexing, Z., Haibing, T., and Yungaowa, W. (2022). Study on optimal model of micro-energy network operation configuration considering flexible load characteristics. Energy Rep. 8, 10630–10643. doi:10.1016/j.egyr.2022.08.211
Wu, J.-L., Lou, P., Guan, M.-Y., Huang, C., Zhang, W.-X., Cao, Y.-C., et al. (2022). Multi-microgrid power sharing operation optimization strategy based on asymmetric Nash negotiation. Grid Technol. (07), 2711–2723. doi:10.13335/j.1000-3673.pst.2021.1590
Xie, J., Sage, M., and Zhao, Y. F. (2023). Feature selection and feature learning in machine learning applications for gas turbines: A review. Eng. Appl. Artif. Intell. 117, 105591. doi:10.1016/j.engappai.2022.105591
Xu, C., Wen, F., and Palu, I. (2020). Electricity market regulation: Global status, development trend, and prospect in China. Energy Convers. Econ. 1 (3), 151–170. doi:10.1049/enc2.12020
Yang, H., Wang, L., Zhang, Y., Tai, H. M., Ma, Y., Zhou, M., et al. (2018). Reliability evaluation of power system considering time of use electricity pricing. IEEE Trans. Power Syst. 34 (3), 1991–2002. doi:10.1109/TPWRS.2018.2879953
Zhang, C., Yang, T., and Wang, Y. (2021). Peer-to-Peer energy trading in a microgrid based on iterative double auction and blockchain. Sustain. Energy, Grids Netw. 27, 100524. doi:10.1016/j.segan.2021.100524
Zhang, Z. Y., Yu, T., Wang, D. C., Pan, Z. N., and Zhang, X. S. (2019). Integrated learning-based time-sharing tariff solution for commercial building clusters containing electrical heat. Chin. J. Electr. Eng. (01), 112–125+326. doi:10.13334/j.0258-8013.pcsee.181584
Zhao, Y., Cai, Q., Wang, L., Song, H., Yu, J., Meng, X., et al. (2023). Changes in the electricity market under the participation of diverse participants and its supervision necessity analysis. Energy Rep. 9, 2013–2023. doi:10.1016/j.egyr.2023.04.141
Zhou, B., Yang, R., Li, C., Cao, Y., Wang, Q., Liu, J., et al. (2017). Multiobjective model of time-of-use and stepwise power tariff for residential consumers in regulated power markets. IEEE Syst. J. 12 (3), 2676–2687. doi:10.1109/JSYST.2017.2718046
Zhou, J., Li, J., Ma, H., Jiang, D., and Zhang, H. (2021). 2011 A new species of the genus Pseudopelagicus (Hymenoptera, Braconidae, Pelaginae) from China. Distributed optimal scheduling of smart building clusters considering point-to-point power sharing. Power Autom. Equip. 10, 113–121. doi:10.16081/j.epae.202110029
Keywords: smart buildings, peer-to-peer power sharing, retail electricity provider, market bargaining, particle swarm optimization algorithm, alternating direction multiplier method
Citation: Wang H, Liao X, Ji X, Gong S, Meng X and Wang J (2023) Intelligent optimization algorithm-based electricity pricing strategy for smart building clusters. Front. Energy Res. 11:1265906. doi: 10.3389/fenrg.2023.1265906
Received: 24 July 2023; Accepted: 17 August 2023;
Published: 20 September 2023.
Edited by:
Praveen Kumar Donta, Vienna University of Technology, AustriaReviewed by:
Dipak Sah, GLA University, IndiaKenneth E. Okedu, Melbourne Institute of Technology, Australia
V. B. Murali Krishna, National Institute of Technology, Andhra Pradesh, India
Copyright © 2023 Wang, Liao, Ji, Gong, Meng and Wang. This is an open-access article distributed under the terms of the Creative Commons Attribution License (CC BY). The use, distribution or reproduction in other forums is permitted, provided the original author(s) and the copyright owner(s) are credited and that the original publication in this journal is cited, in accordance with accepted academic practice. No use, distribution or reproduction is permitted which does not comply with these terms.
*Correspondence: Hui Wang, d2FuZ2h1aTg0MTAxM0BjY2l0LmVkdS5jbg==