 Mackenzie Robert Wodicker
 James Nelson
 Nathan Gregory Johnson
- The Polytechnic School, Ira A. Fulton Schools of Engineering, Arizona State University, Mesa, AZ, United States
This work develops microgrid dispatch algorithms with a unified approach to model predictive control (MPC) to (a) operate in grid-connected mode to minimize total operational cost, (b) operate in islanded mode to maximize resilience during a utility outage, and (c) utilize weighting factors in the grid-connected objective function to preserve islanded capability (on-site fuel reserves, battery state of charge) to enhance resilience in the potential event of an unplanned grid outage. Resilience is defined using microgrid survivability (probability to serve 100% of critical load), autonomy (duration of time to serve 100% of critical load), and unserved energy (curtailed critical load) for a target of 7 days during a grid outage. The developed methods are applied to a military microgrid with 2,250 kW of diesel generation, 3,450 kW/13,800 kWh battery storage, and 16,479 kW of solar photovoltaics. Sensitivity analysis is conducted to determine the selection of weighting factors to have the best impact on three developed objectives: grid-connected economics, islanded resilience, and carbon intensity. Optimal weighting factors reduce operating costs by 0.1%, increase survivability by 3.9%, increase autonomy by 16.7%, reduce unserved energy by 94.1%, and increase carbon intensity by 2.5%.
1 Introduction
Climate change has increased the frequency and intensity of natural disasters (Cane et al., 1997; Anderson and Bausch, 2006) and caused significant damage to electrical infrastructure from severe weather (Bryan, 2012; Kerr, 2011; Stott, 2016) and forest fires (Sunrun Inc, 2019; Stelloh, 2019). The damage can create large-scale and prolonged outages with harmful impacts through loss of essential services such as hospitals, climate control, and transportation (Anderson and Bell, 2012), and may include increased impacts to rural communities and marginalized populations (UNISDR, 2015). Anthropogenic stressors such as physical and cyber-attacks (Chen et al., 2011; Zhu et al., 2014), lack of maintenance leading to equipment failure (Venkatasubramanian and Yuan, 2004), and human error (Muir and Lopatto, 2004) can also result in grid outages. These situations are characterized as high-impact, low-frequency (HILF) events that motivate attention to improve the resilience of critical power systems to anticipate, adapt, and recover from disturbances (Raoufi et al., 2020). These HILF events cause perturbations in the voltage, grid frequency, current flows, and rotating generator torque that can cascade beyond the immediate location of the fault and affect adjacent infrastructure and regions. Mitigation strategies to address these stability issues include distributed control strategies (Lee et al., 2016; Ayar et al., 2017), generator control circuits (Ellithy et al., 2013; Derafshian and Amjady, 2015), fast-acting power electronics devices (Ma et al., 2016; Yu et al., 2018), and distributed energy resources (DERs) and microgrids (Krismanto et al., 2021). Areas of the grid with high amounts of renewable generation and DERs may be at higher risk to outages if the variability in their output power is not complemented with advanced power electronics or sufficient operating reserves from storage, controllable loads, and dispatchable generation (Ogunjuyigbe et al., 2016; Khani et al., 2012; Dulău et al., 2014; Resource and MW Fault Induced Solar Photovoltaic, 2017).
These centralized approaches to grid stability are increasingly effective but still cannot guarantee resilience to critical loads if transmission and distribution lines are severed. Critical circuits at hospitals, military bases, cellular towers, refrigeration, data centers, and other uses are often equipped with an uninterruptable power source (UPS) and generators to maintain power in the event of a grid outage. It is less common to have a coordinated set of renewables, storage, generators, and load control that serves an entire distribution network behind-the-meter as a district or campus-scale microgrid (Zheng, 2022; Energy Government and US, 2022). Grid-connected microgrids are an existing technology with a rapidly growing adoption trend to provide resilience to customers requiring power in the event of a grid outage. The U.S. Department of Energy (DOE) defines a microgrid as “a group of interconnected loads and distributed energy resources within clearly defined electrical boundaries that acts as a single controllable entity with respect to the grid. A microgrid can connect and disconnect from the grid to enable it to operate in both grid-connected or island-mode” (Ton and Smith, 2012).
Microgrids can provide value in grid-connected mode and in islanded mode. During grid-connected operation, microgrids can provide cost-savings through dispatch of DERs to reduce energy purchases, reduce demand charges, and shift power use to lower cost time-of-use (TOU) periods (Thompson et al., 2016; Nelson and Johnson, 2020; Palma-Behnke et al., 2011; Miao et al., 2013). Additional cost savings can be secured by revenue curation through participation in wholesale energy and ancillary service markets by selling electricity at real-time prices. Federal Energy Regulatory Commission (FERC) Order No. 2222 enables DERs and DER aggregators to participate in real-time markets (Cano, 2020). These microgrid assets require coordination to gain the most value, with typical approaches to economic dispatch including logic-based control (Theerthamalai and Maheswarapu, 2010; Ton and Smith, 2012), non-linear optimization (Bhattacharjee and Khan, 2018), dynamic systems theory (Xiaoping et al., 2010), multi-objective optimization (Meiqin et al., 2010), and Model Predictive Control (MPC) (Nelson and Johnson, 2020; Nelson et al., 2020). This paper uses MPC to dispatch energy assets amidst uncertainty (e.g., variability in renewable generation and loads) (Rawlings and Mayne, 2009) and enhance the technical and economic metrics for microgrids (Bruni et al., 2014). MPC uses historical data and real-time forecasting of future system states to identify optimal decisions for asset dispatch that satisfy the goals of an objective function such as least cost operation, highest resilience, or lowest carbon (Nelson and Johnson, 2020; Nelson et al., 2020). MPC uses static asset parameters and time series data such asset status, critical and controllable load status, solar insolation and wind speed, ambient air temperatures, retail energy and demand charge costs, and market pricing signals to determine the optimal operation of a microgrid (Nelson and Johnson, 2020; Xiaoping et al., 2010; Meiqin et al., 2010). Renewables and energy storage are increasingly common in microgrids, and help organizations meet carbon reduction goals while also reducing electricity bills and enhancing resilience (Theerthamalai and Maheswarapu, 2010; Bhattacharjee and Khan, 2018).
Microgrids provide resilience to critical loads in the event of electric utility outages (Energy Government and US, 2022; Moretti et al., 2019; Rawlings and Mayne, 2009; Nelson et al., 2020). Back-up power is presently common to maintain critical loads for public health services, fire and police, and military bases, to name a few, and recent changes in technology, business models, and regulation are opening the door for microgrids to displace back-up generators. Not only this, but distribution system infrastructure can be damaged during utility outages, causing sizable economic impacts and motivating microgrids to enhance system stability in the larger grid (Energy Government and US, 2022).
The increasing focus on resilience has not yet led to a single commonly accepted definition or quantifiable metric for resilience. The term generally refers to the ability of a system to withstand HILF events (Raoufi et al., 2020; Bhusal et al., 2020). Some examples of quantitative metrics include Customer Average Interruption Duration Index (CAIDI), Loss of Load Frequency (LOLF), Loss of Load Probability (LOLP), asset reliability, loss of power to critical public service loads such as emergency management and hospitals, power quality, and economic losses from a grid outage (Raoufi et al., 2020; Khan and Iravani, 2007; Fu et al., 2015; Bhusal et al., 2020). In this paper, the metric of survivability is used from (Nelson et al., 2020) to describe the resilience of microgrid operations as a probability that critical load on the system will be served during islanded conditions. The quantitative development is similar to LOLP, which uses uncertainties in load forecasts to determine the probability that the peak load on a power system will exceed the generating capacity (Gambirasio, 1976). Survivability, however, uses failure rates of generating assets and considers all possible system configurations to determine the probability that generation can meet the critical load. Autonomy is also used to describe the duration of time the microgrid can meet critical loads while islanded. Unserved energy to critical loads is reduced and eliminated through microgrid control operations. These metrics are used to evaluate the resilience of MPC approaches developed in this paper.
The objective function for microgrid operation is different in grid-connected mode (economic optimization) and in islanded mode (resilience optimization) and asset dispatch must adapt accordingly. For example, a microgrid’s primary objective may be to provide 7-day autonomy and therefore microgrid assets will be dispatched to ensure energy is available for an islanding event (Johnson, 2022). Conversely, a commercial project may have an interest in electricity cost savings resulting in higher energy market participation and energy and demand charge reduction during peak TOU periods (Wood, 2022). Motivation exists, especially for large customers, to optimize both resilience and economic impacts of microgrid operations. Most current literature does not investigate the interrelated influence of grid-connected microgrid economic dispatch with the resilience of the microgrid during islanded operation, instead, those operating modes are isolated and approached separately (Nelson and Johnson, 2020; Nelson et al., 2020; Jafari et al., 2018). Efforts in this paper show the benefits for co-optimization of grid-connected and islanded algorithms. Minimal to no research exists on how economic optimization for grid-connected operations affects resilience optimization for islanded operations. This paper attempts to address this gap by coupling microgrid dispatch approaches presented in (Nelson and Johnson, 2020; Nelson et al., 2020), in which MPC and Markov Chains are used to dispatch microgrids and quantify resilience during islanded operations, respectively. By coupling the methods of grid-connected and islanded dispatch of microgrids, the study shows the intersectional relationship between cost-minimized grid-connected cost and resilience-maximized dispatch during unpredictable utility outages. Additionally, this work adopts the use of objective function weighting factors from (Nelson et al., 2020) for islanded dispatch and applies them to grid-connected dispatch methods in (Nelson and Johnson, 2020) in an effort to improve islanded resilience while maintaining low operational cost. This work identifies that microgrid generator and battery usage is the key factor in managing this intersectional relationship of cost and resilience, and presents a method to optimize usage for the best overall outcome. Contributions of this work to literature include:
• Introduces objective functions and demonstrates how microgrid control decisions in grid-connected and islanded mode can be coordinated to advance overall economic and resilience goals;
• Demonstrates and studies the relationship between grid-connected operational cost and islanded resilience of microgrid operations;
• Enhances resilience quantification by incorporating solar photovoltaic (PV) reliability into microgrid survivability calculations;
• Identifies control parameters to optimize microgrid behavior with respect to grid-connected economics and islanded resilience, with an associated quantification of environmental impact to meet carbon reporting goals.
2 Materials and methods
2.1 Microgrid dispatch formulations
The MPC approach implements a Mixed-Integer Linear Programming (MILP) optimization formulation with static and time series data to calculate optimal dispatch decisions. MPC uses a receding time horizon of static length that contains relevant forecasted data (electrical load, solar PV output, grid electricity pricing signals) to make informed decisions for current operations and plan future operations. The first control action within the time horizon is the executed action and is selected with consideration of potential system states in the remaining time steps of the MPC time horizon. One time step is advanced and the MPC is repeated, and this process is continued through the duration of the simulation timeframe.
A Python-based simulation environment was developed to simulate dispatch of microgrid assets in both grid-connected and islanded modes. It is crucial to dispatch microgrid assets to improve economics without sacrificing microgrid survivability, or at least, evaluating the impact of grid-connected dispatch decisions on microgrid survivability in the event a grid outage occurs at any time. These tertiary control signals are used to optimize minute-to-minute performance of a microgrid over the course of a longer-term planning period. The sub-second switching sequences and associated changes in primary controls of power hardware required to transition from grid-connected to islanded mode are outside the scope of this study. Figure 1 shows the process flow to simulate operations of a microgrid and how data is shared between grid-connected and islanded operating modes.

FIGURE 1. Process flow for simulating unified dispatch of microgrid operations.
2.2 Grid-connected dispatch
Grid-connected dispatch algorithms control use of batteries, fossil fuel generators, and solar PV to reduce utility costs by lowering energy charges, lowering demand charges, and generating revenue through energy sales. The grid-connected objective function seeks to minimize operating costs consisting of a generator term, battery term, utility energy import/export term, and demand charge term. Generator operating cost is represented by fuel cost,
A “time step hourly fraction”,
2.3 Islanded microgrid dispatch
The islanded objective function in Eq. (2) consists of three primary terms with associated weighting factors
2.4 Grid-connected microgrid dispatch unified with islanded resilience goals
This work improves microgrid control algorithms developed in (Nelson and Johnson, 2020) by incorporating islanded resilience goals within the grid-connected economic dispatch shown in Eq. (3). Weighting factors were added in the objective function to prioritize the dispatch of energy assets where
3 Evaluation metrics
Microgrid survivability is a quantitative metric to describe the probability that a microgrid’s critical load will be served. The following formulation uses statistical analysis and Markov Chains in (Nelson et al., 2020) with extensions to account for solar PV reliability. Matrices represent potential operating states of microgrid assets (generators, batteries, solar PV arrays) and reflect probabilities of the microgrid configuration to transition to a possible future operating state. From these probabilities, additional matrices are calculated to represent the ability to serve 100% of the critical load during the outage.
The state vector (size
A transition matrix,
Columns of the transition matrix represent all possible combinations of assets in the “current” operating state and the rows contain combinations of assets for possible “future” operating states. As a result, the transition matrix is an upper triangular matrix with size
Eq. (8) shows the calculation for microgrid power generation at time,
Four technical metrics, three economic metrics, and one environmental metric are used to evaluate the performance of microgrid control algorithms. Technical metrics include survivability, autonomy, fuel consumption, and unserved energy. Economic metrics include microgrid O&M cost, revenue from energy sales, and net operational cost. The environmental metric is carbon intensity. Eq. (12) expresses the average probability of surviving a microgrid islanding event over a simulation where
Eq. (13) represents autonomy by summing the slack binary variable,
Eq. (14) shows the calculation for total fuel consumption during an islanding event. Fuel consumption is the product of the generator fuel consumption rate with the generator power output and time step hourly fraction.
Eq. (15) shows the calculation for unserved energy. The total unserved energy during an islanding event is found by summing the curtailed load for the duration of the islanding event.
Eq. (16) expresses the microgrid O&M cost for all DER assets. As discussed in Section 2.1, the sources of microgrid O&M can be influenced by contractual agreements for O&M. In this work, microgrid O&M cost includes fuel use by generators and battery degradation. In some use cases, microgrid O&M can also include fixed and variable generator O&M and fixed and variable solar PV O&M. Eq. (17) expresses microgrid revenue from energy sales to the utility. Energy sales use a net metering assumption where the compensation price is set equal to the purchase price of energy, and if energy sales exceed energy purchases in a billing period, market wholesale rates are used to credit the microgrid for energy sales. Eq. (18) expresses net operating costs, which include dispatch from DERs and utility import energy and demand costs. These costs a reduced by revenue from energy sales.
Eq. (19) shows the calculation of total carbon intensity,
4 Microgrid case study
4.1 Microgrid specification data
A military installation distribution system is used as the microgrid case study given increasing interest from the United States Office of the Secretary of Defense (OSD) to maintain resilience and load-serving capability during utility islanding events (Johnson, 2022). Sensitive information is anonymized.
4.2 Microgrid assets
Potential microgrid assets included diesel generators, battery storage, and solar PV. A Cummins 750 kW diesel generator was used with an assumed constant fuel conversion rate,

TABLE 1. Operational characteristics of battery storage (EOS, 2023a).
Financial data for capital cost, O&M cost, and fuel are provided in Table 2 for all asset types (ESTCP, 2019). Asset capital cost and annual O&M cost are included in the microgrid sizing study because they affect project payback period and sizing economics, but are not included in the dispatch study and main results demonstrated in this work because they do not affect dispatch economics. An average annual inflation rate of 2.2% and nominal investment discount rate of 6.0% were assumed for a 20-year investment period (ESTCP, 2019). Tax incentives include the U.S. federal investment tax credit (ITC) that permits 30% credit towards the developer’s or operator’s taxes, and the Modified Accelerated Cost Recovery System (MACRS) of 5 years to accelerate tax deductions for renewable asset depreciation (Sherlock, 2018). These incentives were applied to the capital costs of solar PV and battery storage. To be eligible for the ITC, battery charging was restricted to renewable sources of generation when grid-connected.
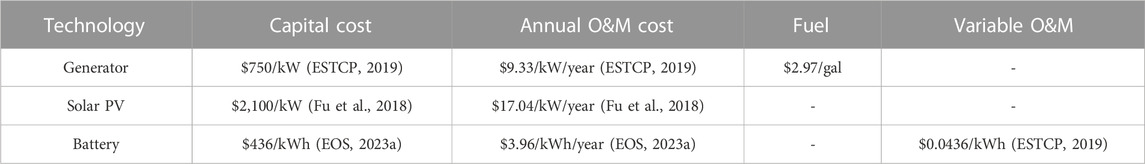
TABLE 2. Asset financial data for optimal sizing and selection for hybrid microgrid.
4.3 Military installation load profile and solar production
The daily peak and daily average values are shown in Figure 2 for the critical load,
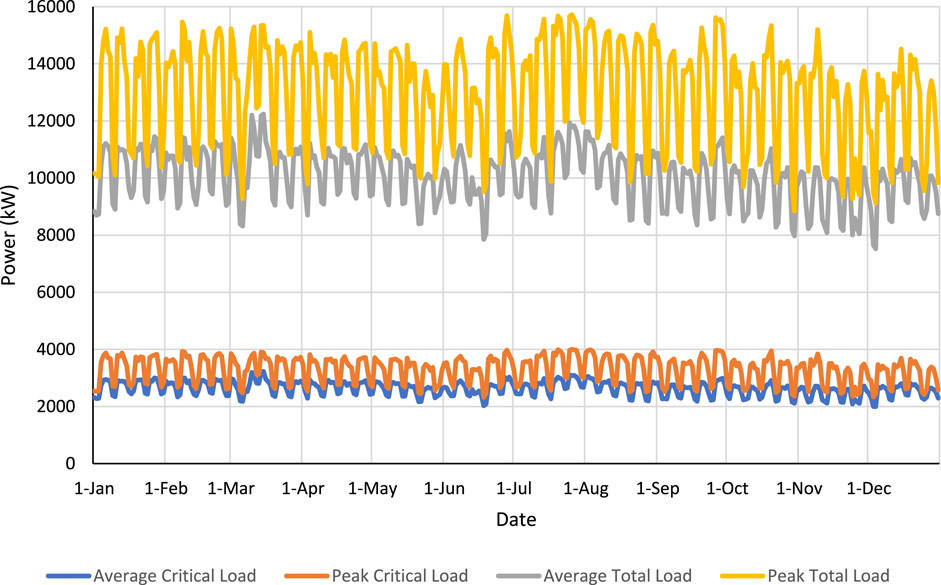
FIGURE 2. Daily critical load and total load.
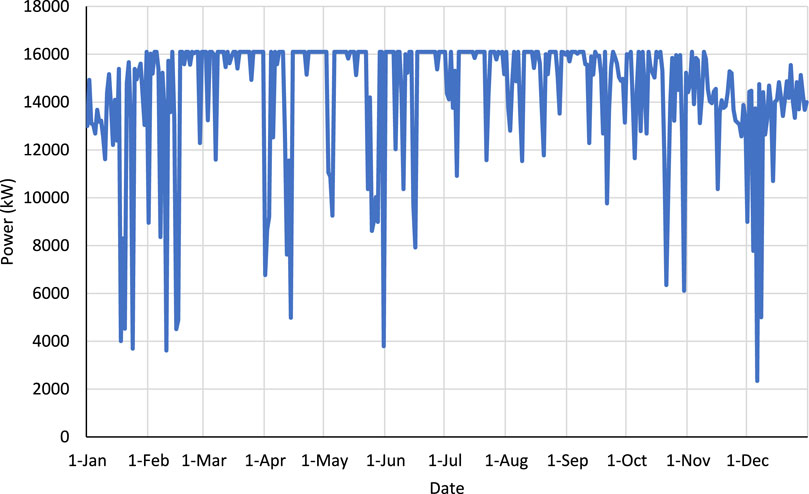
FIGURE 3. Daily peak solar PV output.
4.4 Utility costs
Energy costs differ for summer (June through September) and winter (October through May). Figures 4, 5 show the TOU rate structure for energy,
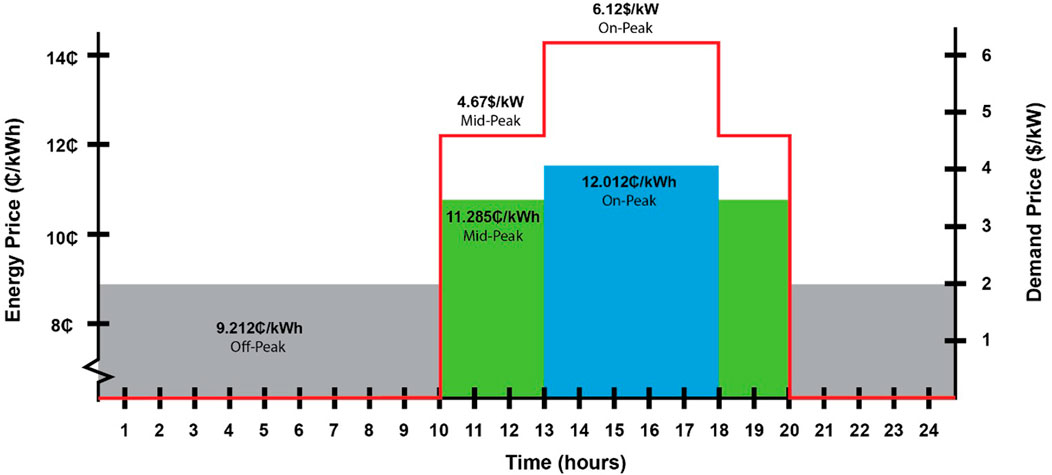
FIGURE 4. Utility rate structure for Summer.
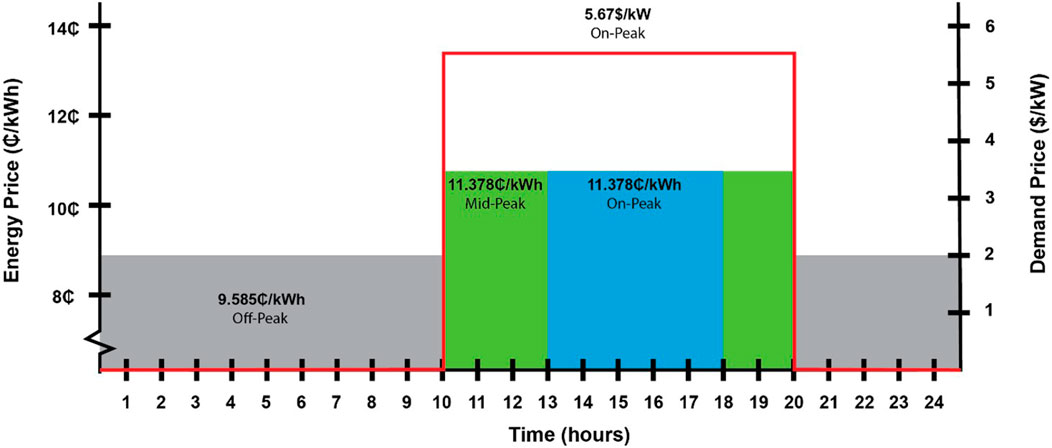
FIGURE 5. Utility rate structure for Winter.
4.5 Optimal microgrid portfolio
Asset sizes were selected by optimizing for lowest cost grid-connected operations using XENDEE (Stadler and Naslé, 2019; Pecenak et al., 2019). XENDEE is a cloud computing software that jointly performs techno-economic optimization and power systems analysis. XENDEE’s economic optimization tool selects, sizes, places, and dispatches energy assets within a microgrid portfolio using MILP. XENDEE minimizes total annual costs of providing energy services to a customer considering system energy demand, regulatory requirements, and energy procurement costs, including monthly fixed utility costs, volumetric electricity purchases, demand charges, annualized technology investment costs, and technology O&M costs during grid-connected and islanding operations. The optimization formulation accounts for technical operating constraints of the considered technologies (e.g., charging/discharging limits of battery stacks) and environmental conditions (e.g., solar irradiance) that influence the capacity of onsite renewable generation. Grid-connected economic dispatch in XENDEE was completed using the local utility tariff that consists of monthly fixed charges, distribution charges, on-peak energy charges, mid-peak energy charges, off-peak energy charges, monthly peak demand charges, and taxes.
XENDEE yielded the cost-optimal asset types and capacities listed in Table 3. This microgrid portfolio is used in remaining sections to exercise the proposed unified dispatch algorithm for grid-connected economic operation and islanded resilience operation.

TABLE 3. Optimal sizing of microgrid assets.
5 Results
Sensitivity analysis was used to evaluate the effect of weighting factors for the grid-connected objective function (Eq. (3)). Each weighting factor was varied from zero to one in steps of 0.2, keeping the summation of the three factors
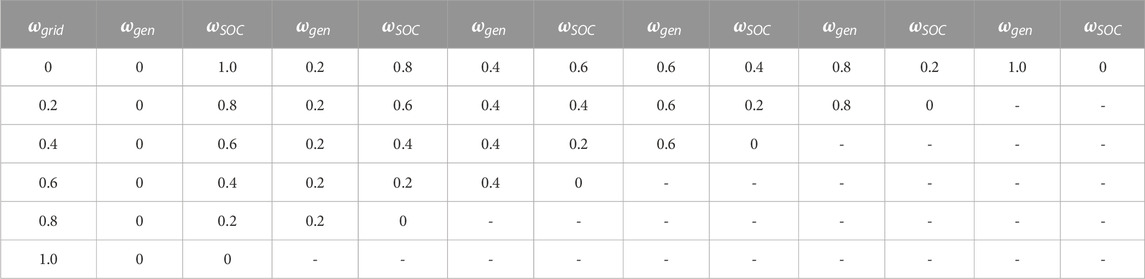
TABLE 4. Summary of sensitivity analyses.
5.1 Grid-connected operation and economics
Figure 6 shows the net operational cost for each combination in the sentivity analysis comprised of grid energy costs, grid demand costs, microgrid O&M costs, fuel costs, and grid energy sales. Inclusion of the grid weighting factor (i.e.,
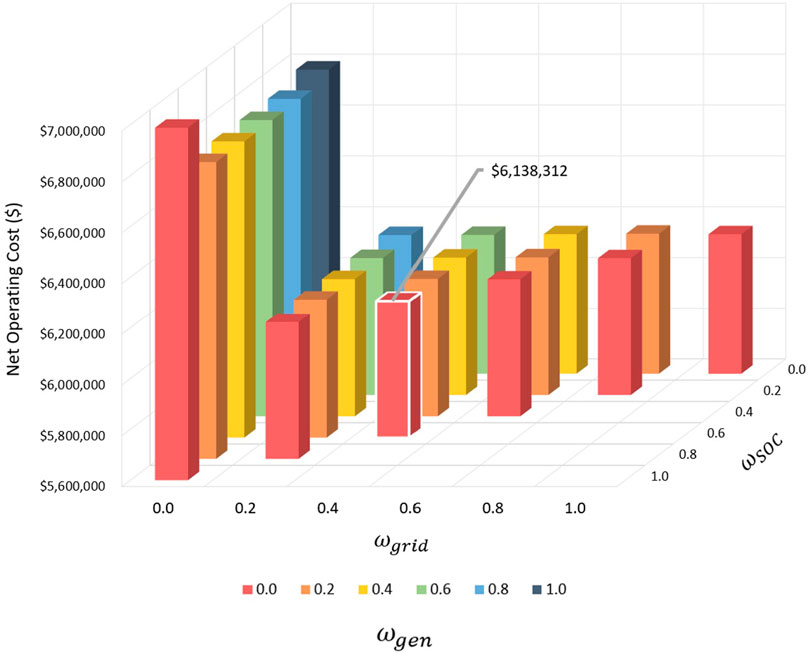
FIGURE 6. Sensitivity analysis showing annual economic results. The case with the lowest net operating cost is outlined in white.
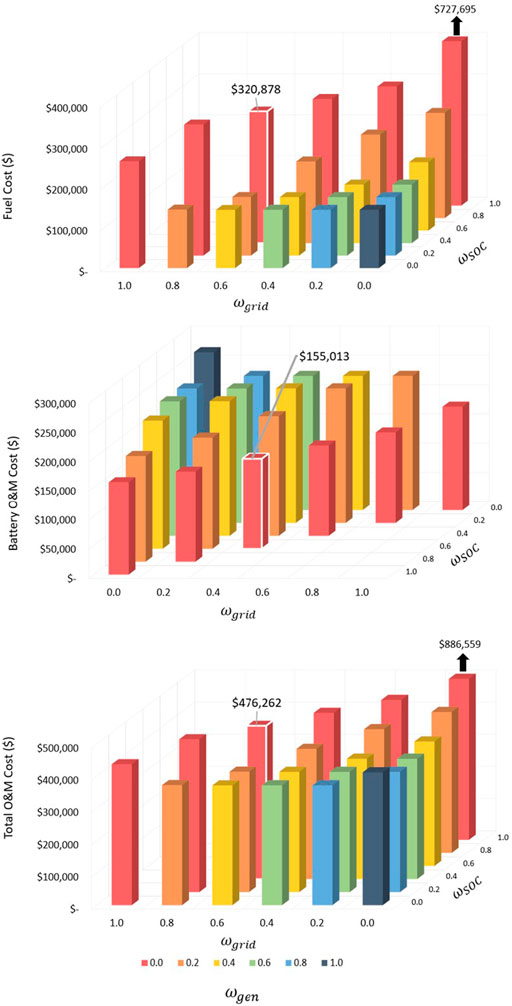
FIGURE 7. Sensitivity analysis of O&M costs. Two cases with values above the z-axis are indicated with black arrow and text, which are truncated for better visualization of the graph topology. The case with the lowest net cost is outlined in white.
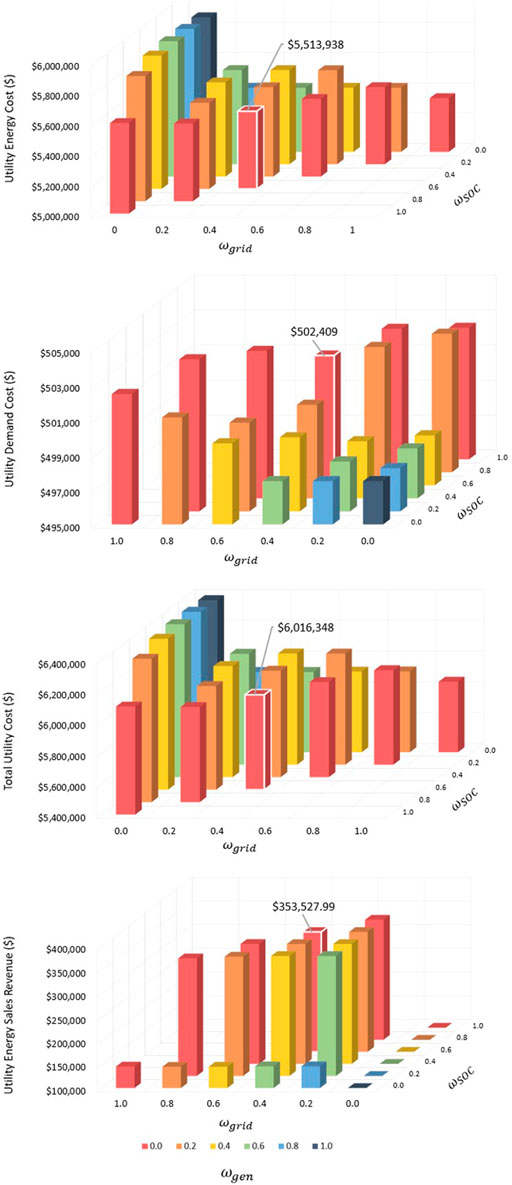
FIGURE 8. Sensitivity analysis of utility cost components and energy sales revenue. The case with the lowest net cost is outlined in white.
5.2 Islanded resilience
Figures 9, 10 show the average islanded microgrid autonomy and average unserved energy during islanded operations, respectively, computed across simulations of a 168-h duration grid outage starting at every time step in a year. In Figure 9, cases where
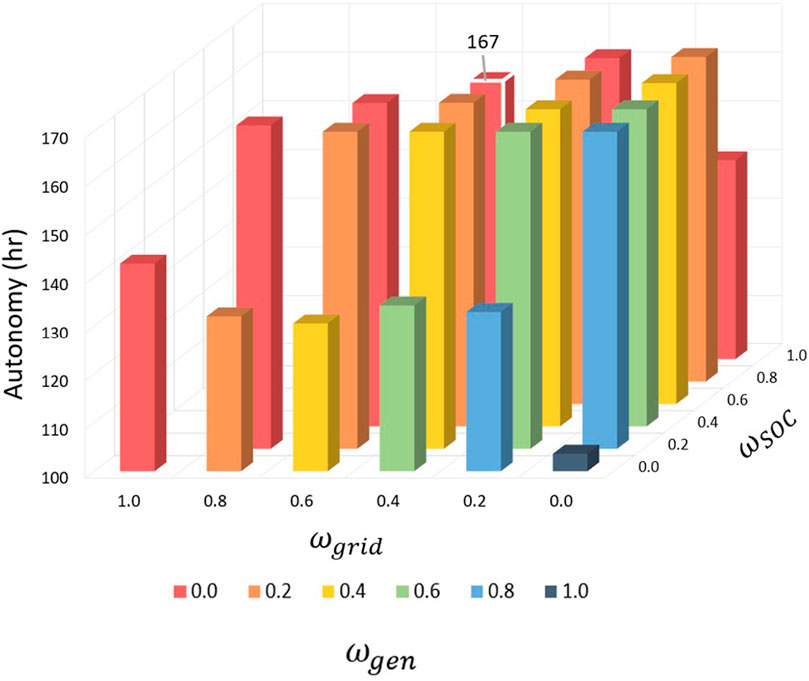
FIGURE 9. Sensitivity analysis islanded autonomy. The case with the lowest net cost is outlined in white.
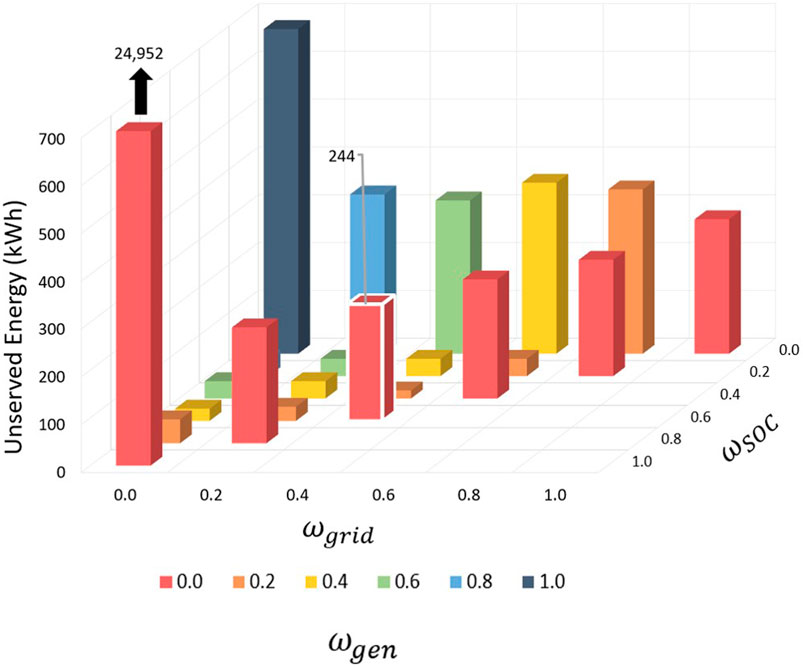
FIGURE 10. Sensitivity analysis unserved energy during islanded operation. One case with unserved energy above the range of the z-axis is shown by a black arrow and text. The case with the lowest net cost is outlined in white.
Figure 11 shows the average survivability for islanded operation across all sensitivity cases. Survivability decreases over time with respect to the increasing statistical likelihood for assets to fail and diesel fuel reserves to become depleted. The optimization weight sensitivity cases are compared to the baseline in which
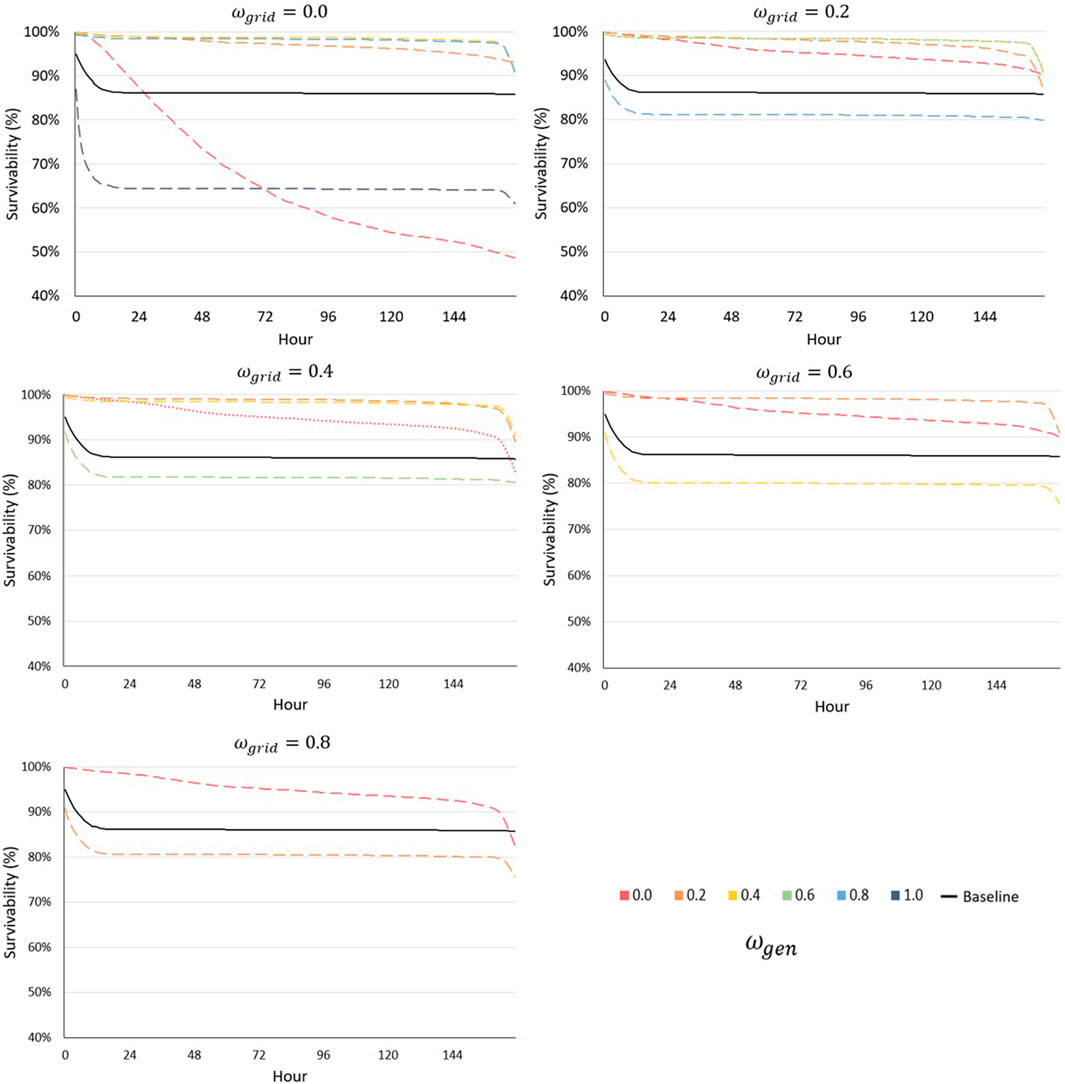
FIGURE 11. Sensitivity analysis islanded survivability. The case with the lowest net cost is indicated by the dotted-line.
5.3 Environmental impacts
Figure 12 shows carbon intensity associated with each sensitivity case. Carbon intensity comprises emissions from utility power purchases and generator power output. Any excess solar exported to the utility is not counted as a credit to reduce carbon intensity. The utility import emission factor and diesel generator emmision factor are
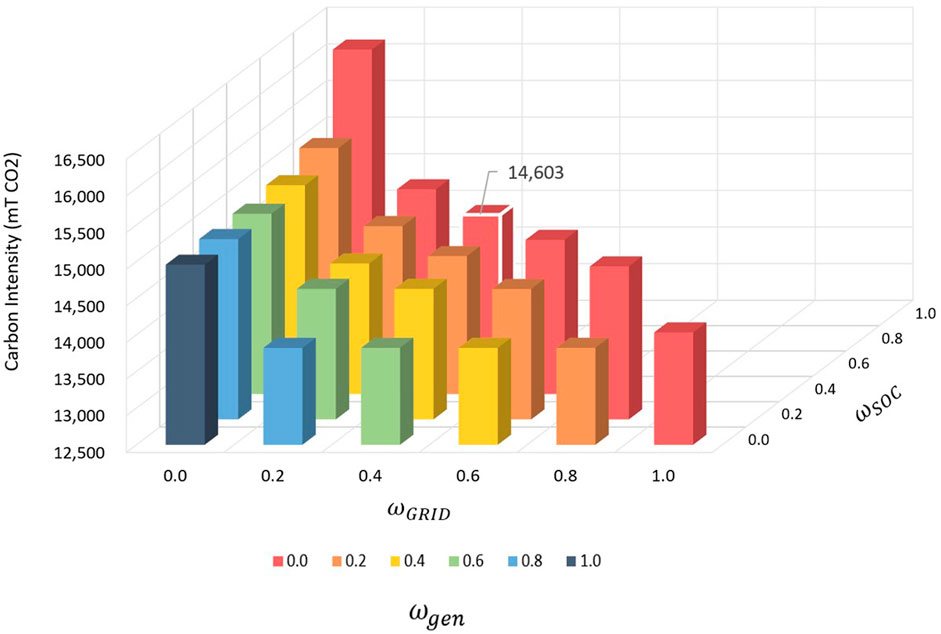
FIGURE 12. Sensitivity analysis carbon intensity results. The case with the lowest net cost is outlined in white.
5.4 Optimal microgrid operations
Results in Table 5 summarize the subset of sensitivity cases that yielded similarly favorable results. For improved economics, any non-zero value for
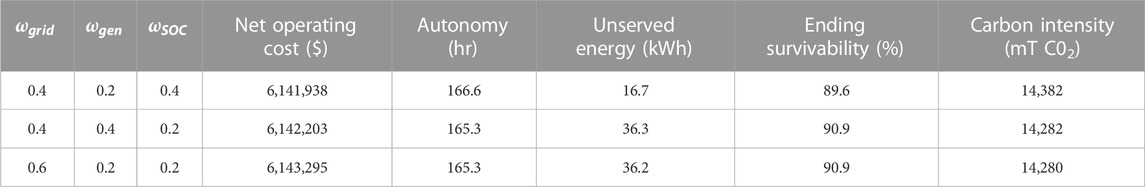
TABLE 5. Summary of weighting factor combinations for illustrative cases.
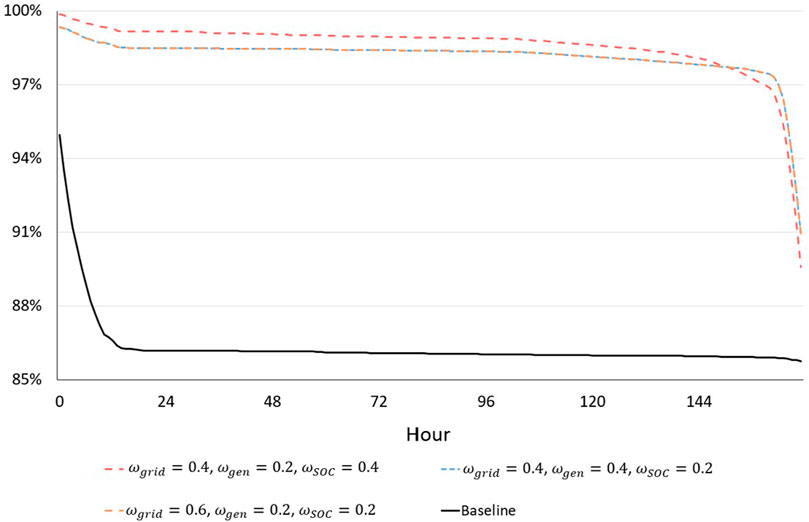
FIGURE 13. Survivability of weighting factor combinations selected to illustrate best case operations for combined grid-connected economics and islanded resilience.
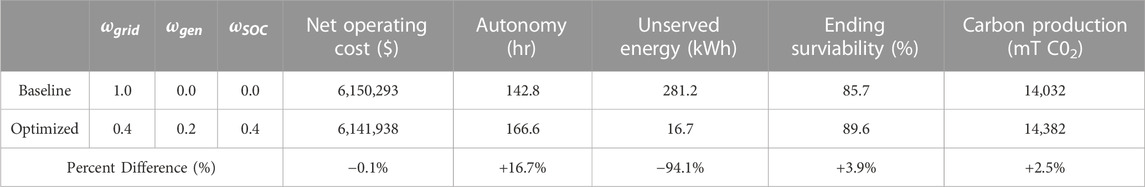
TABLE 6. Summary of operational characteristics for optimal control parameters compared to baseline.
6 Conclusion
This work developed a simulation environment and tertiary controls approach for microgrid economic dispatch and resilience dispatch for grid-connected and islanded operations, respectively. Results demonstrated that including resilience terms in the optimization formulation for grid-connected economic dispatch produced more favorable resilience results, and also yielded a modest improvement in economic results. Optimal selection of weighting factors used in the microgrid control strategy resulted in islanding operational results with a 3.9% improvement in survivability, a 94.1% reduction in unserved energy, and a 16.7% improvement in autonomy, while also delivering a reduction in annual net costs of 0.1%, at the expense of a small increase in carbon intensity of 2.5% relative to the baseline case.
This approach is generalizable for use as a planning tool or during real-time operational control to reflect changing conditions where weighting factors can be selected and tuned to match microgrid goals relative to the situation (e.g., depleted fuel reserves, asset outage, estimated grid outage duration). It may also be beneficial to chose different weighting factors to consider operating conditions such as volitile fuel prices, such as those seen following the global COVID-19 pandemic or conflict in Ukraine (US Energy Information Administration, 2022), utility rate changes, and various types of technology O&M agreements. Microgrid performance during islanded conditions can be improved by tuning weighting factors that maximize battery SOC, and hence, improve the ability of the microgrid to meet loads in the event of a generator outage, solar PV outage, or depleted fuel reserves. While this work demonstrated an undesirable increase in carbon intensity in its results, the methods of weighting factor selection can be applied to prioritize this objective. Future work with the developed methodology can include application across different use cases with results used to compare and contrast weighting factor selection for varying priorities. Additionally, the algorithm can incorporate inputs for planned and unplanned maintenance of DERs to demonstrate how the controls approach can be used to schedule maintenance with least risk to critical loads.
Data availability statement
The datasets presented in this article are not readily available because the input data are information provided by the US DoD and would require permission to be given out to others upon request. The raw dataset showing outputs from the work developed are available upon request, however. Requests to access the datasets should be directed to bXdvZGlja2VAYXN1LmVkdQ==.
Author contributions
MW: Conceptualization, Formal Analysis, Investigation, Methodology, Project administration, Software, Validation, Visualization, Writing–original draft, Writing–review and editing. JN: Conceptualization, Investigation, Methodology, Writing–review and editing. NJ: Funding acquisition, Resources, Supervision, Writing–review and editing.
Funding
The author(s) declare financial support was received for the research, authorship, and/or publication of this article. Funding was provided in part by the US Department of Defense Environmental Security Technology Certification Program (ESTCP) under contract number W912HQ20C0051/ESTCP Project Number EW19-5367. ESTCP provided connections to stakeholders who gave input and data to inform analysis in the work.
Conflict of interest
The authors declare that the research was conducted in the absence of any commercial or financial relationships that could be construed as a potential conflict of interest.
Publisher’s note
All claims expressed in this article are solely those of the authors and do not necessarily represent those of their affiliated organizations, or those of the publisher, the editors and the reviewers. Any product that may be evaluated in this article, or claim that may be made by its manufacturer, is not guaranteed or endorsed by the publisher.
References
Abunima, H., and Teh, J. (2020). Reliability modeling of PV systems based on time-varying failure rates. IEEE Access 8, 14367–14376. doi:10.1109/access.2020.2966922
Anderson, J., and Bausch, C. (2006). Climate change and natural disasters: scientific evidence of a possible relation between recent natural disasters and climate change. Policy Dep. Econ. Sci. policy 2, 2.
Anderson, G. B., and Bell, M. L. (2012). Lights out: impact of the August 2003 power outage on mortality in New York, NY. Cambridge, Massachusetts: Epidemiology 23 (2), 189.
Ayar, M., Obuz, S., Trevizan, R. D., Bretas, A. S., and Latchman, H. A. (2017). A distributed control approach for enhancing smart grid transient stability and resilience. IEEE Trans. Smart Grid 8 (6), 3035–3044. doi:10.1109/tsg.2017.2714982
Bhattacharjee, V., and Khan, I. (2018). A non-linear convex cost model for economic dispatch in microgrids. Appl. energy 222, 637–648. doi:10.1016/j.apenergy.2018.04.001
Bhusal, N., Abdelmalak, M., Kamruzzaman, M., and Benidris, M. (2020). Power system resilience: current practices, challenges, and future directions. IEEE Access 8, 18064–18086. doi:10.1109/access.2020.2968586
Bruni, G., Cordiner, S., Mulone, V., Rocco, V., and Spagnolo, F. (2014). A study of energy management in domestic micro-grids based on model predictive control strategies. Energy Procedia 61, 1012–1016. doi:10.1016/j.egypro.2014.11.1013
Bryan, W. (2012). Emergency situation reports: hurricane sandy. Off. Electr. Deliv. Energy Reliab. U. S. Dep. Energy, Hurric. Sandy Situat. Rep. 20.
California ISO (2023). California ISO – emissions, today’s outlook. California, United States: California ISO.
Cane, M. A., Clement, A. C., Kaplan, A., Kushnir, Y., Pozdnyakov, D., Seager, R., et al. (1997). Twentieth-century sea surface temperature trends. science 275, 957–960. 5302. doi:10.1126/science.275.5302.957
Cano, C. (2020). FERC opens wholesale markets to distributed resources: landmark action breaks down barriers to emerging technologies, boosts competition. Fed. Energy Regul. Comm.
Chen, T. M., Sanchez-Aarnoutse, J. C., and Buford, J. (2011). Petri net modeling of cyber-physical attacks on smart grid. IEEE Trans. smart grid 2 (4), 741–749. doi:10.1109/tsg.2011.2160000
Colli, A. (2015). Failure mode and effect analysis for photovoltaic systems. Renew. Sustain. Energy Rev. 50, 804–809. doi:10.1016/j.rser.2015.05.056
Derafshian, M., and Amjady, N. (2015). Optimal design of power system stabilizer for power systems including doubly fed induction generator wind turbines. Energy 84, 1–14. doi:10.1016/j.energy.2015.01.115
Dulău, L. I., Abrudean, M., and Bică, D. (2014). Effects of distributed generation on electric power systems. Procedia Technol. 12, 681–686. doi:10.1016/j.protcy.2013.12.549
Ellithy, K., Said, S., and Kahlout, O. (2013). “Design of power system stabilizers based on μ-controller for power system stability enhancement,” in 2013 3rd International Conference on Electric Power and Energy Conversion Systems, Istanbul, Turkey, 2-4 October 2013 (IEEE).
Energy Government and US (2022). Department of energy releases new tool tracking microgrid installations in the United States. Washington DC: Energy.Gov, US Department of Energy.
EOS (2023b). EOS energy storage. Available at: https://eosenergystorage.com/.
ESTCP (2019). Data for ESTCP storage Program. Washington, DC: Environmental Security Technology Certification Program ESTCP. Unpublished raw data.
Fu, Q., Nasiri, A., Solanki, A., Bani-Ahmed, A., Weber, L., and Bhavaraju, V. (2015). Microgrids: architectures, controls, protection, and demonstration. Electr. Power Components Syst. 43 (12), 1453–1465. doi:10.1080/15325008.2015.1039098
Fu, R., Feldman, D. J., and Margolis, R. M. (2018). US solar photovoltaic system cost benchmark: Q1 2018. Golden, CO (United States): National Renewable Energy Lab.NREL. No. NREL/TP-6A20-72399.
Gambirasio, G. (1976). Computation of loss-of-load probability. IEEE Trans. Reliab. 25 (1), 54–55. doi:10.1109/tr.1976.5214961
Golnas, A. (2012). “PV system reliability: an operator's perspective,” in 2012 IEEE 38th Photovoltaic Specialists Conference (PVSC) PART 2, Austin, Texas, June 3-8, 2012 (IEEE).
Jafari, M., Malekjamshidi, Z., Zhu, J., and Khooban, M. H. (2018). A novel predictive fuzzy logic-based energy management system for grid-connected and off-grid operation of residential smart microgrids. IEEE J. Emerg. Sel. Top. Power Electron. 8 (2), 1391–1404. doi:10.1109/jestpe.2018.2882509
Khan, M. S., and Iravani, M. R. (2007). “Supervisory hybrid control of a micro grid system,” in 2007 IEEE Canada Electrical Power Conference, Montreal, Canada, October 2007 (IEEE).
Khani, D., Ahmad, S. Y., and Hossein Madadi, K. (2012). Impacts of distributed generations on power system transient and voltage stability. Int. J. Electr. Power & Energy Syst. 43 (1), 488–500. doi:10.1016/j.ijepes.2012.06.007
Krismanto, A. U., Mithulananthan, N., Setiadi, H., Setyawan, E. Y., and Abdillah, M. (2021). Impacts of grid-tied microgrid on stability and interaction of power systems considering RE uncertainties. Sustain. Energy, Grids Netw. 28, 100537. doi:10.1016/j.segan.2021.100537
Lee, H. J., Niddodi, S., Srivastava, A., and Bakken, D. (2016). “Decentralized voltage stability monitoring and control in the smart grid using distributed computing architecture,” in 2016 IEEE Industry Applications Society Annual Meeting, Portland, Oregon, 2-6 October 2016 (IEEE).
Ma, C., Kaufmann, P., Töbermann, J. C., and Braun, M. (2016). Optimal generation dispatch of distributed generators considering fair contribution to grid voltage control. Renew. Energy 87, 946–953. doi:10.1016/j.renene.2015.07.083
Meiqin, M., Meihong, J., Wei, D., and Chang, L. (2010). “Multi-objective economic dispatch model for a microgrid considering reliability,” in The 2nd International Symposium on Power Electronics for Distributed Generation Systems, Hefei, China, 16-18 June 2010 (IEEE).
Miao, Z., Xu, L., Disfani, V. R., and Fan, L. (2013). An SOC-based battery management system for microgrids. Ieee Trans. smart grid 5 (2), 966–973. doi:10.1109/tsg.2013.2279638
Moretti, L., Polimeni, S., Meraldi, L., Raboni, P., Leva, S., and Manzolini, G. (2019). Assessing the impact of a two-layer predictive dispatch algorithm on design and operation of off-grid hybrid microgrids. Renew. Energy 143, 1439–1453. doi:10.1016/j.renene.2019.05.060
Mrowca, B. (2011). Emergency diesel generator failure review 1999-2001. Rockville Pike, MD, USA: Information Systems Laboratories, Inc.
Muir, A., and Lopatto, J. (2004). Final report on the August 14, 2003 blackout in the United States and Canada: causes and recommendations.
Nelson, J., Johnson, N. G., Fahy, K., and Hansen, T. A. (2020). Statistical development of microgrid resilience during islanding operations. Appl. energy 279, 115724. doi:10.1016/j.apenergy.2020.115724
Nelson, J. R., and Johnson., N. G. (2020). Model predictive control of microgrids for real-time ancillary service market participation. Appl. Energy 269, 114963. doi:10.1016/j.apenergy.2020.114963
Ogunjuyigbe, A. S. O., Ayodele, T. R., and Akinola, O. O. (2016). Impact of distributed generators on the power loss and voltage profile of sub-transmission network. J. Electr. Syst. Inf. Technol. 3 (1), 94–107. doi:10.1016/j.jesit.2015.11.010
Palma-Behnke, R., Benavides, C., Aranda, E., Llanos, J., and Sáez, D. (2011). “Energy management system for a renewable based microgrid with a demand side management mechanism,” in 2011 IEEE symposium on computational intelligence applications in smart grid (CIASG), Paris, France, 11-15 April 2011 (IEEE).
Pecenak, Z. K., Stadler, M., and Kelsey, F. (2019). Efficient multi-year economic energy planning in microgrids. Appl. Energy 255, 113771. doi:10.1016/j.apenergy.2019.113771
Raoufi, H., Vahidinasab, V., and Mehran, K. (2020). Power systems resilience metrics: a comprehensive review of challenges and outlook. Sustainability 12 (22), 9698. doi:10.3390/su12229698
Rawlings, J. B., and Mayne, D. Q. (2009). Model predictive control: theory and design WI madison. Santa Barbara, CA: Nob Hill Publishing.
Resource, MW Fault Induced Solar Photovoltaic (2017). 1,200 MW Fault Induced solar photovoltaic resource interruption disturbance report: southern California 8/16/2016 event. Atlanta, GA: NERC.
Sherlock, M. F. (2018). The energy credit: an investment tax credit for renewable energy. Washington DC: Congressional Research Service, 7–5700.
Skoczek, A., Sample, T., Dunlop, E., and Ossenbrink, H. (2008). Electrical performance results from physical stress testing of commercial PV modules to the IEC 61215 test sequence. Sol. Energy Mater. Sol. Cells 92 (12), 1593–1604. doi:10.1016/j.solmat.2008.07.008
Stadler, M., and Naslé, A. (2019). Planning and implementation of bankable microgrids. Electr. J. 32 (5), 24–29. doi:10.1016/j.tej.2019.05.004
Stelloh, T. (2019). California braces for more fires, blackouts as part of state’s new ‘normal.’. New York, NY: NBC News.
Stott, P. (2016). How climate change affects extreme weather events. Science 352, 1517–1518. 6293. doi:10.1126/science.aaf7271
Sunrun Inc (2019). Sunrun illustrates potential for home solar and batteries as wildfire mitigation solution. San Fransisco, CA: Sunrun Inc. Available at: investors.sunrun.com/news-events/press-releases/detail/126/sunrun-illustrates-potential-for-home-solar-and-batteries.
The Climate Registry (2022). The climate Registry 2022 default emission factor document. Los Angeles, CA: The Climate Registry.
Theerthamalai, A., and Maheswarapu, S. (2010). An effective non-iterative “λ-logic based” algorithm for economic dispatch of generators with cubic fuel cost function. Int. J. Electr. Power & Energy Syst. 32 (5), 539–542. doi:10.1016/j.ijepes.2009.11.002
Thompson, C. C., Konstantinos Oikonomou, P. E., Etemadi, A. H., and Sorger, V. J. (2016). Optimization of data center battery storage investments for microgrid cost savings, emissions reduction, and reliability enhancement. IEEE Trans. Industry Appl. 52 (3), 2053–2060. doi:10.1109/tia.2016.2517149
Ton, D. T., and Smith, M. A. (2012). The US department of energy's microgrid initiative. Electr. J. 25 (8), 84–94. doi:10.1016/j.tej.2012.09.013
US Energy Information Administration (2022). Weekly U.S. all grades all formulations retail gasoline prices (dollars per gallon). Washington DC: US Energy Information Administration.
Venkatasubramanian, V., and Yuan, Li. (2004). “Analysis of 1996 Western American electric blackouts,” in Bulk power system dynamics and control-VI (Italy: Cortina d’Ampezzo), 22–27.
Wood, E. (2022). Facebook and microsoft seed $50m fund for energy access microgrids. Microgrid Knowledge.
Xiaoping, L., Ming, D., Jianghong, H., Pingping, H., and Yali, P. (2010). “Dynamic economic dispatch for microgrids including battery energy storage,” in The 2nd international symposium on power electronics for distributed generation systems, Hefei, China, 16-18 June 2010 (IEEE).
Yu, M., Huang, W., Tai, N., Zheng, X., Wu, P., and Chen, W. (2018). Transient stability mechanism of grid-connected inverter-interfaced distributed generators using droop control strategy. Appl. Energy 210, 737–747. doi:10.1016/j.apenergy.2017.08.104
Zheng, A. (2022). The untapped value of backup generation. Morgantown, West Virginia: US Department of Energy.
Zhu, Y., Yan, J., Sun, Y., and He, H. (2014). Revealing cascading failure vulnerability in power grids using risk-graph. IEEE Trans. Parallel Distributed Syst. 25 (12), 3274–3284. doi:10.1109/tpds.2013.2295814
Nomenclature
Appendix A
Mathematically optimized dispatch of microgrids requires analytical formulations to describe the behavior of the system and the intersectional relationship of decision variables. Table A1 includes the full list of constraints for grid-connected and islanded dispatch.

TABLE A1. Microgrid dispatch constraints.
Keywords: microgrid, climate resilience, microgrid islanding, optimization, microgrid dispatch, energy economics
Citation: Wodicker MR, Nelson J and Johnson NG (2024) Unified dispatch of grid-connected and islanded microgrids. Front. Energy Res. 11:1257050. doi: 10.3389/fenrg.2023.1257050
Received: 11 July 2023; Accepted: 04 December 2023;
Published: 08 January 2024.
Edited by:
Foo Yi Shyh Eddy, Nanyang Technological University, SingaporeReviewed by:
Parikshit Pareek, Los Alamos National Laboratory (DOE), United StatesK. Ramya, Sri Sairam College of Engineering, India
Copyright © 2024 Wodicker, Nelson and Johnson. This is an open-access article distributed under the terms of the Creative Commons Attribution License (CC BY). The use, distribution or reproduction in other forums is permitted, provided the original author(s) and the copyright owner(s) are credited and that the original publication in this journal is cited, in accordance with accepted academic practice. No use, distribution or reproduction is permitted which does not comply with these terms.
*Correspondence: Mackenzie Robert Wodicker, bXdvZGlja2VAYXN1LmVkdQ==