- 1State Grid Hunan Electric Power Company Limited, Changsha, China
- 2Hunan Province Key Laboratory of Intelligent Electrical, Changsha, China
- 3College of Electrical and Information Engineering, Hunan University, Changsha, China
In order for user-side resources to participate in demand response (DR) more accurately, schedulable potential assessment of user-side resources is required. An improved G1 method using Spearman rank correlation (SRC) has been proposed to evaluate the schedulable potential for user-side resources. First, the DR potential evaluation indicator is established on the basis of the characteristics of user-side resources. Second, the resource potential score is calculated by using the improved G1 method using SRC, and the DR potential is obtained. Finally, the resource schedulable capacity of a certain region is obtained. The results show that the method realizes the potential evaluation of user-side resources in a region to participate in DR and provides data support for the power supply company to reasonably schedule user-side resources. Moreover, when compared with existing methods, the proposed method greatly improves the availability of the power company–scheduled regional resources to participate in DR.
1 Introduction
In the traditional coal-based power system, the regulation capacity of the power supply side is no longer sufficient to ensure the safe, reliable, and economic operation of the new energy power system (Niu et al., 2021). In response to achieve the goal of double carbon, clean energy construction, the user-side management can be actively developed (Ibrahim et al., 2022; Mohseni et al., 2022) that shifts from source-follow-loads to source–load interactions (Huang et al., 2019) and the importance of user-side management is increased. The right region at the right time participates in demand response (DR) (Mansouri et al., 2022) to achieve the goal of leveling off load fluctuations, reducing the load peak-to-valley difference, and promoting more renewable energy consumption. When the loads are at their peak, the user-side resources of the region can be called upon to reduce the peak; when the loads are at their trough or when there is a gap in consumption, the user-side resources of the region can be called upon to fill the trough by adjusting the capacity upward. In order to achieve these roles, the user-side resources that can participate in DR have to be reasonably dispatched to improve the stability and economy of grid operations (Vahedipour-Dahraie et al., 2020).
There have been extensive studies on the participation of user-side resources in DR. In practice, DR was initially launched in 2012 in China. It was first applied in several major cities, like Beijing and Suzhou. Then, it has been gradually promoted to many other provinces. The scope, frequency, and intensity of the implementation of DR have been significantly enhanced over the past decades. Since industrial consumption dominates the demand side of the electricity system, China has a significant potential of peak load reduction by implementing DR, and many electric power companies have issued either priced-based or incentive-based policies for DR (Wang et al., 2009; Dong et al., 2016).
By establishing a stage planning–operation model, when the resources participate in power regulation, the impact of different operational characteristics on user-side resources has been analyzed by Pan et al. (2023). Cao et al. (2022) presented a flexibility evaluation method based on a composite sensitivity matrix of water levels with respect to power injections to quantify the time-varying adjustable power domain of pump loads. Chen et al. (2023) establishes a two-tier optimal dispatch model for DR, in which the upper layer considers the user power purchase cost and satisfaction with power consumption and optimizes the user load curve using dynamic tariffs and load transfer characteristics. Zhang et al. (2022) used user historical data to build an evaluation model for DR potential and studied the DR potential of users and devices under different incentives. A K-means clustering algorithm was proposed to identify clustered user loads in Zhang (2022) to evaluate the schedulable potential of user loads for different power usage modes. Nojavan et al. (2017) considered the economic and environmental operation of the battery and photovoltaic (PV) hybrid energy system and proposed a multi-objective optimization model to reduce the dependence of the hybrid system on the power supply load.
The G1 method (Ye et al., 2023) is an improved method of analytic hierarchy process (AHP). The AHP (Dos Santos et al., 2019; Raghav et al., 2022) focuses on the importance of indicators themselves and carries out importance-weighting through the comparison of two indicators, which requires consistency testing. If the inspection is not qualified, it has to be re-weighted. When there are more indicators to be compared, the calculation volume is large and conclusion accuracy is poor. The G1 method determines the order relationship of indicators according to their importance level and sequentially judges the importance of adjacent indicators. The quantitative values are obtained using this method. This method reduces the number of comparisons of indicators and does not require consistency test, which overcomes the aforementioned defects of AHP. Liu et al. (2020) introduced the fuzzy G1 method to quantify the qualitative model to obtain better reliability and robustness. Ye et al. (2023) proposed an improved G1-based method to assess university collaborative innovation performance. However, the determination of indicator importance still lacks objectivity in the G1 method. Therefore, this work objectively determines the importance of adjacent indicators using Spearman rank correlation (SRC) (Stephanou and Varughese, 2021) after expert ranking and then determines the weight of each indicator through the G1 method. The objectivity of the evaluation method is increased to some extent.
This work is organized as follows: in Section 1, an assessment model for DR potential is established. In Section 2, a case study is conducted using the model. In Section 3, the performance of potential models using different comprehensive evaluation methods is compared. The conclusions are provided in Section 4.
2 Schedulable potential assessment model
User-side resources typically include distributed PV, user loads, and energy storage. When the power system issues dispatch instructions for DR, the power system operator shall reasonably request user-side resources to participate in DR based on the situation of user-side resources.
2.1 Flowchart of assessment model
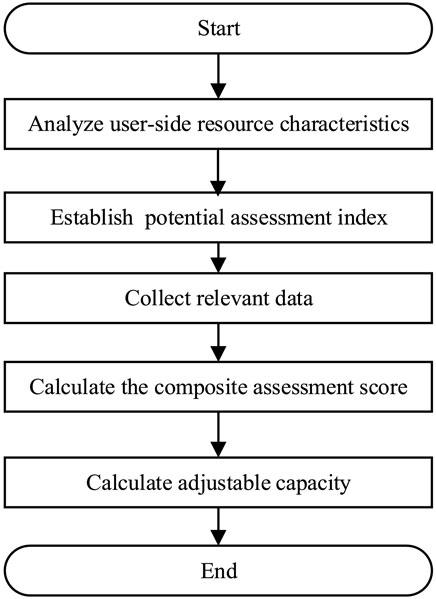
First, the indicator is established for each resource, and then the improved G1 method using SRC is used to obtain a comprehensive score of each resource to evaluate the potential of user-side resources to participate in DR in the region (Eyer and Corey, 2010a; Eyer and Corey, 2010b). Finally, the schedulable capacity of resources is calculated, and the schedulable capacity and time of resource participation in DR are determined on the basis of the schedulable capacity, as shown in Figure 1.
2.2 Schedulable potential assessment indicators
Indicators are established on the basis of the characteristics of distributed PV, user loads, and energy storage. The indicator weights are calculated by the improved G1 method using SRC. The schedulable potential of a region to participate in DR is also determined through simulations.
2.2.1 Distributed PV
The historical PV output data for the same situation are extracted on the basis of the weather and temperature of the regulation day, and the LSTM algorithm (Manowska, 2020; Lin et al., 2022) is used to predict the PV output on the regulation day.
2.2.1.1 DR costs
While the distributed PV participate in the DR process, there is a certain revenue lost and maintenance cost incurred. The DR cost is the sum of the revenue lost per kilowatt of power regulated by distributed PV and the increased maintenance cost.
The DR cost calculation formula is as follows:
where CI,DG is the potential reduction in revenue from distributed PV participation in DR during the day, CM,DG is the potential increase in the maintenance cost, and Pred(t) represents the PV output on the regulation day.
2.2.1.2 DR duration
Since this work sets the upper limit of distributed PV power as the expected power that is generated on the regulation day, the duration of distributed PV being at the upper limit of power can be ignored. Due to the construction cost limitation, distributed PV cannot be at the lower power limit all the time, and the duration of the distributed PV response is the sustainable time in which distributed PV is at the lower power limit when participating in the response under the condition of guaranteed construction costs. Distributed PV has to be consumed to a great extent. Therefore, the duration of distributed PV at the lower limit of power cannot be too long.
2.2.1.3 Schedulable capacity
For distributed PV, the schedulable capacity is the predicted regulated daily output, which is also the upper limit of its output, with a lower limit of 0. The schedulable capacity is as follows:
where PA1 is the total schedulable capacity of PV in a day, and A1 represents the first schedulable capacity in this work. Pred(t) is the predicted PV output on the regulation day and red represents prediction.
2.2.2 Users
2.2.2.1 DR costs
The participation of user-side resources in DR will inevitably affect how or when the user uses electricity. For some large-scale equipment, the loss will be extremely high if their electricity consumption is changed, such as in hospitals and plants, therefore it is inappropriate for such users to participate in DR. However, for some users, changing the way that they use electricity will not affect their production life too much and the cost of loss could be small, such as residential communities and commercial buildings. and such users are suitable to participate in DR. DR costs are calculated by
where c2 is the downward adjustment of DR costs, c’2 is the upward adjustment of DR costs, Cl,u is the cost of loss to the users in DR, C’l,u is user consumption costs when filling valleys for participation in DR, PA2 is the downwardly schedulable capacity for users participating in DR, and P’A2 is the downwardly schedulable capacity for users participating in DR.
2.2.2.2 DR duration
The user load duration indicates the duration for which the user loads can be at the upper or lower power limit with minimal disruption. Considering the coupling between the temperature and power of the thermal storage type industrial loads, the power limit regulation of the loads can last for a short period as the power regulation for a long period can cause the temperature to exceed the range required by the production.
2.2.2.3 Schedulable capacity
For user loads, its schedulable capacity is schedulable loads. Schedulable loads are divided into up- and down-schedulable loads. First, the baseline loads and maximum loads are calculated by using the 7-day working loads before the user regulation day, and the baseline loads are calculated by
where Pu(t) denotes the baseline loads estimated for the time period t on the regulation day; Ld(t) denotes the actual load value of the user for the time period t on the d-th working day; Y is the number of working days, which is set to 7; X is the number of days after removing the highest loads day and the lowest loads day, which is 5; and DMid is 5 days.
The highest load is the average of the highest value of the loads during the day and night in 7 days, and the formula is as follows:
The base loads Pb is the minimum daily electricity consumption of the user, which can be reported by the user himself or calculated by using the holiday loads of the last 3 days of the regulation day, as shown in the following equation:
where Ld(t) denotes the actual load value of the user at time t of the d-th holiday; X is the number of holiday days, which is 3; and Dv is 3 days.
The difference between the baseline loads and base loads gives the user downward schedulable loads PAu, which is used to participate in peak shaving. The difference between the highest loads and baseline loads gives the user upward schedulable load
The schedulable capacities are as follows:
2.2.2.4 Peak-to-valley difference
The formula for calculating the peak-to-valley difference (PVD) is as follows:
2.2.3 Energy storage
2.2.3.1 DR costs
Distributed energy storage, as a new type of load management tool, is generally installed inside industrial and commercial users or parks and plays an increasingly important role in the power system. Currently, energy storage has the advantages of fast response, flexible configuration, short construction cycle, etc. It charges during the valley time but discharges within the peak time. The DR cost of energy storage is determined by the cycle life of the batteries and system cost. DR costs are calculated as follows:
where cl,e is the cost of the energy storage system and cn is the cycle life of energy storage.
2.2.3.2 Rechargeable capacity
The capacity of energy storage systems for regulation purposes is constrained by several factors, such as the amount of energy stored on the previous day, the rated capacity, and its ability to charge and discharge deeply. The schedulable capacity at time t is limited by the capacity stored at the previous time, its rated capacity, and its deep charging and discharging capacity. Meanwhile, when selecting energy storage power stations for DR, it is also necessary to consider whether they can perform deep charging or discharging. For those that can be deeply charged and discharged, its deep charging and discharging capacity is set to 1; for the energy storage system whose deep charging and discharging will affect its life, its capacity is set according to the minimum and maximum intervals of its charge state. If its suitable charge state interval is 15%–85%, its deep discharging capacity is 0.85, and its deep charging capacity is 0.85. Consequently, the higher the deep charging and discharging capacity of energy storage, the greater its potential for DR. Energy storage can be charged and discharged at moment t with a capacity of
where PA3(t) is the available discharge capacity, P’A3(t) is the available charge capacity, De is the deep charge and discharge capacity, Er is the rated capacity, and Ee is the stored charge.
The greater the schedulable capacity of the energy storage, the greater the potential for the energy storage to participate in DR at that moment.
2.3 Integrated evaluation methodology
In this work, the improved G1 method using SRC is used to establish indicators to obtain assessment scores to evaluate the potential for user-side resource aggregation in the region. SRC is a correlation analysis that uses the rank-order magnitude of two variables. It does not require the distribution of the original variables and is a non-parametric statistical method with a wide range of applications. The calculation formula is as follows:
where di = (xi − yi), and xi and yi are the ranks of the two variables sorted by size or superiority, and n is the sample capacity. The range of SRC is [−1, 1], and the larger the absolute value, the stronger the correlation. The stronger the correlation between the indicators, the less information is obtained from them and the smaller the role that they play in comprehensive evaluation. Conversely, the weaker the correlation between indicators, the more information is obtained from them and the greater the role that they play in comprehensive evaluation, with a higher weight. Therefore, the weight ratio of two adjacent indicators is calculated as follows:
The improved G1 method using SRC can be implemented according to the following steps:
Step 1:. Calculate the values of each indicator and perform normalization. Normalization includes positive indicators and negative indicators, and the expressions are presented in Eq. 14 as follows:
Step 2:. Calculate the importance of indicators by providing information on the indicators to the expert group;
Step 3:. Calculate the correlation degree of adjacent indicators by using SRC;
Step 4:. Calculate the indicator weighting factors based on correlation coefficients;
Step 5:. Calculate the overall user score. The formula for the comprehensive score is as follows:
2.4 Calculation of schedulable potential capacity
The score of the user-side resources in the region participating in DR is obtained by the comprehensive evaluation method, and they are selected from the highest to the lowest according to the score, and the expected regulable capacity of the selected resources on the regulation day is aggregated to obtain the regulable capacity of the region participating in DR on the regulation day.
The regulable capacity of the region on the regulation day is as follows:
where D is the schedulable amount when cutting the peak and D′ is the schedulable amount when filling the valley.
3 Case study
According to the data sets, which include actual electricity load data, actual distributed PV generation, energy storage capacity, and battery performance in a certain region, as well as cost and duration data provided by users to the power company, this study selected the end of a certain month as the regulation day.
3.1 Evaluation indicator
3.1.1 Distributed PV
Using the LSTM model, the PV output of the month with the same weather as the regulation day is used as input to predict the distributed PV output data of the regulation day. The total output data of distributed PVs on the regulation day is shown in Table 1. Table 1 also includes the potential loss of participating DR reported by distributed PVs to the power supply company, increased maintenance costs, and duration of responsiveness.
Distributed PV 2 has the smallest output but also has the smallest lost revenue and smallest increased maintenance costs, and PV 3 has the largest output but also has the largest lost revenue and largest increased maintenance costs.
The potential evaluation indicators of distributed PV were calculated, and the calculation results of the evaluation indicators obtained are shown in Table 2.
3.1.2 User load
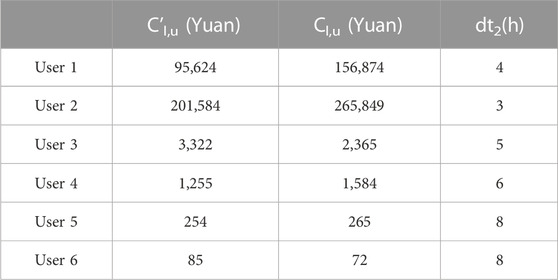
The loss cost of 1 day when the user is in the base load state (each user only maintains basic electricity), the consumption cost of 1 day when the user is in the highest load state (maintaining high-intensity operation), and the duration of DR are shown in Table 3.
User 2 has the highest consumption and loss costs and the lowest DR duration. By contrast, User 6 has a low cost of consumption and loss, with a DR time of up to 8 h.
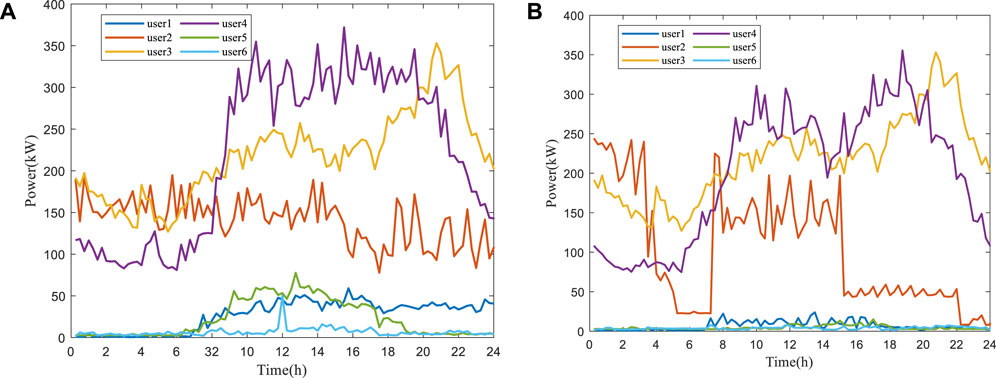
Calculating the user potential assessment indicator also requires the user’s weekday load for the first 7 days and holiday load for 3 days, as shown in Figure 2.
The potential assessment indicators for the users are calculated as described in Section 2.2. The computational results are listed in Table 4:
3.1.3 Energy storage
There are three energy storages in this region, and the basic information is shown in Table 5:
According to Table 5, the potential evaluation indicators of energy storage in this region are calculated as shown in Table 6:
3.2 Resource score
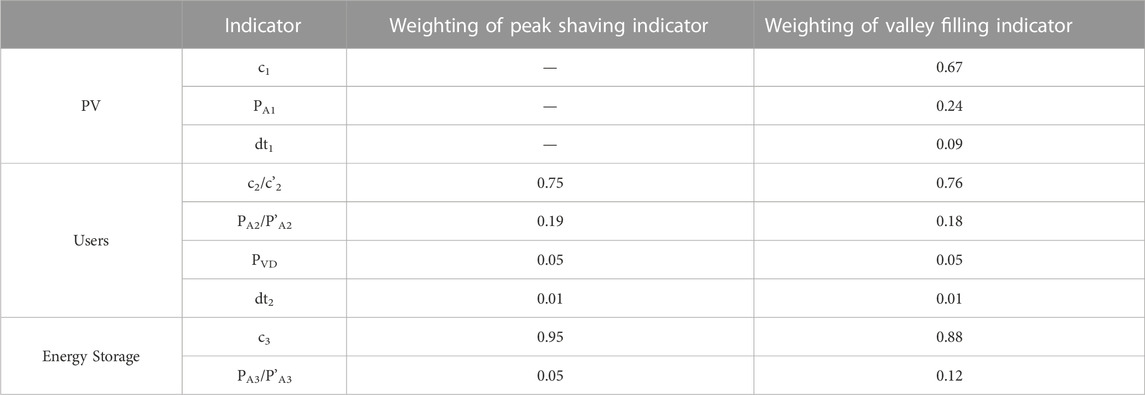
First, the indicators are ranked by importance. In the distributed PV indicator, the importance is c1 >PA1 > dt1, in the user indicator, the importance is c2/c'2 > PA2/P'A2 > PVD > dt2, in the storage indicator, the importance is c2/c'2 >PA2/P'A2 > dt2, in the storage indicator, the importance of c1 > PA1 > dt2.
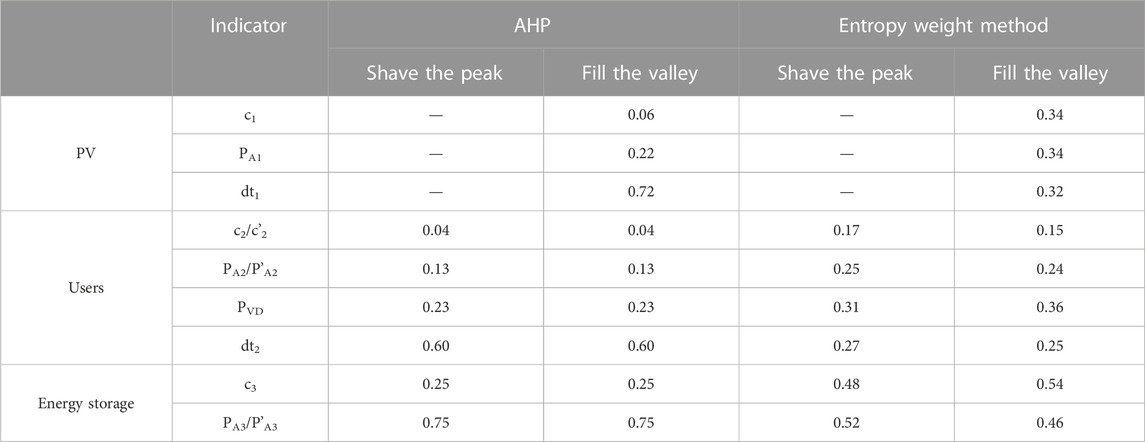
Then, SRC is used to calculate the correlation degree rs of adjacent indicators and the weight ratio wij. Finally, the weight Wj of each indicator is calculated according to the weight ratio, and the weight of each resource indicator is obtained as shown in Table 7.
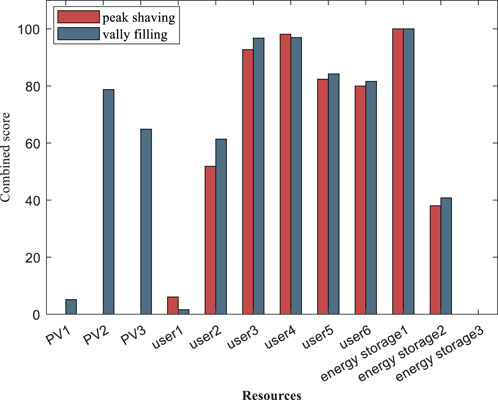
According to Eq. 15, the comprehensive score of each resource is calculated, and the results obtained are shown in Figure 3.
According to the resource potential score, resources that can participate in peak shaving or valley filling in DR are known. For peak shaving, user 4 has the highest score among users, and energy storage 1 has the highest score among energy storages; for valley filling, user 3 has the highest score among users, PV 2 has the highest score among PVs, and energy storage 1 has the highest score among energy storage. Those with high scores will have priority to participate in DR.
3.3 Schedulable capacity calculation
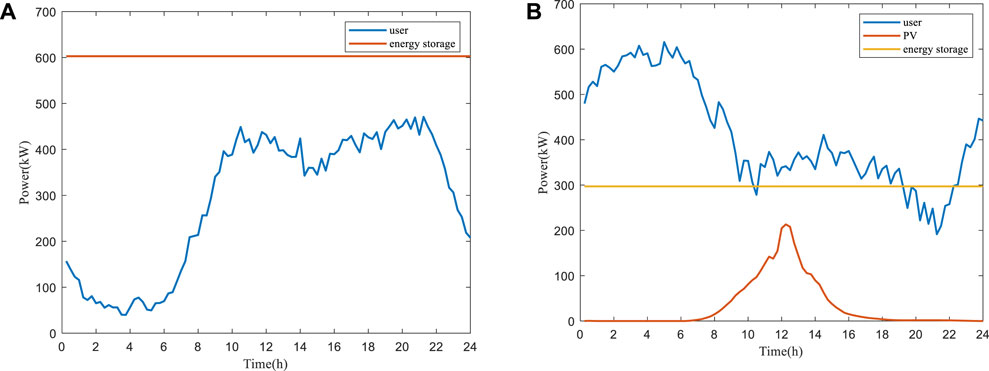
The customer-side resources involved in DR in the region are aggregated and the schedulable capacity for each time period calculated. The schedulable capacity of energy storage has to change according to the response capacity of the previous moment, as shown in Eq. 11. However, only potential assessments are carried out without the demand response, so the adjustable capacity of energy storage is left unchanged. The obtained schedulable capacity of each resource in the region is shown in Figure 4.
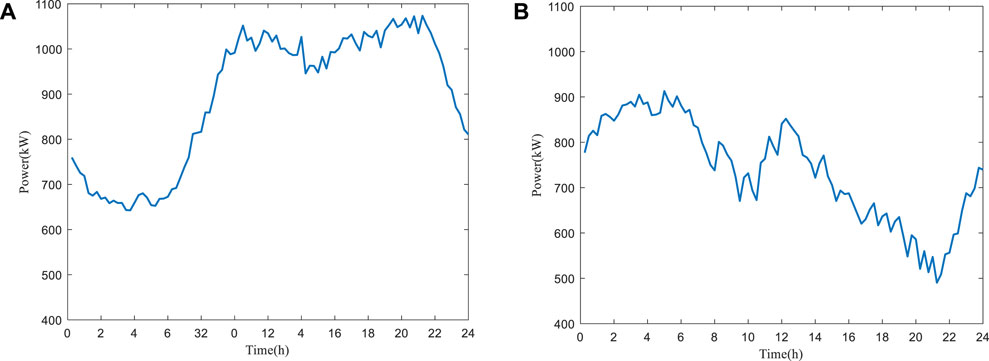
The resulting schedulable capacity after the aggregation of user-side resources in this area is shown in Figure 5.
As shown in Figure 6, when peak shaving is required, this area between collection points 32 and 92, i.e., between 8 and 23, has a greater schedulable potential and can be adjusted to a capacity of 850 kW or more for peak shaving, and when valley filling is required, this area between collection points 0 and 36, 43, and 59, i.e., between 0 and 9 and between 10:30 and 14:00, has a greater schedulable potential and the capacity of 750 kW or more can be adjusted to fill the valley. Therefore, if the grid is to respond to demand, this area can be selected for DR if the peak shaving time is between 8:00 and 23:00 or the valley filling time is between 0:00 and 9:00 and between 10:30 and 14:00.
4 Comparative analysis
4.1 Schedulable potential score
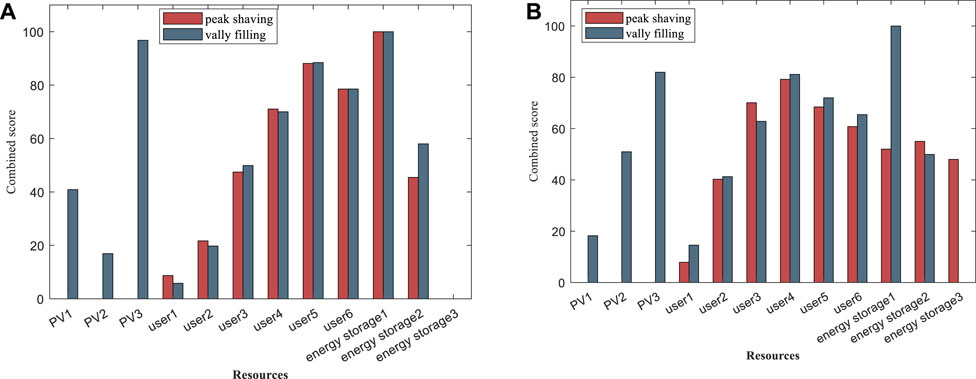
The AHP described by Settou et al. (2021) and the entropy weight method described by Liu et al. (2022) are compared with the G1 algorithm based on the SRC used in this work. Various types of resource indicators calculated by the two models are shown in Table 8.
The potential scores of each resource are obtained by calculating the indicators as shown in Figure 6.
Figure 7 shows the resource potential scores obtained by the AHP that have been described by Settou et al. (2021) and the entropy weight method described by Liu et al. (2022) that are different from the scores obtained in this work. The AHP yields the highest valley filling score for distributed PVs to become PV 3. The user with the highest peak shaving and valley filling score is user 5, while energy storage 1 has the highest score for energy storage. On the other hand, the entropy weight method determines whether PV 3 achieves the highest score for valley filling. User 4 has the highest scores for both valley filling and peak shaving. Energy storage 1 obtains the highest score for valley filling, while energy storage station 2 has the highest score for peak shaving.
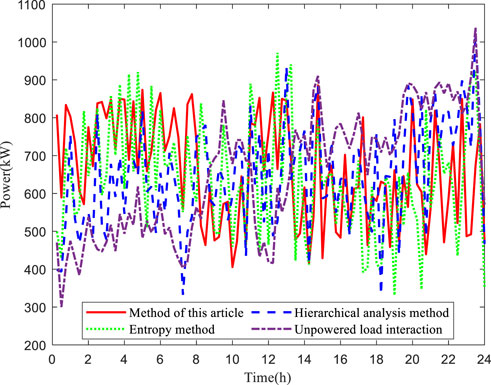
To aggregate the selected resources in the descending order according to the AHP and entropy weight methods for participation in DR, the NSGA-III optimization algorithm is used to calculate the results of DR. The effectiveness of the three methods is analyzed based on the results of DR.
4.2 Analysis results
A comparison of the fluctuations of the load curves after the participation of DR for schedulable potential resources selected by the three methods is shown in Figure 7.
The results are shown in Table 9.
As shown in Table 9, all these three methods have a great effect on cutting the peak-to-valley difference, but the method proposed in this work has the smallest value and best performance for the peak-to-valley difference. Regarding the power supply cost, the results for these three methods are very close to each other, and the proposed method also has the minimum value.
Clearly, the method used in this work can effectively smooth the load fluctuation and reduce power supply costs. Therefore, the schedulable potential assessment model used in this work can more effectively explore the user-side resources that can participate in DR and improve the ability of power supply companies to dispatch regional resources to participate in DR.
5 Conclusion
This study evaluates the potential of user-side resources by establishing a potential evaluation index system and a comprehensive evaluation method. The improved G1 method using SRC retains the subjectivity of the importance ranking of G1 method weights, while increasing the objectivity of calculating weights through SRC. When compared with other methods, the evaluation results of this method are more accurate and effective in regulating user-side resources in the power grid.
The established schedulable potential assessment model reflects the capability of individual resources to participate in DR from the perspective of their characteristics. Its utilization can explore and aggregate the user-side resources. It is beneficial for peak shaving and valley filling and greatly improves the utilization efficiency of user-side resources.
Data availability statement
The data analyzed in this study are subject to the following licenses/restrictions: The data used to support the findings of this study were supplied by the Science and Technology Project of State Grid Hunan Electric Power Co., Ltd. Requests to access these data sets should be directed to RW, d3Vyb25nQGhudS5lZHUuY24=.
Author contributions
HW and MY proposed the concepts and ideas. XC and JX analyzed the results. RW and QF wrote and revised the contents of the manuscript. All authors contributed to the article and approved the submitted version.
Funding
This work is financially supported by the Science and Technology Project of State Grid Hunan Electric Power Co., Ltd. No. 5216AG21N00Z.
Acknowledgments
The authors of this work acknowledge the contributions of the State Grid Hunan Electric Power Company Limited and Hunan Province Key Laboratory of Intelligent Electrical.
Conflict of interest
Authors HW, MY, XC, and JX were employed by the State Grid Hunan Electric Power Company Limited.
The remaining authors declare that the research was conducted in the absence of any commercial or financial relationships that could be construed as a potential conflict of interest.
Publisher’s note
All claims expressed in this article are solely those of the authors and do not necessarily represent those of their affiliated organizations, or those of the publisher, editors, and reviewers. Any product that may be evaluated in this article, or claim that may be made by its manufacturer, is not guaranteed or endorsed by the publisher.
References
Cao, Y., Zhou, B., Chung, C. Y., Shuai, Z., Hua, Z., and Sun, Y. (2022). Dynamic modelling and mutual coordination of electricity and watershed networks for spatio-temporal operational flexibility enhancement under rainy climates. IEEE Trans. smart grid 14, 3450–3464. doi:10.1109/tsg.2022.3223877
Chen, H. W., Lin, S. H., and Zhu, J. Q. (2023). Double-layer optimization of economic dispatch in microgrid considering demand-side response. Electr. Autom., 79–81+84.
Dong, J., Xue, G., and Li, R. (2016). Demand response in China: regulations, pilot projects and recommendations – a review. Renew. Sustain. Energy Rev. 59, 13–27. doi:10.1016/j.rser.2015.12.130
Dos Santos, P. H., Neves, S. M., Sant’Anna, D. O., de Oliveira, C. H., and Carvalho, H. D. (2019). The analytic hierarchy process supporting decision making for sustainable development: an overview of applications. J. Clean. Prod. 212, 119–138. doi:10.1016/j.jclepro.2018.11.270
Eyer, J., and Corey, G. (2010a). Energy storage for the electricity grid: benefits and market potential assessment guide. Sandia Natl. Lab. 20 (10), 5. doi:10.2172/1031895
Eyer, J. M., and Corey, G. P. (2010b). Energy storage for the electricity grid: benefits and market potential assessment guide: a study for the DOE Energy Storage Systems Program (No. SAND2010-0815). Albuquerque, NM, and Livermore, CA (United States): Sandia National Laboratories SNL.
Huang, W., Zhang, N., Kang, C., Li, M., and Huo, M. (2019). From demand response to integrated demand response: review and prospect of research and application. Prot. Control Mod. Power Syst. 4, 12–13. doi:10.1186/s41601-019-0126-4
Ibrahim, C., Mougharbel, I., Kanaan, H. Y., Abou Daher, N., Georges, S., and Saad, M. (2022). A review on the deployment of demand response programs with multiple aspects coexistence over smart grid platform. Renew. Sustain. Energy Rev. 162, 112446. doi:10.1016/j.rser.2022.112446
Lin, J., Ma, J., Zhu, J., and Cui, Y. (2022). Short-term load forecasting based on LSTM networks considering attention mechanism. Int. J. Electr. Power & Energy Syst. 137, 107818. doi:10.1016/j.ijepes.2021.107818
Liu, J., Li, Y., Lu, Y., Fu, X., and Yan, S. (2020). Research on the influence factors of ubiquitous power Internet of things for promoting consumption of wind power based on fuzzy G1-ISM in China. Int. J. Electr. Power & Energy Syst. 121, 106124. doi:10.1016/j.ijepes.2020.106124
Liu, Z., Xie, Q., Dai, L., Wang, H., Deng, L., Wang, C., et al. (2022). Research on comprehensive evaluation method of distribution network based on AHP-entropy weighting method. Front. Energy Res. 10, 975462. doi:10.3389/fenrg.2022.975462
Manowska, A. (2020). Using the LSTM network to forecast the demand for electricity in Poland. Appl. Sci. 10 (23), 8455. doi:10.3390/app10238455
Mansouri, S. A., Nematbakhsh, E., Ahmarinejad, A., Jordehi, A. R., Javadi, M. S., and Matin, S. A. A. (2022). A Multi-objective dynamic framework for design of energy hub by considering energy storage system, power-to-gas technology and integrated demand response program. J. Energy Storage 50, 104206. doi:10.1016/j.est.2022.104206
Mohseni, S., Brent, A. C., Kelly, S., and Browne, W. N. (2022). Demand response-integrated investment and operational planning of renewable and sustainable energy systems considering forecast uncertainties: a systematic review. Renew. Sustain. Energy Rev. 158, 112095. doi:10.1016/j.rser.2022.112095
Niu, T., Hu, B., Xie, K., Pan, C., Jin, H., and Li, C. (2021). Spacial coordination between data centers and power system considering uncertainties of both source and load sides. Int. J. Electr. Power & Energy Syst. 124, 106358. doi:10.1016/j.ijepes.2020.106358
Nojavan, S., Majidi, M., Najafi-Ghalelou, A., Ghahramani, M., and Zare, K. (2017). A cost-emission model for fuel cell/PV/battery hybrid energy system in the presence of demand response program: ε-constraint method and fuzzy satisfying approach. Energy Convers. Manag. 138, 383–392. doi:10.1016/j.enconman.2017.02.003
Pan, C., Fan, G. B., Bao, Y. T., Li, R. Y., Yu, F. J., and Bao, F. (2023). Collaborative control of demand-side resources participating in distributed generation integration. Acta Energiae Solaris Sin., 306–315. doi:10.19912/j.0254-0096.tynxb.2021-0170
Raghav, L. P., Kumar, R. S., Raju, D. K., and Singh, A. R. (2022). Analytic hierarchy process (AHP)-swarm intelligence based flexible demand response management of grid-connected microgrid. Appl. Energy 306, 118058. doi:10.1016/j.apenergy.2021.118058
Settou, B., Settou, N., Gouareh, A., Negrou, B., Mokhtara, C., and Messaoudi, D. (2021). A high-resolution geographic information system-analytical hierarchy process-based method for solar PV power plant site selection: a case study Algeria. Clean Technol. Environ. Policy 23, 219–234. doi:10.1007/s10098-020-01971-3
Stephanou, M., and Varughese, M. (2021). Sequential estimation of Spearman rank correlation using Hermite series estimators. J. Multivar. Analysis 186, 104783. doi:10.1016/j.jmva.2021.104783
Vahedipour-Dahraie, M., Rashidizadeh-Kermani, H., Shafie-Khah, M., and Catalão, J. P. (2020). Risk-averse optimal energy and reserve scheduling for virtual power plants incorporating demand response programs. IEEE Trans. Smart Grid 12 (2), 1405–1415. doi:10.1109/tsg.2020.3026971
Wang, J., Cary, N. B., Hu, Z., and Tan, Z. (2009). Demand response in China. Energy (4). doi:10.1016/j.energy.2009.06.020
Ye, F., Sun, J., Wang, Y., Nedjah, N., and Bu, W. (2023). A novel method for the performance evaluation of institutionalized collaborative innovation using an improved G1-CRITIC comprehensive evaluation model. J. Innovation Knowl. 8 (1), 100289. doi:10.1016/j.jik.2022.100289
Zhang, H. L. (2022). Research on the adjustment capacity characterization and response strategy of flexible load group for power regulation. Jilin City, China: Northeast Electric Power University. Doctoral dissertation. doi:10.27008/d.cnki.gdbdc.2022.000002
Keywords: Spearman rank correlation, G1 method, demand response, user-side resource, schedulable potential assessment
Citation: Wu H, Yang M, Wu R, Fan Q, Chen X and Xiao J (2023) Assessment of schedulable potential for user-side resources participating in demand response based on improved G1 method using SRC. Front. Energy Res. 11:1248322. doi: 10.3389/fenrg.2023.1248322
Received: 27 June 2023; Accepted: 06 October 2023;
Published: 23 October 2023.
Edited by:
Ting Wu, Harbin Institute of Technology (Shenzhen), ChinaReviewed by:
Jiefeng Liu, Guangxi University, ChinaHaoxi Cong, North China Electric Power University, China
Copyright © 2023 Wu, Yang, Wu, Fan, Chen and Xiao. This is an open-access article distributed under the terms of the Creative Commons Attribution License (CC BY). The use, distribution or reproduction in other forums is permitted, provided the original author(s) and the copyright owner(s) are credited and that the original publication in this journal is cited, in accordance with accepted academic practice. No use, distribution or reproduction is permitted which does not comply with these terms.
*Correspondence: Rong Wu, d3Vyb25nQGhudS5lZHUuY24=
 Hairu Wu1,2
 Rong Wu