 Changbao Xu
 Yu Wang
- Electric Power Research Institute of Guizhou Power Grid Co., Ltd, Guiyang, China
The UAV inspection method is gradually becoming popular in transmission line inspection, but it is inefficient only through real-time manual observation. Algorithms are available to achieve automatic image identification, but the detection speed is slow, and video image processing is not possible. In this paper, we propose a fast detection method for transmission line defects based on YOLO v3. The method first establishes a YOLO v3 target detection model and obtains the a priori size of the target candidate region by clustering analysis of the training sample library. The training process of the model is accelerated by adjusting the loss function to adjust the learning direction of the model. Finally, transmission line defect detection was achieved by building a transmission line defect sample library and conducting training. The test results show that compared with other deep learning models, such as Faster R-CNN and SSD, the improved model based on YOLO v3 has a huge speed advantage and the detection accuracy is not greatly affected, which can meet the demand for automatic defect recognition of transmission line inspection videos.
1 Introduction
With the continuous expansion of the scale of the power grid, the workload of line inspection has increased; meanwhile, the traditional manual inspection method is costly and inefficient, and there are certain dangers in implementation. In recent years, the State Grid and various electric power scientific research institutions have invested a lot of manpower and material resources to carry out UAV power inspection research, including UAV flight control technology, transmission line inspection aerial photography target identification, and fault detection technology research. The use of UAV inspection has the advantages of low cost, high efficiency, and a stronger ability to adapt to complex environments, and it can quickly collect image and video information on transmission lines, which greatly reduces the difficulty and danger of inspection work. Therefore, UAV inspection has a broad application prospect in transmission line inspection (YAN et al., 2017; Cao et al., 2021). The defect recognition method based on deep learning can automatically analyze unstructured data effectively and use deep learning algorithms to quickly process the images collected during inspection to achieve automatic detection and recognition of abnormal states of transmission line equipment, which is of great significance for enhancing the intelligence of power grids (LI et al., 2017; Li et al., 2021; WEN et al., 2021). UAVs ual recognition of the collected images. In order to further improve the automation of machine patrol, many scholars have proposed image-based methods for the identification of transmission line equipment and defects. Most of the algorithms currently applied for transmission line target detection need to rely on manual extraction of image features and then segmentation of targets in images by the Hough transform, Canny operator, and Gabor operator. The effectiveness of (Nguyen et al., 2018; Chen et al., 2021; Deng et al., 2021) these algorithms depend on the extraction of features, which, on one hand, is a complex task requiring strong expertise; on the other hand, there are numerous transmission line defects, which are not sufficiently expressed by manually extracted features, resulting in a single type of detection target for traditional algorithms. Some algorithms use support vector machines, neural networks, and other shallow learning algorithms to predict the target type (Yu-min et al., 2010; Cerón et al., 2014; JIANG, 2017), but they still need to extract the image features first. In recent years, machine vision technology based on deep learning has been greatly developed, and the corresponding image target detection algorithms have also achieved good performance. After the extraordinary performance of AlexNet in the image recognition competition in 2012, deep learning algorithms based on convolutional neural networks (CNNs) have become the main research direction for image classification and target detection (Li et al., 2008). Deep learning-based target detection algorithms can be divided into “dual-order method” and “single-order method”. The "dual-order method” has high accuracy, while the “single-order method” is fast, and the representative algorithms are YOLO (Simonyan and Zisserman, 2014; He et al., 2015) and SSD (Ren et al., 2017). The “double-order method” has been studied in the image detection of power system equipment (Joseph and Ali, 2016a; Redmon et al., 2016; WANG et al., 2017), but it is still in the theoretical research stage, and its detection speed is slow, which cannot meet the demand of real-time detection. In the daily UAV inspection work, a large amount of image and video data will be generated, which requires a very high speed for the target detection algorithm. Therefore, this paper establishes a defect recognition model of transmission line machine inspection images based on the YOLO algorithm using the inspection images obtained from actual engineering operation and maintenance for training (Hui et al., 2018; Lei and Sui, 2019; Wang et al., 2021). Through parameter adjustment, the practical application ability of the defect detection model can be improved, and the real-time defect detection of the transmission line machine patrol image can be realized, which has high engineering practicability (Gong et al., 2003; Liu et al., 2020; Wang et al., 2020).
2 Inspection image defect detection model construction
The YOLO algorithm directly regresses the target location and target class at the output layer to achieve end-to-end training and detection, which is different from the original dual-order target detection method based on region recommendations. YOLO v3 adds multi-scale prediction, which makes the network more capable of detecting targets with a wide range of size variations and has higher detection speed and recognition accuracy (He et al., 2015). In this paper, we detect and identify equipment defects in transmission line inspection images based on the YOLO v3 model, and the model framework is shown in Figure 1.
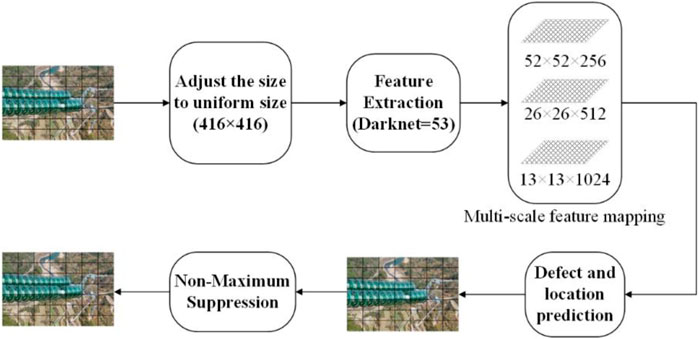
FIGURE 1. YOLO v3 model framework.
For any machine patrol picture, first, the size is adjusted to a uniform size, and the picture is divided into S × S regions; then, the picture features are extracted by multiple convolution layers for each region. If the center of an electric equipment defect falls in this region, the region is responsible for predicting this defect. The center position and size of the equipment defect are adjusted by regression. The output of the model prediction is S × S × (B × 5 + C), i.e., S × S regions, and each region outputs B different sizes of defect prediction checkboxes and C defect type information, while for each defect prediction checkbox, there are four coordinate values and one confidence value. Finally, the model uses extreme value suppression to remove duplicate checkboxes and then predicts the actual defect types and locations of electrical equipment contained in the inspection images.
2.1 Model initialization inspection image defect detection
In this model, the input inspection images are divided into detection areas according to three scales, with 19 × 19, 38 × 3,876 × 76 detection areas. Subsequently, the nine prior defect sizes obtained from the sample library are assigned to the scale of the three detection regions, according to their size, meaning that there are three prior defect detection anchor frames in each region. For each scale detection area, if the center of the defect is within a region, that region is responsible for predicting this object, as shown in Figure 2.
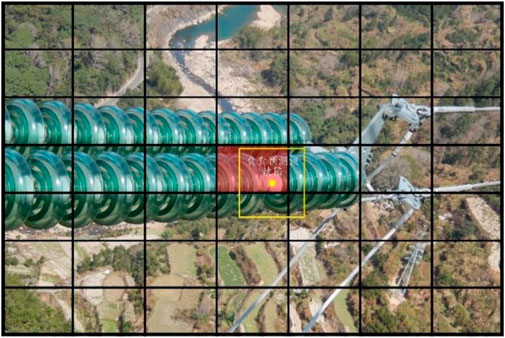
FIGURE 2. Target prediction.
2.2 Multiscale feature extraction of patrol image based on the convolutional neural network
The model directly performs feature extraction on the whole input image and achieves better detection of both large and small targets. In this study, the DarkNet-53 convolutional neural network framework is used to extract the features of inspection images, which consists of 53 convolutional layers, and each convolutional layer is followed by a linear segmentation function with leakage (Leaky ReLu) as the activation function to adapt to the nonlinear case, where five convolutional kernels have a step size of 2. The convolution result is up-sampled to obtain a multi-scale feature map. The feature extraction model is shown in Figure 3.
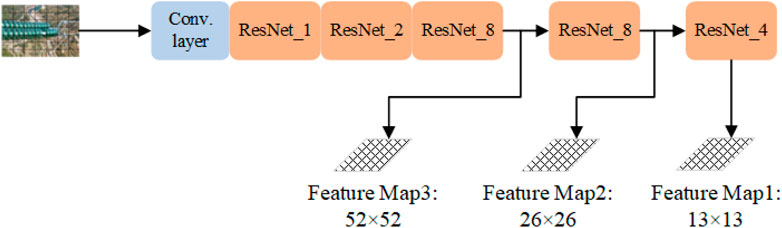
FIGURE 3. Feature extraction network.
The model inputs a patrol image with an arbitrary RGB color pattern, and for the convolution layer, the feature vector output after the lth layer convolution operation can be expressed by Eq. 1.
Here, the range of i, j, k, l, and m depends on the structure of DarkNet-53; the range is not stated here but is intended to introduce the mathematical model of the network, where i represents the number of feature maps, j represents the number of convolution kernels, k represents the number of convolution kernels, and l represents the number of layers of the network. Mj represents the output feature map.
Instead of pooling layers, this model uses convolution kernels with step size 2 in some of the convolution layers. After convolution operations with these convolution kernels, the feature vector size of the image becomes 1/4 of the original size, and the depth of the feature vector gradually deepens with the increase in the convolution window.
2.3 Defect type and location prediction based on logistic regression
This model first clusters the defect sizes of the samples before training to obtain nine priori anchor frames, and each scale feature map is responsible for detecting three scales of anchor frames. In the YOLO algorithm, the image is first cut into N × N grids, and a specified number of candidate boxes are selected for each grid, where N represents the number of meshes of the cut image. The range of N generally depends on the empirical value. The image feature vectors extracted by the DarkNet-53 convolutional neural network are input to the fully connected layer, which performs logistic regression and finally outputs a prediction vector of dimension N × N × [3 × (4 + 1 + 20)]; it means, for three scales of feature maps, each has N × N regions, and the position information and confidence of the three prediction frames in each region and the defect type information form a 105-dimensional feature vector. The use of 3, 4, 1, and 20 depends mainly on the empirical values widely used after the YOLO algorithm.
2.3.1 Defect type prediction
A total of 20 equipment defect types are designed in this research, and each box uses a set of 20-dimensional vectors to represent the defect types. If the prediction is for the nth defect, the first value in the vector is 1 and the rest of the values are 0. Each prediction box has a confidence level, including the possibility of having a target in the region, the defect type, and the IOU value, as shown in Eq. 3:
The model determines the possibility of a class l fault in a region based on the features extracted from the DarkNet network as
2.3.2 Defect location prediction
The cross-merge ratio
Here, A and B stand for the actual area and the predicted area of the equipment defect, respectively. The intersection ratio is the ratio of the intersection of the predicted area and the actual area to their concurrent set.
To overcome the instability of direct prediction, this model uses a relative position to predict the location of the defect, i.e., the predicted offset of the center of the defect relative to the top left corner vertex of the region for positioning, which is shown as in Figure 4.
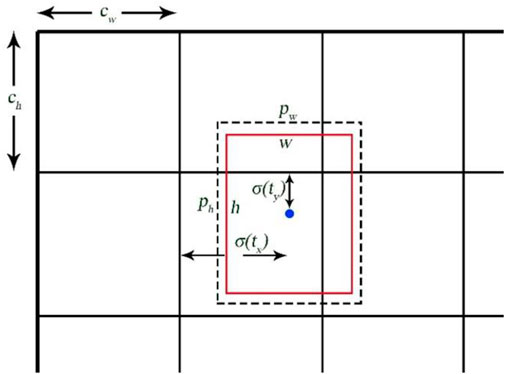
FIGURE 4. Feature extraction network.
The learning equation for the location of the center point is as follows:
Here,
The adjustment formula of the predicted anchor box size is expressed as follows:
Here,
When learning the anchor box parameters, a target score is first given to the region inside the box to obtain the confidence level, and if the confidence level of the anchor box is very low, the anchor box is directly ignored. For the checkboxes with a confidence level higher than 0.5, if the mutual IOU value is high and the same object is predicted, only the anchor box with the highest confidence level is retained for learning to improve the learning speed.
2.3.3 Repeat detection target elimination based on non-extreme value suppression
With the aforementioned steps, we will get too many anchor frames, so we need to choose wisely to eliminate duplicate anchor frames. In this article, we choose the maximum suppression method to eliminate duplicate anchor frames. First, low-confidence anchor frames are suppressed, and these anchor frames most likely do not contain the target to be detected. The remaining check boxes are then categorized according to the category of the predicted defect. For targets that predict the same category of defects, first, the target with the highest confidence is selected. If the IOUs between this anchor box and other anchor boxes are higher than 0.5, anchor boxes with lower suppression thresholds and anchor boxes below 0.5 will not be processed. After that, the operation is repeated for the remaining unhidden anchor boxes. At the end of the loop, the remaining anchor frame is considered the defect target for the final prediction.
3 Model training and optimization based on the patrol inspection image sample library
This experiment is set up under the Python framework with Python version 1.5.1 using the Windows 10 operating system. Among them, CUDA version 11.4 and Python version 3.8 are used in the software environment. The hardware environment is the Windows 10 operating system, the CPU model of the testing device is 11th Gen Intel (R) Core (TM) i5-11400 @ 2.60GHz, and the GPU model is NVIDIA GeForce RTX 3060.
3.1 Training sample library construction
In this paper, 5,000 inspection images obtained from a province are used to form a training sample library, of which 4,000 images form the training set and another 1,000 images form the test set. The sample images are standardized according to the Pascal VOC standard (LUO et al., 2021). The marking objects include overhead line defects, pole defects, insulator defects, and hardware defects; all the aforementioned objects constitute a sample library of typical defects of transmission lines. The size of the inspection images is not exactly the same, and considering that the shooting targets are often located in the middle of the images during the UAV inspection, in order to avoid compression and deformation of the images due to different sizes and to facilitate uniform data processing by the model, this paper crops the training images from the center to a 3:2 size and adjusts the pixels to 4,800 × 3,200 to remove the irrelevant parts of the edges. The defect diagrams of towers, fittings and insulators are shown in Figures 5-7 respectively.
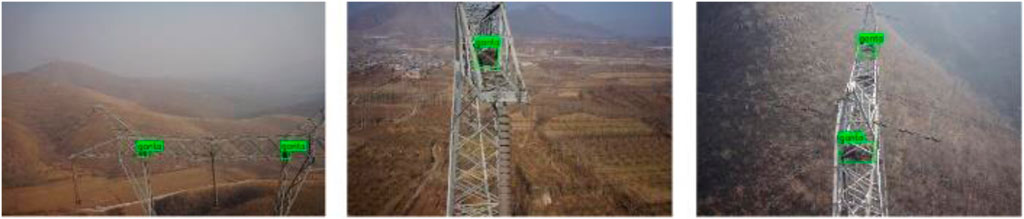
FIGURE 5. Example of a tower defect.
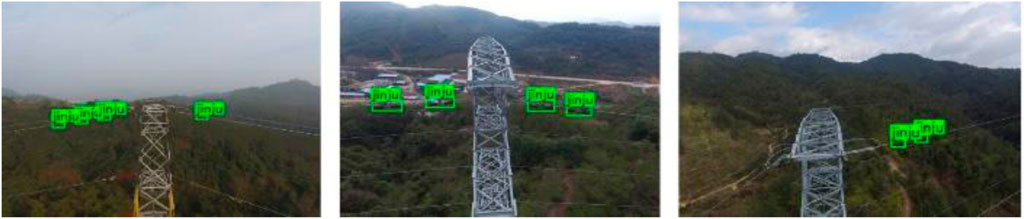
FIGURE 6. Example of fitting defects.
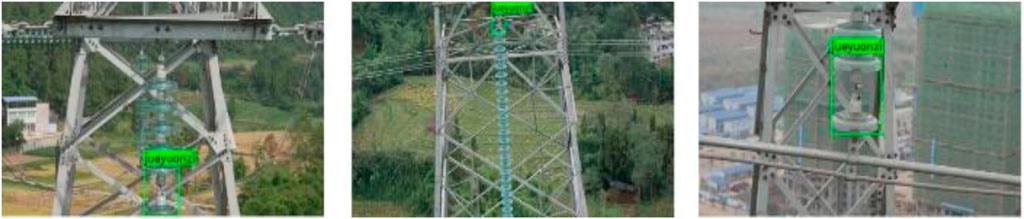
FIGURE 7. Example of insulator defects.
3.2 Priori defect size selection based on a clustering algorithm
In this paper, we use a clustering algorithm to obtain the a priori dimensions of defects. The initial parameters of the model have an impact on the training convergence speed and training effect, and a good initial value can accelerate the convergence of the model. Through the analysis of the sample images, we found that although the fault pattern in different pictures has discrepancies, the size of the same class of faults is very close. For example, insulator faults and tower faults are generally larger in size, and the area of conductor faults is smaller. Therefore, in this study, k-clustering is used for defect sizes, and nine clustering centers are obtained. The values of these nine clustering centers are used as the sizes of the priori anchor frames of the defect detection model, which makes the selection of anchor frames better match the sizes of defects in transmission lines, speeds up the convergence of the model, and improves the accuracy of defect detection. As shown in Table 1, the prior dimensions of each anchor frame are presented.
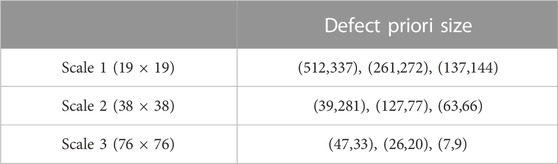
TABLE 1. Priori size.
3.3 Loss function design
The loss function of this model consists of three parts: the coordinate loss function, category loss function, and confidence loss function. The prediction results of the three scales are calculated separately and finally summed to obtain the loss function of the whole network. The coordinate loss function is expressed as follows:
The category loss function is written as follows:
The confidence loss function is expressed as follows:
Here,
3.4 Loss function weight adjustment
By analyzing the inspection images, the result shows that there are no more than four defects on most of the images, while the number of grid regions generated by each image is much larger than the number of defects. So this paper adjusts the loss weights of the regions with and without targets by parameter
There are 20 types of defects in the design of the model, while there are only four coordinate parameters, which would result in very little influence of the coordinate parameters on the loss function if added directly. In order to increase the influence of position coordinates on the loss function to speed up the convergence, this paper adds weight
4 Model testing and result analysis
Although the YOLO algorithm has been updated to the 8th or even 9th generation versions, its essence has not changed much. Moreover, under the version change, the new versions all add new modules on the basis of the version of YOLO v3, thereby increasing the complexity of the model. This corresponds to making the model slower. For this reason, the most classic YOLO v3 version is used for this article. This version is different from the 1st and 2nd generation versions; not only does it have a large change in accuracy but it is also superior in speed. For this reason, the classic YOLO v3 algorithm was chosen for this paper. This section conducts simulation experiments based on the YOLO algorithm on the transmission line inspection image dataset and compares the performance with other deep learning algorithms to explore the advantages and shortcomings of the YOLO algorithm in transmission line inspection applications. Improve the change of the loss function during the training of the algorithm, as shown in Figure 8.
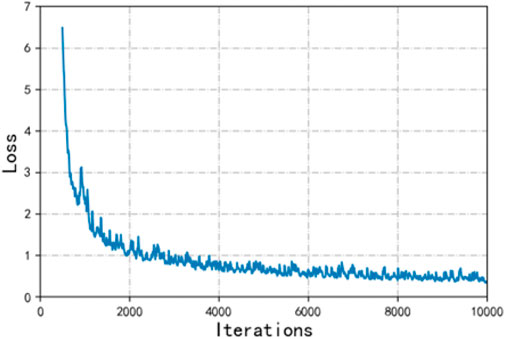
FIGURE 8. Improved loss schematic representation of YOLO v3.
4.1 Defective sample analysis
The dataset used in this paper can be divided into two parts, the training and test sets. The respective types of faults contained and the corresponding numbers are shown in Table 2.
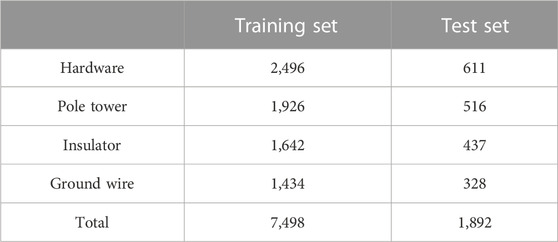
TABLE 2. Defect number statistics results.
In the training set, the proportions of the four types of faults are 33.29%, 25.69%, 21.90%, and 19.12%, respectively; in the testing set, the proportions of the four types of faults are 32.29%, 27.27%, 23.10%, and 17.34%, respectively. From the statistical results, it can be seen that the number of the four types of faults is comparable, which can better meet the needs of model training and testing.
4.2 Introduction of model evaluation indicators
In this paper, the detection effectiveness of the transmission line defect detection model is evaluated by using the recall rate (recall), the precise rate (precise), and mAP (mean average precision). The recall rate is the proportion of correctly detected targets to all targets to be detected. For any detection frame with a confidence level higher than a set threshold, if the intersection ratio with a marked target is greater than 0.5 and the predicted category matches the target, the detected target is considered correct. The number of all detected correct detection frames is counted and recorded as NTP, the actual number of targets to be detected is NG, and the calculation formula for the check-all rate is shown as follows:
Similarly, the number of detection frames with all confidence levels satisfying the requirement is ND, and the precise rate is calculated as follows:
mAP combined with the recall rate and the precise rate is usually used as a more comprehensive indicator to evaluate a model . Improve the change of Recall during the training of the algorithm, as shown in Figure 9.
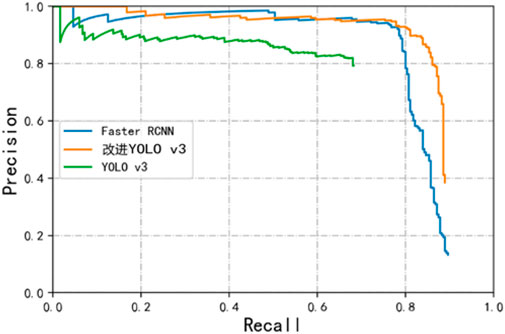
FIGURE 9. P–R curves of individual algorithms.
4.3 The result analysis of the patrol inspection image defect recognition
In this research, the trained model is used to conduct defect localization and identification tests on the inspection images acquired in actual operation and maintenance, and the prediction is considered accurate when the intersection ratio between the predicted target and the actual target is greater than 0.5. Several models with quality results are trained to serve as a comparison, and the experimental results are presented in Table 3.
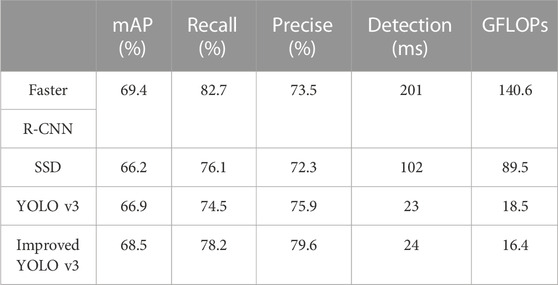
TABLE 3. Model results' comparison.
The effects of defects detected by different algorithms are shown in Figures 10-13. Wherein Figure 10 is the insulator defect detection effect diagram, Figure 11 is the ground wire defect detection effect diagram, Figure 12 is the hardware defect detection effect diagram, and Figure 13 is the tower defect detection effect diagram. Table 2 shows that Hardwa corresponds to the label “dachicun”, PoLE Towr corresponds to “ganta”, Insulator corresponds to “jueyuanzi”, and Ground wire corresponds to “dadixian”. Based on the experimental results, it can be seen that although SSD and YOLO v3 of the single-order method are slightly inferior to Faster R-CNN of the two-order method in terms of performance, they have obvious advantages in terms of computational speed, and the prediction time of YOLO v3 is only about 1/9 of that of Faster R-CNN. Because of the two-order method, it is necessary to first show the top candidate frame and then proceed to the next step, while the single-order method directly realizes the end-to-end one-time process to complete the object detection task. So SDD and YOLO v3 have a clear advantage in speed. The double-order algorithm Faster R-CNN is slow, but its improvement on mAP is not obvious, and it is difficult to achieve fast object detection tasks. The improved YOLO v3 algorithm has only 16.4 GFLOPs. Compared to other algorithms and unimproved algorithms, the improved algorithm has a significant improvement in parallel processing speed. The performance of the improved YOLO v3 model on transmission line inspection images is also greatly improved, its accuracy far exceeded that of the Faster R-CNN model, and the recall rate is similar, but it still maintains the advantage of the single-order method in speed.
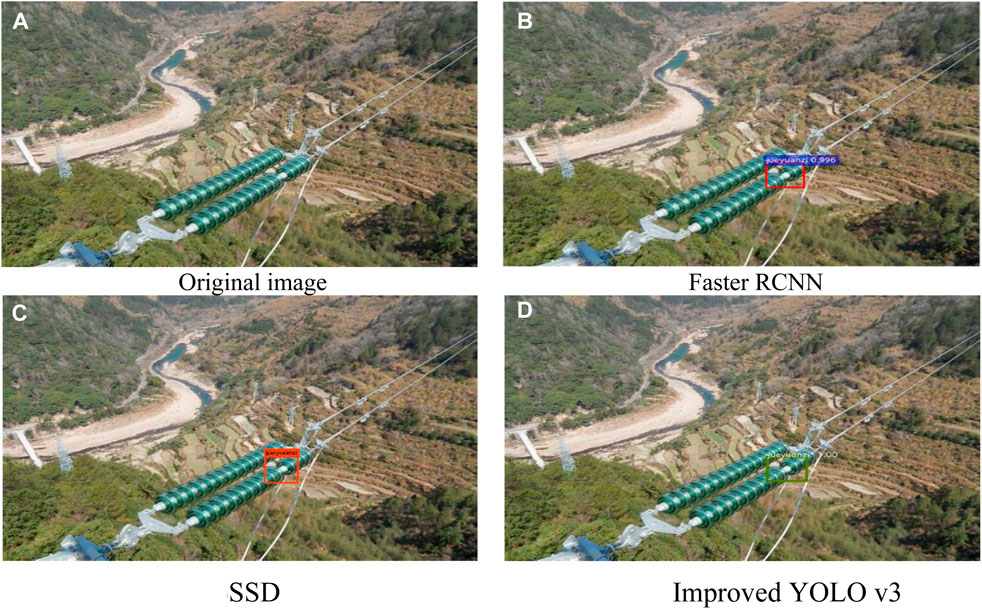
FIGURE 10. Comparison of insulator image defect detection effects.
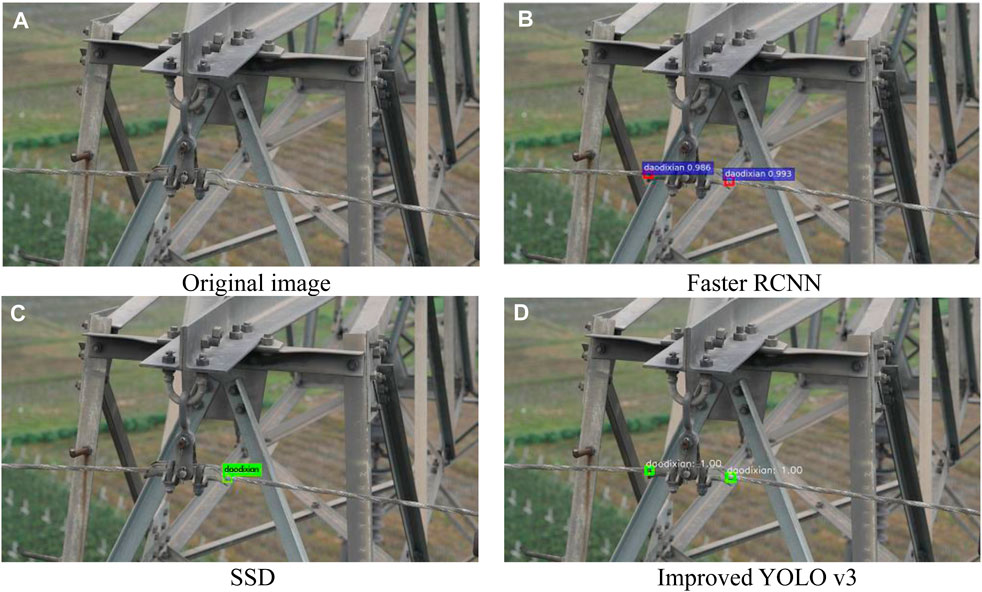
FIGURE 11. Comparison of image defect detection effects for ground wire.
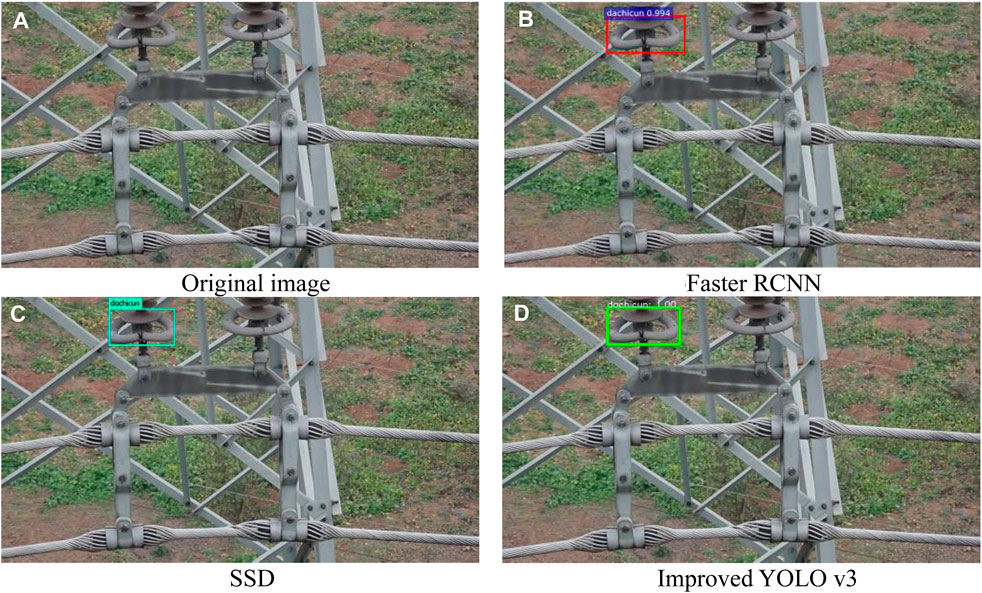
FIGURE 12. Comparison of defect detection effects on hardware image.
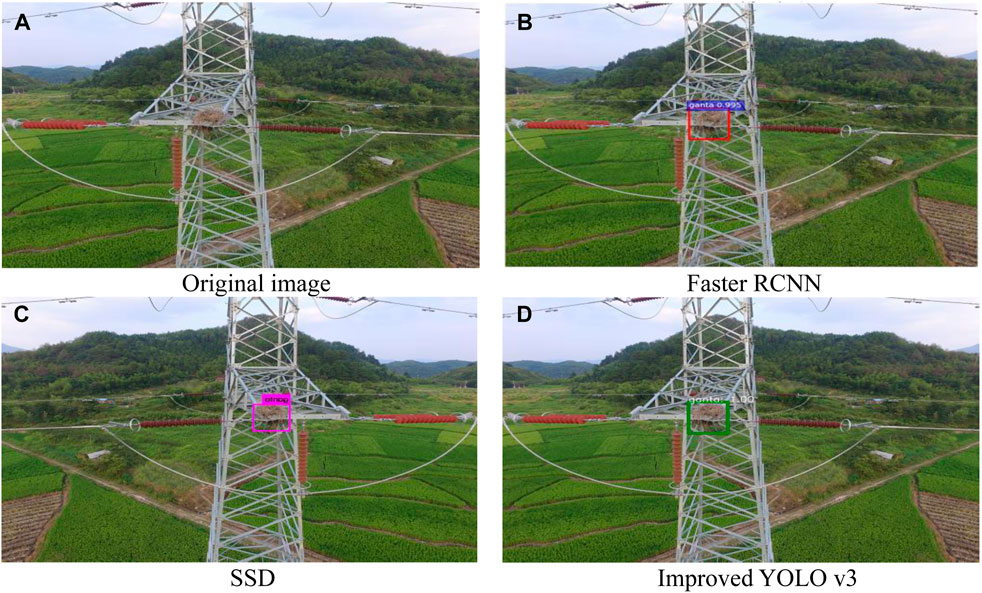
FIGURE 13. Comparison of defect detection effects on tower image.
In addition to the application scenarios mentioned in this article, there are also the following scenarios:
(1) Testing the performance of the improved YOLO v3 algorithm in different transmission line scenarios, such as different types of transmission lines and transmission lines in different environments.
(2) Applying the improved YOLO v3 algorithm to other types of equipment, such as unmanned vehicles and helicopters, to detect the performance differences of different equipment in transmission line defect detection.
5 Conclusion
At present, the target detection algorithms applied to the defect detection of transmission lines are mainly fast R-CNN. They have high recognition accuracy but slow detection speed and are unable to realize the recognition of the large amount of video data generated in UAV inspection. This study proposes a fast detection method for transmission line defects based on YOLO v3. Its detection speed is close to 50 frames per second, which can meet the needs of video inspection. At the same time, in the dataset of this paper, the rapid detection method of transmission line defects based on YOLO v3 achieves a detection rate of 78.2% and a probability of 79.6%. Under the premise of ensuring the detection speed, it has improved compared with SSD and YOLO v3 in both indicators. The detection rate is only 5.4% lower than that of Faster R-CNN-based detection methods. At the same time, mAP is also improved compared with the single-order algorithm. Therefore, this paper argues that the transmission line detection method based on YOLO v3 can make up for the shortcomings of the Faster R-CNN algorithm and realize the rapid detection of transmission line defects based on video images.
The issues that still need to be further explored are as follows:
(1) Insufficient diversity of the dataset: the dataset used in this article comes mainly from real-life images of transmission lines in a certain region. Although it covers a certain degree of scenarios and defect types, there may still be limitations. In order to improve the generalization ability of the algorithm, we can supplement transmission line data from other regions to increase the diversity of the dataset.
(2) The robustness of algorithms is difficult to evaluate: transmission line defect detection often faces various complex environments and lighting conditions, so the robustness of algorithms is crucial. This article did not evaluate the performance of the improved YOLO v3 algorithm under different environments and lighting conditions.
These issues are urgent research directions, and we need to conduct further research.
Data availability statement
The original contributions presented in the study are included in the article/Supplementary material; further inquiries can be directed to the corresponding author.
Author contributions
Conceptualization: MX; methodology: MX; software: CX; validation: MX; writing—original draft preparation: JG; writing—review and editing: JG; visualization: YW; project administration: MX; funding acquisition: MX. All authors contributed to the article and approved the submitted version.
Funding
This research was funded by Intelligent Diagnosis and Common Platform for Transmission Equipment Status Based on Multi-source Visual Big Data Perception grant number (2020)2Y039.
Acknowledgments
The authors acknowledge the funding from Intelligent Diagnosis and Common Platform for Transmission Equipment Status Based on Multi-source Visual Big Data Perception (grant no. (2020)2Y039).
Conflict of interest
Authors CX, MX, YW, and JG were employed by the Electric Power Research Institute of Guizhou Power Grid Co., Ltd.
Publisher’s note
All claims expressed in this article are solely those of the authors and do not necessarily represent those of their affiliated organizations, or those of the publisher, the editors, and the reviewers. Any product that may be evaluated in this article, or claim that may be made by its manufacturer, is not guaranteed or endorsed by the publisher.
References
Cerón, A., Mondragón, B., and Prieto, F. (2014) Power line detection using a circle based search with UAV images. In Proceeding 2014 Int. Conf. Unmanned Aircr. Syst. (ICUAS), 27-30 pp. 632–639. doi:10.1109/ICUAS.2014.6842307
Cao, Di, Hu, W., Xu, X., Wu, Q., Huang, Q., Chen, Z., et al. (2021). Deep reinforcement learning based approach for optimal power flow of distribution networks embedded with renewable energy and storage devices. J. Mod. Power Syst. Clean Energy 9 (5), 1101–1110. doi:10.35833/mpce.2020.000557
Chen, Y., Chen, H., Yang, J., Ma, J., and Lin, Y. (2021). Data-driven robust state estimation through off-line learning and on-line matching. J. Mod. Power Syst. Clean Energy 9 (4), 897–909. doi:10.35833/mpce.2020.000835
Deng, Y., Liu, X., Jia, R., Huang, Q., Xiao, G., and Wang, P. (2021). Sag source location and type recognition via attention-based independently recurrent neural network. J. Mod. Power Syst. Clean Energy 9 (5), 1018–1031. doi:10.35833/mpce.2020.000528
Everingham, M., Eslami, S. M. A., Van Gool, L., Williams, C. K. I., Winn, J., and Zisserman, A. (2015). The pascal visual object classes challenge: a retrospective. Int. J. Comput. Vis. 111, 98–136. doi:10.1007/s11263-014-0733-5
Gong, C., Luo, Yi, and Tu, G. (2003). COMPUTER VISION TECHNIQUE AND ITS APPLICATION TO UTOMATION OF POWER SYSTEMS. Automation Electr. Power Syst. 1, 76–79.
He, K., Zhang, X., Ren, S., and Sun, J. (2015). Spatial pyramid pooling in deep convolutional networks for visual recognition. IEEE Trans. Pattern Analysis Mach. Intell. 37 (09), 1904–1916. doi:10.1109/tpami.2015.2389824
Hui, Li, Zhong, P., Dai, Y., and Lv, D. (2018). Study on detection method of transmission line rusty based on deep learning. Electron. Meas. Technol. 41 (22), 54–59.
Jiang, Z. (2017). Visual detection for fault diagnoisis of power equipment by UAV line patrol” master’s thesis. Chengdu, Sichuan, China: University of Electronic Science and Technology of China.
Joseph, R., and Ali, F. (2016b). Darknet: open source neural networks in C. Available at: http://pjreddie.com/darknet/.
Joseph, R., and Ali, F. (2016a). YOLOv3: an incremental improvement. Available online: https://arxiv.org/abs/1804.02767 (accessed on Apr 8, 2018).
Lei, X., and Sui, Z. (2019).Intelligent fault detection of high voltage line based on the Faster R-CNN, Meas. (. Mahwah. N. J), 138, 379–385. doi:10.1016/j.measurement.2019.01.072
Li, J., Duan, Y., Wang, C., Wang, X., Guo, P., and Zhang, Y. (2017). Application of the unmanned aerial vehicle in the transmission line inspection. Power Syst. Clean Energy 33 (08), 62–65+70.
Li, Y., Gao, W., Yan, W., Huang, S., Wang, R., Gevorgian, V., et al. (2021). Data-driven optimal control strategy for virtual synchronous generator via deep reinforcement learning approach. J. Mod. Power Syst. Clean Energy 9 (4), 919–929. doi:10.35833/mpce.2020.000267
Li, Z., Liu, Y., Hayward, R., Zhang, J., and Cai, J. (2008) Knowledge-based power line detection for UAV surveillance and inspection systems. In Proceeding 2008 23rd Int. Conf. Image Vis. Comput. N. Z., 26, pp. 1–6. doi:10.1109/IVCNZ.2008.4762118
Liu, J., Jia, R., Li, W., Ma, F., Abdullah, H. M., Ma, H., et al. (2020). High precision detection algorithm based on improved RetinaNet for defect recognition of transmission lines. Energy Rep. 6, 2430–2440. doi:10.1016/j.egyr.2020.09.002
Luo, P., Wang, Bo, Ma, H., Ma, F., Wang, H., and Zhu, D. (2021). Defect recognition method with low false negative rate based on combined target detection framework. High. Volt. Eng. 47 (02), 454–464. doi:10.13336/j.1003-6520.hve.20200701
Nguyen, V. N., Jenssen, R., and Roverso, D. (2018). Automatic autonomous vision-based power line inspection: a review of current status and the potential role of deep learning. Int. J. Electr. Power & Energy Syst. 99, 107–120. doi:10.1016/j.ijepes.2017.12.016
Redmon, J., Divvala, S., Girshick, R., and Farhadi, A. (2016). You only look once: unified, real-time object detection, Proceeding of 2016 IEEE Conference on Computer Vision and Pattern Recognition (CVPR), NV, USA, 27-30 June 2016 Las Vegas, 779–788.
Ren, S., He, K., Girshick, R., and Sun, J. (2017). Faster R-CNN: towards real-time object detection with region proposal networks. IEEE Trans. Pattern Analysis Mach. Intell. 39 (06), 1137–1149. doi:10.1109/tpami.2016.2577031
Simonyan, K., and Zisserman, A. (2014). Very deep convolutional networks for large-scale image recognition. Available at: https://arxiv.org/abs/1409.1556 (accessed on Sep 4, 2014).
Wang, Bo, Ma, F., Dong, X., Wang, P., Ma, H., and Wang, H. (2019). Electric power depth vision: basic concepts, key technologies and application scenarios. Guangdong Electr. Power 32 (09), 3–10.
Wang, F.Ma, Ge, L., Ma, H., Wang, H., and Mohamed, M. A. (2021). Icing-EdgeNet: a pruning lightweight edge intelligent method of discriminative driving channel for ice thickness of transmission lines. IEEE Trans. Instrum. Meas. 70, 1–12. doi:10.1109/tim.2020.3018831
Wang, H., Wang, B., Li, M., Luo, P., Ma, H., and Ma, F. (2020). Insulator contamination perception based on feature fusion of infrared image and meteorological parameters. Front. Energy Res. 9, 746378. doi:10.3389/fenrg.2021.746378
Wang, W., Tian, B., Liu, Y., Liang, L. I. U., and Li, J. (2017). Study on the electrical devices detection in UAV images based on region based convolutional neural networks. J. Geo-information Sci. 19 (02), 256–263. doi:10.3724/SP.J.1047.2017.00256
Wang, X., and Zhang, Y. (2016). Insulator identification from aerial images using Support Vector Machine with background suppression, Proceeding of 2016 International Conference on Unmanned Aircraft Systems (ICUAS), VA, USA, 7-10 June 2016 IEEE, 892–897.
Wen, T., Zhou, D., Ming, L. I., Lin, Y., Zhao, S., Liu, J., et al. (2021). Bone mesenchymal stem cell-derived extracellular vesicles promote the repair of intervertebral disc degeneration by transferring microRNA-199a. Comput. Eng. 47 (03), 256–270. doi:10.1080/15384101.2020.1863682
Wu, Xi, Yao, N., and Xu, J. (2017). Substation transformer crack image recognition based on improved neural network algorithm. Mod. Electron. Tech. 40 (13), 66–69.
Yan, D., Li, Y., Guo, Q., and Yan, J. ( 2017) Research on transmission line UAV inspection based on image processing. In Proceedings of the 2017 Smart Grid Development Workshop, Beijing, China, pp. 74–77+268.
Keywords: YOLO v3 model, deep learning, fast defect detection, video recognition, transmission line defects
Citation: Xu C, Xin M, Wang Y and Gao J (2023) An efficient YOLO v3-based method for the detection of transmission line defects. Front. Energy Res. 11:1236915. doi: 10.3389/fenrg.2023.1236915
Received: 08 June 2023; Accepted: 10 October 2023;
Published: 21 November 2023.
Edited by:
Fuqi Ma, Xi’an University of Technology, ChinaReviewed by:
Zhenbing Zhao, North China Electric Power University, ChinaBo Xu, Shanghai University of Electric Power, China
Copyright © 2023 Xu, Xin, Wang and Gao. This is an open-access article distributed under the terms of the Creative Commons Attribution License (CC BY). The use, distribution or reproduction in other forums is permitted, provided the original author(s) and the copyright owner(s) are credited and that the original publication in this journal is cited, in accordance with accepted academic practice. No use, distribution or reproduction is permitted which does not comply with these terms.
*Correspondence: Mingyong Xin, eGlubXlAY3NnLmNu