 Jingying Zhao
 Hui Huang*
- School of Management, China University of Mining and Technology Beijing, Beijing, China
COVID-19 that broke out at the end of 2019 made countries to implement strict blockade measures to curb the spread of the virus. These measures have seriously disrupted the coal import and export trade, causing a significant impact on the coal trade network. This study aims to investigate the disparities between coal trade networks before and after COVID-19 outbreak. First, using complex network theory, we constructed global coal trade networks for the years 2019 and 2020. Subsequently, utilizing a cascading failure model, we developed a coal supply risk propagation framework. Through an analysis of network topology and theoretical supply risk propagation, we explored the similarities and differences of the coal trade networks during these 2 years. In terms of network topology structure, our findings reveal a decrease in trade tightness in the coal trade network of 2020 compared to 2019. Moreover, the Netherlands no longer retains its significance as an important trade hub country in 2020. Looking at the theoretical perspective of supply risk transmission, we observed that in 2020, COVID-19 resulted in a higher number of countries experiencing crisis outbreaks compared to 2019. However, it is noteworthy that the core countries within the coal trade network have remained consistent, and their roles as either net importers or net exporters have not changed. This indicates that the position of coal core countries is very stable. Therefore, no matter what happens, the country should pay timely attention to the dynamics of core countries. Interestingly, in 2020, the risk associated with coal supply did not conform to the spatial patterns typically seen in trade. For instance, the Russian Federation, identified as a country facing a crisis outbreak, transmits supply risks to geographically distant regions in West Asia, including countries like Ghana and Western Sahara.
1 Introduction
At the end of 2019, the COVID-19 outbreak occurred, and on 11 March 2020, the World Health Organization declared it a global pandemic, signifying its worldwide spread. COVID-19 has had a significant impact on the global economy, particularly affecting coal mining operations and restricting coal production capacity. In 2020, Wyoming, the largest coal-producing state in the United States, experienced the most substantial decline among all states. Additionally, Russia’s Raspadskaya coal mine, the largest coking coal mine in Russia, suspended coal sales for 6 months to a year (sohu, 2020a). Many industries, including steel and chemicals, experienced sluggish growth worldwide, resulting in reduced electricity consumption. As downstream sectors are reliant on coal, they decreased their demand for coal. Additionally, the COVID-19 pandemic restricted coal trade as countries chose to suspend coal exports as a preventive measure to curb the virus’s spread, leading to decreased transportation efficiency. For example, in February 2020, Mongolia suspended coal exports to China.
Despite efforts to reduce coal consumption in line with global targets of limiting global warming to 2°C or even 1.5°C, coal remains the largest conventional energy source in terms of reserves and widespread distribution. Renewable energy sources, while gaining momentum, still face challenges of instability and high costs. Consequently, coal continues to hold a vital strategic position in national economies and finds extensive applications in power generation and chemical industries. According to the bp Statistical Review of World Energy 2021, global coal consumption accounted for 32.87% of global fossil energy consumption in 2020, indicating the importance of coal as one of the three major fossil fuels globally. However, coal resources are distributed unevenly across countries, necessitating trade for each nation to meet its demand for coal in support of economic development. Given the pivotal role of coal, countries have adopted diverse trade policies and crafted trade agreements aligned with their national interests, thereby shaping the global coal trade network.
Complex network theory has been widely applied in the construction of international trade networks. Serrano and Boguna (2003) were among the first to introduce complex network theory into international trade, revealing the typical characteristics of complex networks such as scale-free distribution, small-world properties, and high clustering coefficients in international trade networks. Garlaschelli and Loffredo (2005) incorporated trade direction and temporal evolution into the observation of network topology, providing a more realistic representation of international trade. Fagiolo et al. (2008) introduced weights into international trade networks and found that compared to traditional unweighted networks, the statistical features differ. For instance, countries with closer trade relations tend to exhibit higher levels of clustering. Fagiolo et al. (2009) discovered that edge weights in international trade networks follow a power-law distribution. In 2010, the researchers found that highly connected countries in directed and weighted international trade networks tend to engage in trade with both low-connectivity countries and within highly interconnected trade clusters (Fagiolo et al., 2010).
As research on international trade networks progresses, scholars have begun exploring the trade evolution of specific products using complex network analysis. Industries such as energy minerals (Li and Ran, 2021; Dong et al., 2022; Xu, 2022), agricultural products (He, 2022; Liu et al., 2022), and wood forest products (Zhou et al., 2021) have utilized complex network methods to investigate various international trade issues. In terms of coal trade, researchers have used similar approaches to study fossil energy trade. For instance, Zhong et al. (2016) introduced the concept of energy value to unify coal, oil, and natural gas, constructing a fossil energy trade network spanning from 2000 to 2013. They analyzed trade volumes and hierarchical structures within the network. Wang W. Y. et al. (2022) focused on coal, oil, and natural gas, constructing a trade dependence network from 1998 to 2017, while also exploring trade bloc dynamics.
Some scholars have independently constructed coal trade networks to analyze the evolution patterns and dynamics. For instance, Wang et al. (2019) utilized the directed weighted complex network method to construct the global coal trade network spanning from 1996 to 2015. Through the analysis of degree distribution, network density, and the trade bloc structure, they explored the evolution patterns of the network. In a similar vein, Wang et al. (2021) constructed a coal import competition network from 1998 to 2017, examining the degree distribution, clustering coefficients, and core and peripheral structures to understand the network’s topology and the roles and statuses of various countries, including core and peripheral countries. Additionally, Chen X. C. et al. (2022) constructed a coal trade network from 1999 to 2018, analyzing trade relations, scale, and distribution to identify core and central countries involved in coal trade.
Furthermore, scholars have analyzed the evolving patterns of trade networks by investigating the propagation of supply risks. Recent global events such as the U.S.–China trade tensions and the COVID-19 pandemic have undoubtedly affected the stability of the coal trade network. For nations engaged in trade, when external shocks result in limited coal supply, risks associated with coal supply gradually propagate along the trade network. During this transmission process, when a country experiences coal price spikes or insufficient demand leading to shutdowns or bankruptcies, it subsequently leads to a decrease in coal trade volumes, placing other countries at a greater risk. When these crises accumulate to a certain extent, systemic collapse occurs, known as cascading failures within complex networks.
Lee et al. (2011) recognized that the propagation of supply risk in trade networks can occur not only through direct pathways but also through indirect and complex ways. Various research models, including the epidemic model, bootstrap percolation model, and cascading failure model, have been proposed to analyze the transmission mechanisms of supply risk in trade networks. Hao and An (2022) analyzed the risk transmission mechanism of multi-layer network supply in international steel trade under supply shortage and oversupply scenarios using an epidemic model. Wang et al. (2023) developed an aluminum supply risk propagation model based on the susceptible-infectious (SI) epidemic model, analyzing the transmission path, impact scope, and potential impact of different risk sources. However, some scholars argued that the epidemic model may not adequately capture the essence of risk transmission in international trade networks. As a macroeconomic system, international trade networks have their own characteristics and should be included in risk transmission models (Peckham, 2014; Zhou et al., 2018). Researchers such as Chen et al. (2018), Tian et al. (2021) simulated the supply risks of natural gas and key resource by using the bootstrap percolation model and identifying core countries in risk propagation. Additionally, scholars like Wang et al. (2018), Chen et al. (2022b), Hao et al. (2022), Ren et al. (2022), Sun et al. (2022) utilized cascading failure models to investigate supply risk avalanche scales, avalanche duration, and core countries’ roles in oil, graphite, cobalt, lithium, and mineral product trade networks. The different geographical locations, supply–demand centers, and trade relationships between coal resources and other resources make the spread of coal trade supply risks unique. In addition to using the cascading failure model to study the spread of risks on trade networks, Wang constructed the volatility spillover network, defined ΔCoVaR as the net risk spillover. When the cumulative ΔCoVaR it receives surpasses its VaR, a market will experience influence and transmit its risk to all its connected markets (Wang Z. et al., 2022).
Nevertheless, the global coal trade operates within the realm of international trade, and the propagation of its risks constitutes a dynamic cascading process. Hence, it is both logical and fit to utilize a cascading failure model to simulate the transmission of coal supply risks within trade networks. Upon a thorough examination of the current body of literature concerning coal trade networks, it becomes apparent that scholars have predominantly concentrated on investigating particular facets of network evolution. These areas of focus include the network topology or the identification of core countries in response to supply risk shocks. The most recent coal trade network analysis available is from 2018, with no recent data on coal trade networks. However, in recent years, there has been a shift toward trade protectionism and the rise of antiglobalization sentiments due to events like Brexit and the U.S.–China trade friction. Unilateralism and protectionism have significantly impacted trade development, leading to changes in global trade patterns. According to the World Trade Organization’s “Global Trade Data and Outlook” report for 2020, global merchandise trade experienced a 0.1% decline in 2019, amounting to $18.89 trillion (Yu and Lan, 2020). Drawing from the literature review, our research offers two primary contributions. First, it bridges an existing research void by creating coal trade networks for both 2019 and 2020, thus addressing the scarcity of recent studies pertaining to coal trade networks. Second, it delves into the evolutionary patterns of these networks from two vantage points: examining network topology and dissecting the characteristics of theoretical supply risk propagation.
This paper uses a complex network framework to construct the global coal trade networks in 2019 and 2020. Furthermore, a cascading failure model is utilized to establish a coal supply risk propagation model. This study focuses on comparing the coal trade networks in these 2 years, considering network topology and theoretical supply risk as key aspects. The analysis encompasses several dimensions, including the overall trade characteristics, trade tightness, trade hub countries, trade core countries, trade transmission efficiency, and trade spatial dependence.
2 Model construction
2.1 Data source and processing
This paper utilizes coal trade data from the UN Comtrade database to analyze global coal trade dynamics in 2019 and 2020. The data include both import and export flows with the Harmonized System (HS) code 2701. The data-processing procedure involves extracting relevant information such as trade direction, trade countries, and trade volumes. To address discrepancies in trade volumes when the reporting country differs between importers and exporters for the same trade, trade volumes are aligned with the importers’ perspective. In cases where no importers are recorded, the original data are retained (Xiao et al., 2022). To prevent smaller trade volumes from affecting the network, we removed data with trade volumes less than 1 kg (Kui and Qi, 2022).
2.2 Coal trade network construction
2.2.1 Model construction
This paper defines the global coal trade network as G = (V, E, W). V represents the participating countries in coal trade, V = (v1, v2,
2.2.2 Some related indicators
(1) Degree and degree distribution
In a complex network, the degree of a node signifies the number of edges directly connected to the node. In the case of a directed network, the degree is further divided into in-degree and out-degree, based on the direction of the edges. The degree of a directed network is the sum of its in-degree and out-degree. The in-degree of a node represents the number of edges directed toward it, indicating the count of import partners. Conversely, the out-degree of a node signifies the number of edges directed away from it, representing the count of export partners. The calculation formula is as follows:
In the formula, ki represents the degree of node i, kiin represents the in-degree node i, eji represents the number of connected edges from node j to node i, kiout represents the out-degree of node i, and eij represents the number of connected edges from node i to node j.
In a complex network, the degrees of individual nodes exhibit variability, forming a discrete random variable. Researchers commonly investigate the degree distribution to analyze this phenomenon. In real-world systems, the degree distribution of node often follows a power-law distribution, indicating scale-free properties. Specifically, in a scale-free network, a few nodes possess a large number of edges, while the majority of nodes have only a few connections.
(2) Clustering coefficient
In a complex network, the clustering coefficient of node i, denoted as Ci, is defined as the ratio of the actual number of edges among the ki neighbors of node i to the total possible number of edges. The clustering coefficient is a local characteristic that reflects the level of connectivity among the neighboring nodes of a specific node. Taking the average clustering coefficient of all nodes in the network provides the overall measure of the network’s clustering tendency. The calculation formula is as follows:
In the formula, Ci is the clustering coefficient, ki represents the number of neighboring nodes of node i, ei represents the actual number of connected edges between neighboring nodes, and < C> represents the average clustering coefficient of the network.
(3) Average shortest path length
In a complex network, the average shortest path length measures the average number of edges that the shortest path between all pairs of nodes in the network traverses. Within the trade network, the average shortest path length offers valuable insights into the extent of trade flow circulation. A longer average shortest path length indicates poorer circulation and lower efficiency within the trade network. The calculation formula is as follows:
In the formula, <d> represents the average shortest path length, n represents the number of nodes, and dij represents the shortest distance from node i to node j.
(4) Betweenness centrality
In a complex network, betweenness centrality measures the extent to which a node serves as a bridge or an important connector between two or more nodes. Specifically, it quantifies the number of times a node lies on the shortest path between any pair of nodes in the network. In a trade network, betweenness centrality is used to assess a country’s potential as a crucial link in facilitating trade flows. The calculation formula is as follows:
In the formula, Bi represents the betweenness centrality of node i, djk (i) represents the number of times the shortest path between node j and node k passes through node i, and djk represents the shortest path length between node j and node k.
(5) Network density
In a complex network, network density is a measure that represents the ratio of the actual number of edges to the maximum possible number of edges among the nodes in the network. In the trade network, network density reflects the level of interconnectedness or closeness of trade relationships between countries. The calculation formula is as follows:
In the formula, ρ indicates the network density, e represents the actual number of connected edges of all nodes, and n represents the actual number of nodes in the network.
2.3 Coal supply risk propagation model
We used the cascading failure model to construct a coal supply risk propagation model. In this model, countries are classified into two states: normal and abnormal. In the normal state, a country does not experience coal supply risks and continues to export coal as usual. In contrast, in the abnormal state, a country faces coal supply risks and can propagate these risks to other countries. This article uses the avalanche size and avalanche ratio to measure the spread of coal supply risks. The avalanche size refers to the number of countries that cause anomalies as a crisis outbreak country. The avalanche ratio represents the proportion of abnormal countries in relation to the total number of countries. The model mechanism is shown in Figure 1, and the specific process of model construction is divided into the following steps:
(1) This article assumes that all trading countries are in a normal state at the initial stage of coal supply risk transmission. In the model, each country may become a crisis outbreak country. We used the total amount of imported coal from each country to characterize the capacity of national nodes.
(2) When some force majeure factors occur, the export volume of the trading country vi to its coal exporting country vj decreases by fraction α. The calculation formula is as follows:
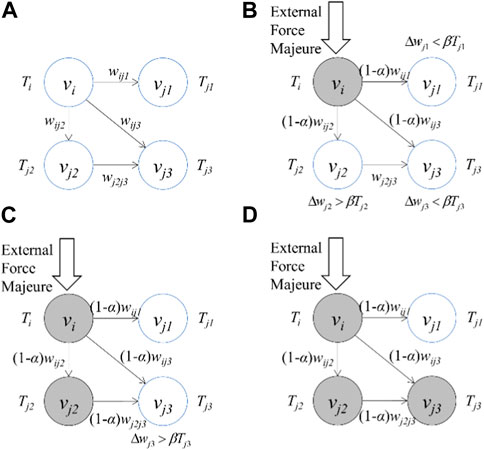
FIGURE 1. Model mechanism. (A) is the original state, (B) is when external force majeure occurs, the source trading country reduces trade volume to target trading countries by fraction α. (C) is that one of the countries has become abnormal and continues to reduce trade volume with the target trading country by fraction α. (D) is that another country has become abnormal.
In the formula, α is the shock degree, indicating the proportion of coal exports reduced by a country to its exporting country in the original export volume, wij represents the coal export volume of country i to country j in the original global coal trade network, and Δwij represents the decrease in coal exports from country i to country j.
(3) When the cumulative coal import reduction of the trading country vj exceeds the product of the country’s resistance threshold and capacity, the trading country vj changes from the normal state to the abnormal state. The calculation formula is as follows:
In the formula, wj represents the cumulative decrease in coal imports in country j, β represents the resistance threshold, which is the ability of a country to resist risks, and Tj represents the trade capacity of country j, represented by the total coal imports of country j.
(4) Steps (2) and (3) are repeated until there are no new abnormal countries in the network, and the simulation ends.
3 Comparison of the coal trade network
3.1 Network topology structure
3.1.1 Overall trade characteristics
The basic structure of the global coal trade network in 2019 and 2020 is shown in Table 1. Intuitively, the number of trading countries and the number of trading relationships in 2020 both declined compared to 2019. In 2020, the COVID-19 spread around the world, and many countries such as South Africa, the United States, the Netherlands, and Italy took measures such as blocking exports to prevent the virus from continuing to spread, which hindered the normal operation of the global coal trade network. As can be seen from the network density of the coal trade network in 2019 and 2020, this obstruction makes the coal trade network loose.
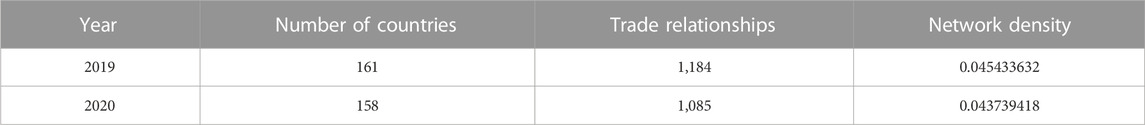
TABLE 1. Basic structure of the global coal trade network.
The complementary cumulative frequency of the degrees of the global coal trade network in 2019 and 2020 is placed on the double-logarithmic axis. Further using Origin 2018 software for linear fitting, the R2 and power-law distribution γ values after fitting the global coal trade network in 2019 and 2020 are shown in Figure 2. However, by comparing the fitting of scale-free characteristics of the global coal trade network in 2019 and 2020, it can be found that the R2 of the fitting line presents a downward trend; that is, the scale-free characteristics of the trade network develop in a less significant direction. In the 2013 coal trade network studied by Gao et al. (2015), the R2 after fitting the scale-free characteristics of the network is 0.892. It can be seen that with the development of time, the scale-free characteristics of the coal trade network are gradually weakening; that is, a small number of countries have a majority of trading partners, while a large number of countries have a small number of trading partners. The outbreak of COVID-19 in 2020 has had a major impact on some coal core countries, such as South Africa, the United States, Australia, and other countries, hindering normal trade relations between these countries and other countries. Simultaneously, in light of the recent surge in antiglobalization sentiments, certain nations are increasingly inclined to establish compact trade blocs instead of embracing open and inclusive free trade agreements. These trade blocs may impose trade barriers on other countries seeking entry. Therefore, over time, the characteristics of a small number of countries in the coal trading network with a large number of trading partners and a majority of countries with a small number of trading partners have significantly weakened.
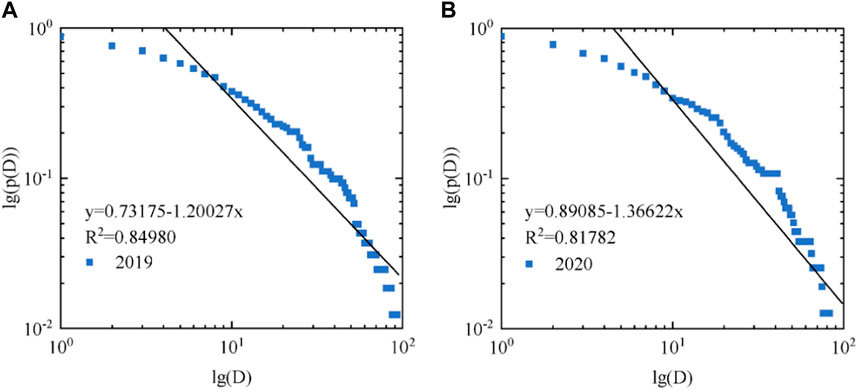
FIGURE 2. Degree distribution. (A) is in 2019 and (B) is in 2020.
3.1.2 Trade tightness
The trade tightness can be characterized by the average shortest path length and the average clustering coefficient. Among them, the average shortest path length reflects the circulation degree of trade between the trade countries in the coal trade network. The average clustering coefficient reflects whether the coal trade network is closely connected. Figure 3 shows the trade tightness of the coal trade network in 2019 and 2020. However, in terms of the average clustering coefficient or the average shortest path length, the trade tightness of the coal trade network in 2020 has decreased compared with 2019. From 2019 to 2020, the average shortest path length increased, indicating that the circulation degree of trade between trade countries in the coal trade network in 2020 has decreased compared with 2019. COVID-19 has spread among countries involved in coal trade, and in order to mitigate the spread of the virus, some lockdown measures taken by countries have exceeded the controllable level, seriously affecting the normal development of global coal trade.
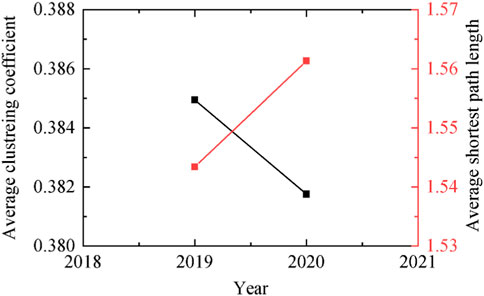
FIGURE 3. Clustering coefficient and the average shortest path length.
In general, the average clustering coefficient and network density of a random network should be numerically similar. The coal trade network exhibits a significantly higher average clustering coefficient compared to its network density. This observation signifies that the coal trade network possesses a substantial degree of clustering, which can be attributed to the spatial clustering of coal trade facilitated by the reduction in coal transportation costs. Countries are more likely to trade with countries that are geographically close to them. From 2019 to 2020, the decline in the average clustering coefficient indicates that the coal trade links between countries are developing in a less tight direction. The higher a country’s clustering coefficient, the more cohesive it is in the trade bloc in which it is a member. In some countries in the coal trade network from 2019 to 2020, such as Ukraine and South Africa, there is a decline in the clustering coefficient, which also indicates that the links between the trade partners of these countries are weakened and the national cohesion is reduced. Both Ukraine and South Africa use coal as their main energy source. According to the data from the bp Statistical Review of World Energy 2021, coal consumption in Ukraine accounted for nearly 30% of the total energy consumption in 2020. Ukraine’s coal production in 2020 was 0.54 exajoules, but consumption was 0.98 exajoules. Therefore, Ukraine must meet its coal demand by importing coal. According to the IEA World Energy Balances 2022, Ukraine’s coal imports in 2020 have nearly decreased compared to 2019. Due to the lack of clean water resources and the ongoing war in Ukraine, the country’s people are more susceptible to COVID-19, so Ukraine has been in a state of emergency since March 12, declaring a national quarantine. By the end of 2020, the number of infections in Ukraine has reached 1,064,479 and the number of deaths has reached 18,680 (shujujidi, 2022).
According to the IEA World Energy Balances 2022, South Africa’s coal consumption accounted for 24.3% of the total energy consumption in 2020. South Africa is the world’s largest producer of coal, in addition to meet domestic demand, mostly for export. However, South Africa, which is the most affected African country in 2020, entered a 21-day lockdown on 26 March 2020 to prevent the virus from spreading. Anglo American, a South African coal giant, has mentioned that thermal coal exports will be limited this year due to national measures (sohu, 2020b).
3.1.3 Trade hub countries
Table 2 shows the top 10 countries with betweenness centrality in the coal trade network in 2019 and 2020 and the top 10 countries with betweenness centrality in the coal trade network studied by Wang et al. (2019). It can be seen that from 2015 to 2019, the function of trade bridges in European countries such as the United Kingdom and Germany has gradually weakened, while the role of the Netherlands as a trade hub has gradually increased. The Netherlands was at the top of the rankings in 2019, but did not make the top 10 in 2020. The two main coal ports in the Netherlands are the ports of Rotterdam and Amsterdam. The port of Rotterdam is the largest port in Europe and one of the most important logistics centers in the world. At the same time, the Port of Rotterdam is also an important port connecting Europe, the United States, Asia, Africa, and Australia and is known as the “Gateway to Europe.” The Port of Amsterdam is the second largest seaport in the Netherlands and an important hub for inland points in Europe. The COVID-19 outbreak has led to economic malaise in European countries since 2020, and according to the bp Statistical Review of World Energy 2021, the price of natural gas in the Netherlands Gas Exchange Center was about 8 dollars per million Btu in 2019, compared to about 3.5 dollars per million Btu in 2020. European countries are committed to exiting coal as soon as possible to contribute to the achievement of climate goals, and in 2019, the Netherlands passed the coal phase-out law and decided to phase-out coal electricity by 2030. Natural gas prices have fallen significantly, and the use of natural gas in Europe has further reduced the use of coal, with coal throughput falling at two major Dutch ports.
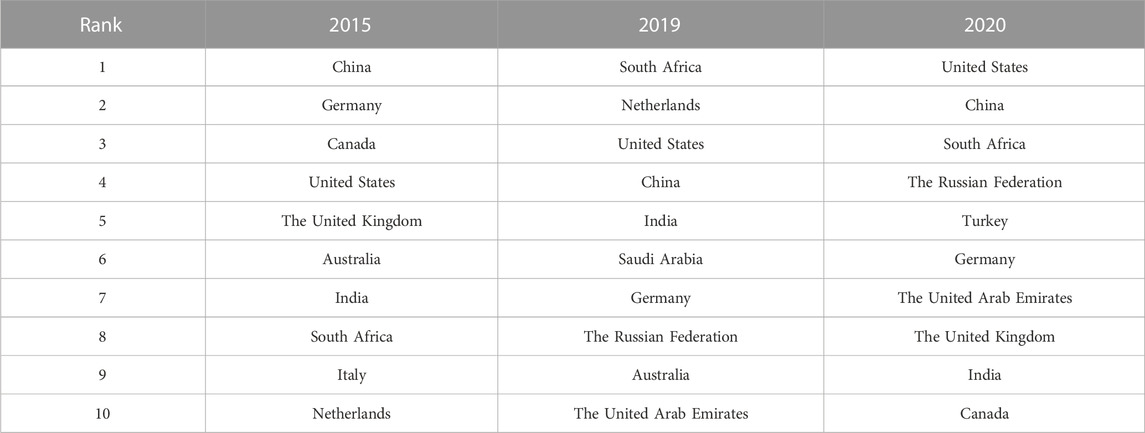
TABLE 2. Betweenness centrality in 2015, 2019, and 2020.
3.2 Coal risk supply
Based on the coal supply risk propagation model constructed in the previous chapter, we referred to scholar Hao’s setting of shock level α and resistance threshold β and set the shock degree α as 0.1, 0.2, 0.3,
3.2.1 Core countries
When the shock degree α varies, the number of countries exposed to coal supply risks also varies (i.e., the avalanche ratio in the global coal trade network varies). Furthermore, different countries, as crisis outbreak countries, are affected by different shock degrees α, resulting in different ranges of risk transmission. By analyzing the scope of risk propagation under different shock degrees α, it is possible to identify the core crisis outbreak countries in the risk propagation process. This study fixed the resistance threshold, β, to 0.1, modified the shock degree α, and found core countries by analyzing the avalanche ratio in 2019 and 2020.
Figure 4 shows the avalanche ratio in the global coal trade network caused by the spread of coal supply risks due to a decrease in coal exports in 2019 and 2020. In the global coal trade network in 2019, approximately the top 15 countries experiencing coal supply risks may spread and have an impact on other countries around the world, resulting in about 96.89% of countries in the network becoming abnormal. However, when coal supply risks occur in countries beyond the top 20, regardless of the shock degree, the percentage of abnormal countries caused by that country will rapidly decrease. In the global coal trade network of 2020, approximately the top 17 countries experiencing coal supply risks may cause about 96.88% of countries in the network to become abnormal. When α/β is one, there are no abnormal countries in the global coal trade network. As the value of α/β gradually increases, the avalanche ratio also gradually increases. As the ranking countries increase, the avalanche ratio overall shows a stepwise downward trend, indicating a gradual reduction in the number of abnormal countries caused by countries with lower rankings.
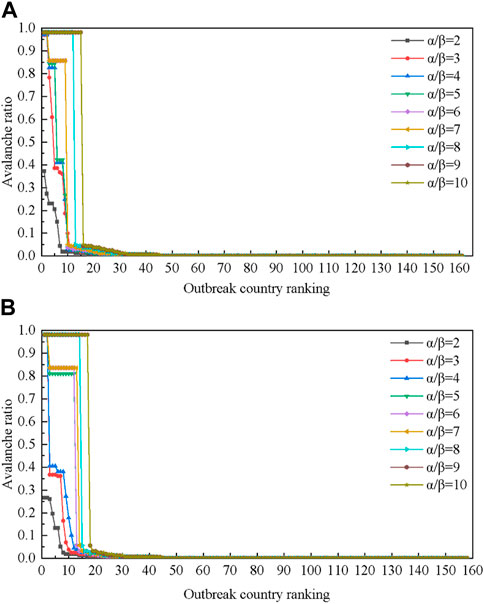
FIGURE 4. Avalanche ratio. (A) is from 2019 and (B) is from 2020.
According to the U.N. Comtrade database, the global coal trade data in 2020 were less than the global coal trade data in 2019. The global coal trade network in 2020 suffered a significant trade shock from the COVID-19 pandemic before its construction, making it less stable compared to the 2019 network. In 2020, there were more crisis outbreak countries that could impact other countries compared to 2019. The new crisis outbreak countries in 2020 include European countries such as Germany and the Netherlands. Germany was severely affected by COVID-19 and underwent pandemic lockdown measures. COVID-19 also led to a significant decline of 9.1% in cargo throughput at the largest port in Europe, the Port of Rotterdam in the Netherlands. As coal serves as an energy source in ports, its trade volume noticeably decreased (Port of Rotterdam feels COVID-19, 2020).
Figure 5 shows the countries with the highest proportion of avalanches under the α/β value in 2019 and 2020, representing their significance in the coal trade network. Despite the continued spread of COVID-19 in 2020, the countries that held critical positions in the 2019 coal trade network remained core countries in 2020. This implies that although the outbreak of COVID-19 affected the normal functioning of the coal trade network, it did not alter the crucial role of these countries. In Figure 5, as the α/β value gradually increased, it became evident that the avalanche ratios for Australia, Colombia, the United States, Ireland, the Russian Federation, Indonesia, Kazakhstan, Spain, and South Africa consistently maintained high rankings and displayed a clear upward trend. Therefore, Australia, Colombia, the Russian Federation, Kazakhstan, South Africa, the United States, Indonesia, Spain, and Ireland were identified as the core countries in the coal trade network. Table 3 presents the ratio of coal trade exports to coal trade imports for the nine core countries in 2019 and 2020. It is evident that Ireland and Spain were net coal importers in both 2019 and 2020. On the other hand, Australia, Colombia, the Russian Federation, Kazakhstan, South Africa, the United States, and Indonesia were all net coal exporters during these years. It is noteworthy that sudden public health events like COVID-19 did not lead to a change in these countries’ status as net coal importers or net coal exporters.
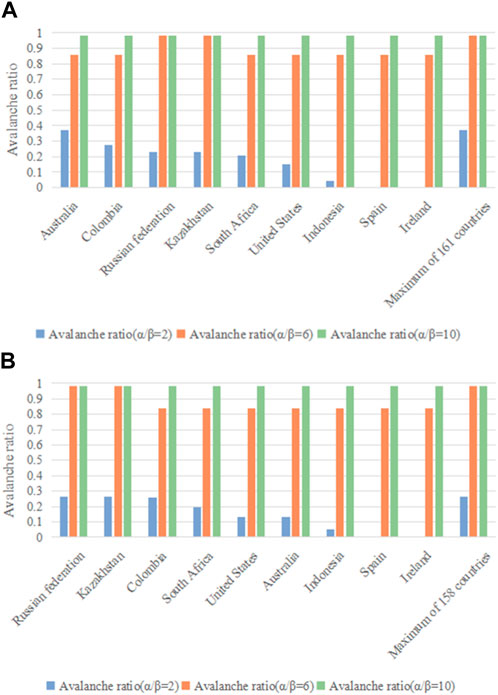
FIGURE 5. Avalanche ratio under different α/β of core countries. (A) is from 2019, (B) is from 2020.
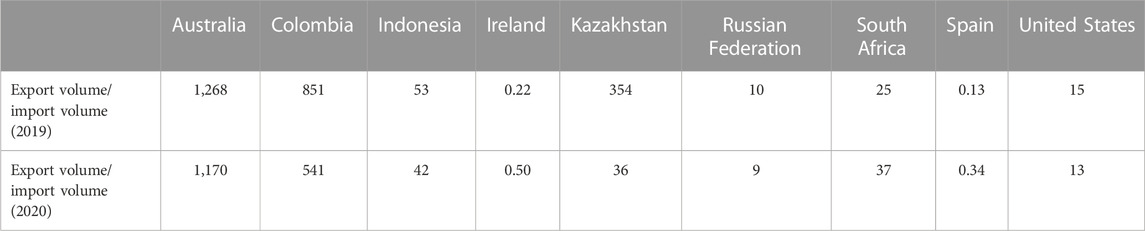
TABLE 3. Ratio of coal export volume to coal import volume in 2019 and 2020.
3.2.2 Trade transmission efficiency
When coal exporting countries face geopolitical tensions, infectious disease outbreaks, or domestic uncontrollable factors, they may resort to extreme trade policies such as a complete halt in coal exports. The complete cessation of coal exports by coal exporting countries means the shock degree α is 100%, resulting in significant ramifications for risk propagation. We defined the total steps from an initial abnormality to the end of the avalanche process as avalanche duration T(i). By analyzing the T(i) in avalanche scales, the trade transmission efficiency of the coal trade networks in 2019 and 2020 can be examined.
Figure 6 shows the avalanche scale of core countries in 2019 under the scenario of complete supply interruption when the resistance threshold is 0.1. At this time, each country experiences the maximum avalanche scale of 158, resulting in a high proportion of abnormal countries, reaching 98.14%. The vast majority of countries in the entire coal trade network suffered from coal supply risks. Among these core countries, the Russian Federation only needs to spread risks four times, causing anomalies in the majority of countries in the network, while South Africa needs to spread risks seven times to achieve the same effect.
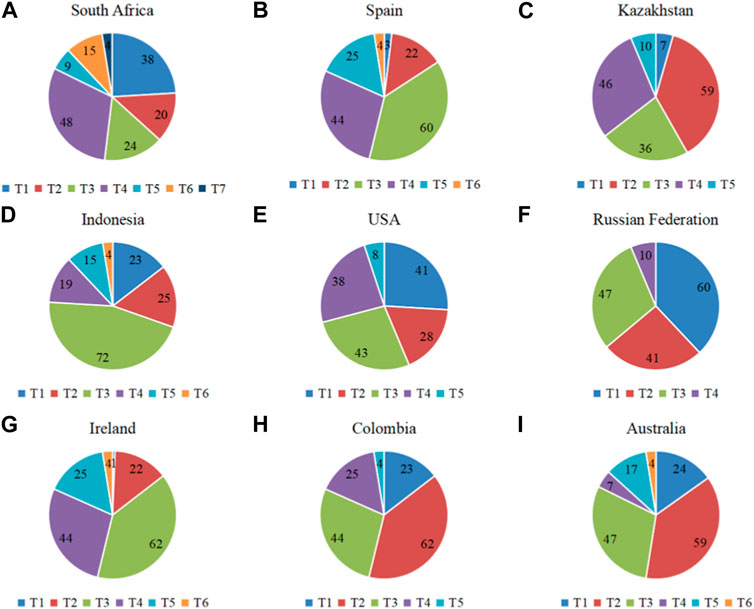
FIGURE 6. Avalanche scale of critical countries in 2019. (A) is South Africa, (B) is Spain, (C) is Kazakhstan, (D) is Indonesia, (E) is United States, (F) is Russian Federation, (G) is Ireland, (H) is Colombia, (I) is Australia.
Figure 7 shows the avalanche scale of core countries in 2020 under the scenario of complete supply interruption when a resistance threshold is 0.1. In this situation, each country experiences the largest avalanche scale of 155, resulting in a high proportion of abnormal countries, reaching 98.1%. Among these core countries, the Russian Federation, consistent with 2019, only needs to spread risks four times, causing anomalies in the vast majority of countries in the network. South Africa, Spain, Ireland, and Australia need to spread risks eight times to affect the vast majority of countries in the network.
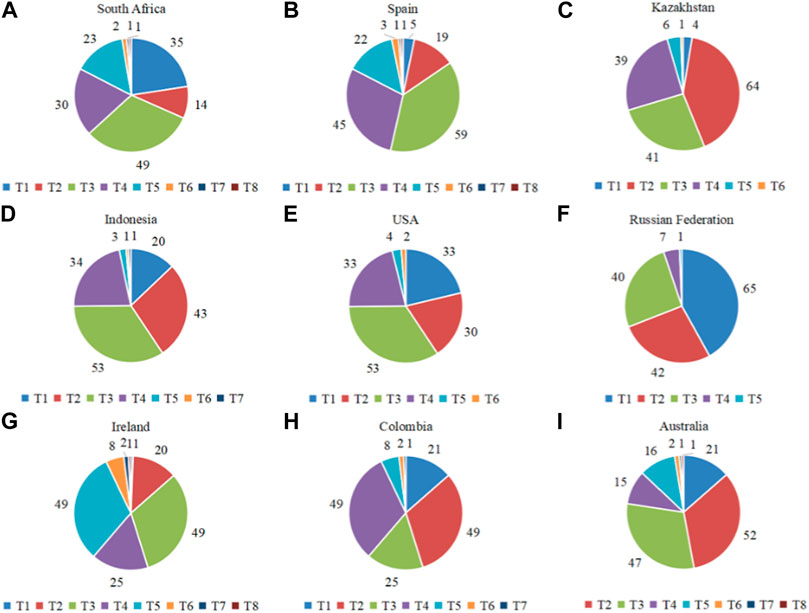
FIGURE 7. Avalanche scale of critical countries in 2020. (A) is South Africa, (B) is Spain, (C) is Kazakhstan, (D) is Indonesia, (E) is United States, (F) is Russian Federation, (G) is Ireland, (H) is Colombia, (I) is Australia.
In 2020, the avalanche duration of coal supply risks caused by the nine core countries was higher than those in 2019 in the trade network. The COVID-19 pandemic severely impacted these countries. By the end of 2020, South Africa had accumulated 28,469 deaths, Spain had accumulated 54,666 deaths, Kazakhstan had accumulated 2,749 deaths, Indonesia had accumulated 22,329 deaths, the United States had accumulated 350,103 deaths, the Russian Federation had accumulated 57,555 deaths, Ireland had accumulated 2,276 deaths, Colombia had accumulated 42,909 deaths, and Australia had accumulated 909 deaths (shujujidi, 2022). To prevent the cross-border spread of the virus, countries voluntarily suspended international coal trade, leading to a decrease in trade connectivity and lower trade transmission efficiency in the coal trade network in 2020.
3.2.3 Trade spatial dependence
Within trade networks, nations often prioritize trade interactions with geographically proximate countries. Consequently, the transmission of supply risks in these trade networks adheres to a parallel pattern, where risks are more prone to spreading to neighboring countries (Hao et al., 2022). In the 2019 and 2020 coal supply risk propagation model, the Russian Federation was selected as the crisis outbreak country. This choice was based on the scenario where, with a resistance risk threshold of 0.1 for all countries in the global coal trade network, the Russian Federation reduced its coal exports to all countries by 20%. As a crisis outbreak country, it affected only a limited number of countries. However, when the Russian Federation reduced its coal exports to all countries by 30%, the risk of coal supply spread to over 95% of countries. Through simulation research, it was observed that as the Russian Federation continued to decrease the proportion of coal exports to all countries, the avalanche duration of the coal supply risk gradually diminished. This means that the risk diffusion ability of the Russian Federation gradually strengthens, and there is no need to affect countries without direct coal trade through multiple iterations. In summary, the article selects the situation where the resistance threshold for all countries in the global coal trade network is 0.1, and the Russian Federation reduces coal exports to all countries by 30%. By comparing and analyzing the spread of risk in the first-level coal supply, the article explores the trade spatial dependence of the coal trade network in 2019 and 2020.
Figure 8 shows the spread of first-level coal supply risk when the Russian Federation is selected as the crisis outbreak country. The orange color represents the year 2019, while the green color represents 2020. The common abnormal countries between the 2 years are excluded. From the figure, it can be observed that the number of abnormal countries in 2020 is significantly more than in 2019 after the spread of first-level coal supply risk. Geographically, the countries experiencing abnormal conditions are situated in regions that are in closer proximity to the Russian Federation in 2019, such as Europe, Western Asia, and North Africa. On the other hand, the abnormal countries in 2020, such as Ghana, Togo, Senegal, and Western Sahara, are situated in more distant regions of West Africa. The spatial dependence of the coal trade network in 2020 is lower compared to 2019. This can be attributed to the outbreak of COVID-19 in 2020, which facilitated the spread of coal supply risk in the trade network. Apart from affecting countries in close geographical proximity, the risk also extended to countries located farther away. According to the UN Comtrade database, in 2019, the Russian Federation did not establish trade relations with countries like Ghana and Western Sahara, which are geographically distant. However, during the COVID-19 pandemic, African countries, despite the challenges posed by their underdeveloped economies and limited healthcare systems, experienced a significant number of infections and fatalities. By the end of 2020, the cumulative death toll in African countries exceeded 63,000 (Gu, 2020). Several African nations heavily depend on coal resources, prompting them to forge coal trade partnerships with the Russian Federation to address coal shortages in 2020. This decision was made despite the elevated transportation costs associated with the considerable geographical distance between them.
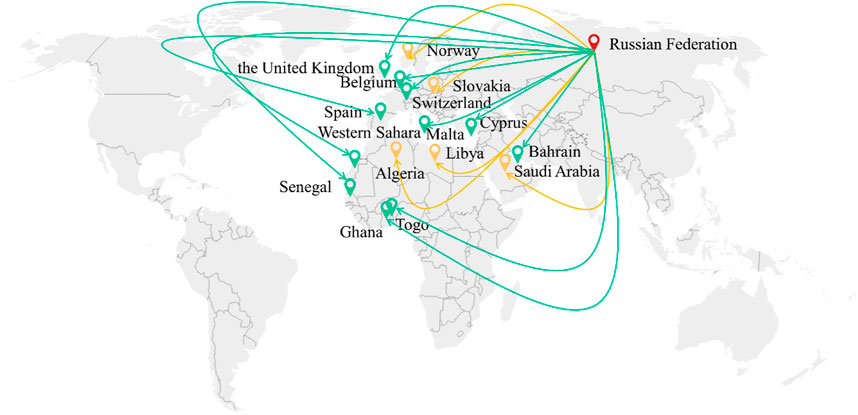
FIGURE 8. First level of crisis propagation from the Russian Federation in 2019 and 2020. Note: the orange ones are from 2019, and the green ones are from 2020.
4 Conclusion and future outlook
4.1 Conclusion
This article used complex networks to construct international coal trade network models for 2019 and 2020 and then used cascading failure models to construct risk propagation models for global coal trade in 2019 and 2020. Based on the topological structure of the trade network and the theoretical supply risk propagation, this paper compared and analyzed the coal trade network before and after the COVID-19 outbreak.
First, in terms of network topology, the number of countries and trade transactions involved in coal trade decreased in 2020 compared to 2019, resulting in a decrease in the overall connectivity of the trade network. The increase in antiglobalization sentiments and the surge in trade protectionism have rendered the preservation of free trade more difficult, leading to a reduction in the dominance of a small number of countries with a multitude of trading partners. The tightening of coal trade in 2020 can be attributed to the outbreak of COVID-19, which prompted countries to implement measures such as lockdowns and travel restrictions, disrupting the normal flow of coal trade. Additionally, countries such as Ukraine and South Africa experienced a decline in trade cohesion in 2020 due to the severe impact of COVID-19 infections in these regions. Furthermore, there were notable changes in the ranking of trade hub countries. Netherlands, which was among the top 10 trade hub countries in 2019, did not maintain its position in 2020. This shift can be attributed to several factors, including a decline in natural gas prices and the proactive response of European nations to climate change through the gradual phase-out of coal-fired power generation. Consequently, these countries have exhibited a preference for natural gas over coal as an energy source.
Then, from the perspective of theoretical supply risk propagation, in the 2020 coal trade network, there were more crisis outbreak countries that could affect other countries compared to 2019. This indicates that the coal trade network exhibited vulnerability due to the impact of COVID-19, with the participating countries being more susceptible to disruptions. However, through the analysis of avalanche ratios, we identified the same nine core countries in the coal trade network for both 2019 and 2020. Importantly, the status of these countries as net importers or net exporters of coal did not change due to the influence of COVID-19. By analyzing the avalanche duration, we observed that the transmission level of coal supply risks for the nine core countries in the 2020 coal trade network was higher than in 2019. This suggests that the transmission efficiency of coal trade was lower in 2020 due to the outbreak of COVID-19. In 2019, the spread of supply risks followed trade spatial dependence, prioritizing countries with closer geographical proximity. However, in 2020, when the Russian Federation served as the crisis outbreak country, the supply risks propagated to geographically distant regions, such as Ghana, Western Sahara, and Togo, in the first level of propagation. This indicates a deviation from trade spatial dependence in the transmission of supply risks in the 2020 coal trade network.
They have the following implications. First, the rise of antiglobalization sentiments has posed challenges to trade development, resulting in a shift from tight to more loosely connected trade relationships. However, it is crucial to recognize that trade liberalization can yield significant societal benefits for nations engaged in open trade. Therefore, each country should continually enhance and expand free trade agreements while firmly advocating for multilateralism. For instance, in November 2020, a consortium of 10 ASEAN countries, in conjunction with 15 other Asia–Pacific nations, including China, Japan, and Australia, ratified the Regional Comprehensive Economic Partnership (RCEP) agreement. This landmark accord officially took place on 1 January 2022, representing the world’s largest free trade zone. It serves as a breakthrough in the face of prevailing antiglobalization sentiments and signifies countries’ unwavering commitment to championing free trade and advancing regional economic integration. Furthermore, the widespread emergence of antiglobalization attitudes has disrupted coal trade, erecting barriers and impeding smooth transactions. This environment also heightens the likelihood of the emergence of dominant coal trading entities. Therefore, it is imperative for each country to diversify its coal import channels as much as possible to collectively mitigate coal supply crises, which are particularly susceptible to disruptions from the major coal exporting nations. Second, the occurrence of public emergencies affecting coal supply will not alter the status of core countries in the coal trade network. Therefore, following such events, governments, energy authorities, and coal-related associations of various countries must remain vigilant and promptly monitor the coal situation in those countries. This includes tracking potential risks, direct risks, and indirect risks to ensure a well-informed response to any disruption in the coal trade. Third, the propagation of supply risk in the trade network after a public emergency does not follow spatial dependency. For instance, regions in Africa, such as Ghana and Western Sahara, should not only focus on South Africa when monitoring coal supply risks but also take into account other major coal producers. For countries participating in global trade, whether in daily life or in the public emergencies, it is still important to focus on the core powers of the coal trade network.
4.2 Future outlook
In previous studies, the most recent coal trade network data available were from 2018. This article addresses the research gap by constructing the coal trade network for 2019 and 2020, thereby providing an updated perspective on the coal trade network. The emergence of antiglobalization sentiments has had an impact on the coal trade network, leading to differences compared to previous years. Additionally, the outbreak of COVID-19 further influences the dynamics of the coal trade network during these 2 years. This article primarily focuses on analyzing the differences in the coal trade network between 2019 and 2020 from two key perspectives: the topological structure of the trade network and the propagation of theoretical supply risks. By examining both aspects, a comprehensive understanding of the changes in the coal trade network over time can be gained. This approach can also be applied to conduct comparative analyses of trade networks for other products in different years, facilitating a deeper understanding of the evolution of trade networks overall.
In considering the propagation of theoretical supply risks, this article uses a basic cascading failure model, which may not fully capture real-world dynamics. Therefore, in this study, we refer to these supply risks as theoretical supply risks. In the future, we will continue to explore ways to improve the cascading failure model to better align with real-world scenarios. Our current ideas for improvement primarily focus on two aspects. First, we consider adjusting the model parameters. The parameter α could be represented by the proportional reduction in trade volume following the occurrence of real-world events that impact trade. The parameter β could be represented by (1− external dependence). Second, regarding the determination of whether a country transitions from a normal state to an abnormal state, we can consider evaluating criteria such as the cumulative import loss and inventory levels or assessing the balance between supply and demand for the product. By incorporating these refinements, we aim to enhance the model’s ability to reflect real-world conditions and dynamics.
Data availability statement
The original contributions presented in the study are included in the article. Further inquiries can be directed to the corresponding author.
Author contributions
JZ performed data collection, constructed the model, and wrote the original manuscript. HH contributed to the conception of the research and revised the manuscript. All authors contributed to the article and approved the submitted version.
Conflict of interest
The authors declare that the research was conducted in the absence of any commercial or financial relationships that could be construed as a potential conflict of interest.
Publisher’s note
All claims expressed in this article are solely those of the authors and do not necessarily represent those of their affiliated organizations, or those of the publisher, the editors, and the reviewers. Any product that may be evaluated in this article, or claim that may be made by its manufacturer, is not guaranteed or endorsed by the publisher.
References
Port of Rotterdam feels COVID-19 (2020). Port of Rotterdam feels the impact of COVID-19 on cargo volume. Available at: https://www.5684.com/news/article/7997.html (Accessed July 24, 2020).
Chen, X. C., Tan, Z. L., and Li, S. W. (2022). Study on the characteristics of international coal trade on complex network. J. Bus. Econ. Manag. 23 (4), 797–817. doi:10.3846/jbem.2022.15670
Chen, Z. H., An, H. Z., An, F., Guan, Q., and Hao, X. Q. (2018). Structural risk evaluation of global gas trade by a network-based dynamics simulation model. ENERGY 159, 457–471. doi:10.1016/j.energy.2018.06.166
Chen, Z. H., Wang, H., Liu, X. Y., Wang, Z., and Wen, S. B. (2022). Risk diffusion of international oil trade cuts: A network-based dynamics model. ENERGY Rep. 8, 11320–11333. doi:10.1016/j.egyr.2022.08.244
Dong, X. J., An, H. G., Du, Q. J., Dong, Z. L., and Lu, G. (2022). Research on the evolutionary characteristics and response strategies of the global trade network of scrap copper resources. Complex Syst. Complex. Sci. 19, 104–110. doi:10.13306/j.1672-3813.2022.02.013
Fagiolo, G., Reyes, J., and Schiavo, S. (2008). On the topological properties of the world trade web: A weighted network analysis. Phys. A-STATISTICAL Mech. ITS Appl. 387 (15), 3868–3873. doi:10.1016/j.physa.2008.01.050
Fagiolo, G., Reyes, J., and Schiavo, S. (2010). The evolution of the world trade web: A weighted-network analysis. J. Evol. Econ. 20 (4), 479–514. doi:10.1007/s00191-009-0160-x
Fagiolo, G., Reyes, J., and Schiavo, S. (2009). World-trade web: topological properties, dynamics, and evolution. Phys. Rev. E 79 (3), 036115. doi:10.1103/PhysRevE.79.036115
Gao, C. X., Sun, M., and Shen, B. (2015). Features and evolution of international fossil energy trade relationships: A weighted multilayer network analysis. Appl. ENERGY 156, 542–554. doi:10.1016/j.apenergy.2015.07.054
Garlaschelli, D., and Loffredo, M. I. (2005). Structure and evolution of the world trade network. Phys. A-STATISTICAL Mech. ITS Appl. 355 (1), 138–144. doi:10.1016/j.physa.2005.02.075
Gu, X. J. (2020). Why is Africa's "epidemic" year beyond scientists' predictions, breaking prejudices and fancy anti epidemic measures in 2020? Available at: https://baijiahao.baidu.com/s?id=1687504602773179222&wfr=spider&for=pc (Accessed December 30, 2020).
Hao, H. C., Xing, W. L., Wang, A. J., Song, H., Han, Y. W., Zhao, P., et al. (2022). Multi-layer networks research on analyzing supply risk transmission of lithium industry chain. Resour. POLICY 79, 102933. doi:10.1016/j.resourpol.2022.102933
Hao, X. Q., and An, H. Z. (2022). Comparative study on transmission mechanism of supply shortage risk in the international trade of iron ore, pig iron and crude steel. Resour. POLICY 79, 103022. doi:10.1016/j.resourpol.2022.103022
He, C. X. (2022). Research on pattern evolution and influence mechanism of global soybean trade network. WORLD Agric. (8), 27–40. doi:10.13856/j.cn11-1097/s.2022.08.003
Kui, G. X., and Qi, C. J. (2022). Study on the evolution of world citrus trade pattern based on social network analysis. World Agric. (6), 18–30. doi:10.13856/j.cn11-1097/s.2022.06.002
Lee, K. M., Yang, J. S., Kim, G., Lee, J., Goh, K. I., and Kim, I. M. (2011). Impact of the topology of global macroeconomic network on the spreading of economic crises. PLOS ONE 6 (3), e18443. doi:10.1371/journal.pone.0018443
Li, Y. S., and Ran, D. (2021). Network structure and influence factors of oil industry chain trade about the countries along "the belt and road. Econ. PROBLEMS (9), 111–118. doi:10.16011/j.cnki.jjwt.2021.09.013
Liu, T. T., Zhang, H. J., Kang, Y. X., and Qian, J. F. (2022). Analysis of gloabl cotton trade pattern from the perspective of social network. WORLD Agric., 26–36. doi:10.13856/j.cn11-1097/s.2022.04.003
Peckham, R. (2014). Contagion: epidemiological models and financial crises. J. PUBLIC HEALTH 36 (1), 13–17. doi:10.1093/pubmed/fdt083
Ren, B., Li, H. J., Wang, X. X., Shi, J. L., Ma, N., and Qi, Y. J. (2022). The flow of embodied minerals between China's provinces and the world: A nested supply chain network perspective. Resour. POLICY 78, 102853. doi:10.1016/j.resourpol.2022.102853
Serrano, M. A., and Boguna, M. (2003). Topology of the world trade web. Phys. Rev. E 68 (1), 015101. doi:10.1103/PhysRevE.68.015101
shujujidi (2022). Number of confirmed cases and deaths of COVID-19 in 2020. Available at: https://www.shujujidi.com/shehui/1091.html (Accessed November 15, 2022).
sohu (2020). Russia's largest coking coal mine suspended coal sales during the pandemic. Available at: https://www.sohu.com/a/383776017_120044184 (Accessed March 28, 2020).
sohu (2020). Summary of global coal mine production status under the impact of the epidemic. Available at: https://www.sohu.com/a/385219260_777609 (Accessed April 30, 2020).
Sun, X. Q., Shi, Q., and Hao, X. Q. (2022). Supply crisis propagation in the global cobalt trade network. Resour. CONSERVATION Recycl. 179, 106035. doi:10.1016/j.resconrec.2021.106035
Tian, X., Geng, Y., Sarkis, J., Gao, C. X., Sun, X., Micic, T., et al. (2021). Features of critical resource trade networks of lithium-ion batteries. Resour. POLICY 73, 102177. doi:10.1016/j.resourpol.2021.102177
Wang, W. Y., Fan, L. W., Li, Z. F., Zhou, P., and Chen, X. (2021). Measuring dynamic competitive relationship and intensity among the global coal importing trade. Appl. ENERGY 303, 117611. doi:10.1016/j.apenergy.2021.117611
Wang, W. Y., Fan, L. W., and Zhou, P. (2022). Evolution of global fossil fuel trade dependencies. ENERGY 238, 121924. doi:10.1016/j.energy.2021.121924
Wang, W. Y., Li, Z. F., and Cheng, X. (2019). Evolution of the global coal trade network: A complex network analysis. Resour. POLICY 62, 496–506. doi:10.1016/j.resourpol.2018.10.005
Wang, X. X., Li, H. J., Yao, H. J., Zhu, D. P., and Liu, N. R. (2018). Simulation analysis of the spread of a supply crisis based on the global natural graphite trade network. Resour. POLICY 59, 200–209. doi:10.1016/j.resourpol.2018.07.002
Wang, Y., Chen, L., Wang, X. Y., Tang, N., and Kang, X. Y. (2023). Trade network characteristics, competitive patterns, and potential risk shock propagation in global aluminum ore trade. Front. ENERGY Res. 10. doi:10.3389/fenrg.2022.1048186
Wang, Z., Gao, X. Y., Huang, S. P., Sun, Q. R., Chen, Z. H., Tang, R. W., et al. (2022). Measuring systemic risk contribution of global stock markets: A dynamic tail risk network approach. Int. Rev. FINANCIAL ANALYSIS 84, 102361. doi:10.1016/j.irfa.2022.102361
Xiao, X., Zhang, W. L., and Zhou, H. Q. (2022). Evolution of global edible oil seed trade pattern and its enlightenment to China. China Oils Fats, 1–17.
Xu, M. J. (2022). Research on the impact of the characteristics of cobalt resource trade network on the international competitiveness of industries. postgraduate. Jiangxi university of science and technology. Ganzhou, China.
Yu, M. J., and Lan, J. H. (2020). Study on reverse globalization from the perspective of international trade. J. Chang'an Univ. (Philosophy Soc. Sci. Ed. 22 (4), 23–32.
Zhong, W. Q., An, H. Z., Fang, W., Gao, X. Y., and Dong, D. (2016). Features and evolution of international fossil fuel trade network based on value of emergy. Appl. ENERGY 165, 868–877. doi:10.1016/j.apenergy.2015.12.083
Zhou, J., Gong, K., Luo, S. L., Liu, J. Y., and Tang, C. S. (2018). Dynamic evolution of crisis spreading and its spatial features on international trading network. Appl. Res. Comput. 35 (01), 83–87.
Keywords: coal trade, cascading failure, risk propagation, COVID-19, coal supply risk
Citation: Zhao J and Huang H (2023) Comparative study on the international coal trade network before and after COVID-19 outbreak. Front. Energy Res. 11:1230191. doi: 10.3389/fenrg.2023.1230191
Received: 28 May 2023; Accepted: 15 September 2023;
Published: 29 September 2023.
Edited by:
Hugo Morais, University of Lisbon, PortugalReviewed by:
Ze Wang, Beijing Normal University, ChinaAn Haizhong, China University of Geosciences, China
Copyright © 2023 Zhao and Huang. This is an open-access article distributed under the terms of the Creative Commons Attribution License (CC BY). The use, distribution or reproduction in other forums is permitted, provided the original author(s) and the copyright owner(s) are credited and that the original publication in this journal is cited, in accordance with accepted academic practice. No use, distribution or reproduction is permitted which does not comply with these terms.
*Correspondence: Hui Huang, aGhAY3VtdGIuZWR1LmNu