 Thanh-Son Tran
 Thi-Thanh-Hoa Kieu
 Duc-Tung Le
- 1Faculty of Electrical Engineering, Electric Power University, Hanoi, Vietnam
- 2Department of Electrical Engineering, School of Electrical and Electronic Engineering, Hanoi University of Science and Technology, Hanoi, Vietnam
A large amount of renewable energy resources are integrated into electricity transmission networks. For efficient operation, transmission networks should be smart, in which it is necessary to have the function of estimating the state of the power system. This function determines bus voltage magnitude and phase, which are used for monitoring, operating, and controlling transmission networks. Transmission network state estimation is developed to estimate bus voltage magnitude and phase by many methods, which include genetic algorithms. Published articles have not mentioned in detail how to apply genetic algorithms to estimate the state of large transmission networks, and the application is limited to small networks. Therefore, this work seeks to estimate the state of large transmission networks by genetic algorithms. Strong decoupling was observed between active power and the voltage phase, as well as between reactive power and voltage magnitude, while a weak coupling, between active power and voltage magnitude, as well as between reactive power and voltage phase; voltage magnitude has a value of around 1.0 p.u, and the voltage phase has a value of around 0.0. This paper proposes a novel approach to genetic algorithms for estimating the state of smart transmission networks. In this novel approach, voltage magnitude and phase are separately estimated at each iteration of genetic algorithms. The approach is validated on IEEE 14-, 30-, and 118-bus networks. Results show that our approach can use phasor measurement unit data to estimate the state of large smart transmission networks by genetic algorithms.
1 Introduction
Today, the increasing energy demand and the integration of renewable energy sources into the power system make it more and more complex. To operate a power system effectively and securely, we need a smart grid. Therefore, the energy management system (EMS) and wide-area measurement system (WAMS) are implemented. One of the functions of these systems is to estimate the state of the system to prevent any eventual danger and faults. The input parameters of the state estimation problem are measured values of supervisory control and data acquisition (SCADA) and phasor measurement unit (PMU), such as the voltage/current amplitude, voltage/current phase angle, active power, and reactive power. The output parameters are estimated values of the state variables as the bus voltage magnitude and voltage phase angle.
The objective function of the power system state estimation (PSSE) problem can be performed using the weighted least squares (WLS) model (Abur and Gómez Expósito, 2004), the weighted least absolute value (WLAV) model (Celik and Abur, 1992), or the weighted linear least square (WLLS) model (Mahaei and Navayi, 2014).
This problem can be solved by classical algorithms or heuristic search algorithms. The classical methods have complex objective functions, constraints, and algorithms, and the choice of initial values has a great influence on the convergence of the problem. The application of Newton’s method requires semidefinite programming (SDP) techniques to create initial values for improving the solution accuracy (Weng et al., 2012). There are many published articles that used the WLS algorithm to solve the PSSE problem. Xiaoli et al. (2015) used the WLS algorithm and changed the value of the weights in the objective function for each type of measurement. Madtharad et al. (2003) used singular value decomposition to solve the problem with a linear weighted least squares model, but the computation time was much slower than that when using conventional WLS methods. With the WLS algorithm taking into account the PMU’s measurement, Rabha et al. (2015) converted phasor measurements from polar to Cartesian form, whereas Korres and Manousakis (2011) only used rectangular coordinates in the first iteration and transformed current measurements into polar form to use in the next steps. Jin and Shen (2018) included both data from SCADA and PMU systems for the input of the WLS algorithm. In this algorithm, Jacobi’s matrix consists of partial derivatives of both SCADA and PMU measurement functions. Li and Li (2009) converted the state variables measured by the PMU into branch current measurement values for Jacobi’s matrix. Ni et al. (2011) also estimated the state by the WLS algorithm, which considers PMU measurement values as equality constraints. This increases the size of Jacobi’s matrix. The aforementioned techniques may not converge in the case that the number of measurements increases so much that the matrix may have an ill-condition number and the solution is local (Khoa et al., 2004). Therefore, heuristic search algorithms are developed for the power system state estimation, such as the particle swarm optimization algorithm (Tungadio et al., 2016), (Hussein and Sultan, 2018), gravitational search algorithm (Vedik and Chandel, 2015), genetic algorithm (GA) (Khoa et al., 2004), (Hossam-Eldin et al., 2009), a hybrid method using cellular computational network (CCN) and genetic algorithms (Rahman and Venayagamoorthy, 2017), or artificial fish swarm optimization algorithm (AFSOA) (Salkuti, 2020). Compared with classical algorithms, the advantages of these algorithms are that they only need objective functions and constraints, the algorithm is not very complicated and can find the global solution. However, these studies mostly published the results of small grids. Concretely, the number of nodes is not greater than six in the studies by Khoa et al. (2004), Hossam-Eldin et al. (2009), and (Salkuti, 2020); 14 and 30 nodes in the study by Vedik and Chandel (2015); and 68 nodes in the study by Rahman and Venayagamoorthy (2017). The genetic algorithm is a search heuristic that is inspired by the process of natural selection. This is a strong algorithm for optimization problems. However, the application of this one to power system state estimation is actually limited. The existing publications only apply to power grids with up to 14 nodes. In particular, Khoa et al. (2004) presented two algorithms; one of them is the parallel genetic algorithm applied to state estimation for a 5-bus grid. Hossam-Eldin et al. (2009) used a genetic algorithm to estimate the power system state. However, it could only solve the problem of the systems, having no more than six buses. Tran and Kieu (2021) studied the 5-bus and 14-bus systems and suggested the best choice of selection operator for GA.
Using GA, these aforementioned papers include both bus voltage magnitude and phase in every individual. Consequently, the voltage magnitude and phase are updated simultaneously by selection, crossover, and mutation operators in the GA. However, because the change of the voltage magnitude value has a great influence on the reactive power variation while the voltage phase angle variation has a large effect on the active power change (Saadat, 1999), the simultaneous update of both of them may not be a convenient way. Therefore, this paper proposes to decouple voltage magnitude and phase angle calculation in every loop of the genetic algorithm for transmission system state estimation. In each loop, the voltage phase angle is estimated, and then, the voltage magnitude is estimated. When estimating the voltage phase angle, the best-estimated voltage magnitude is used. For the first iteration, the voltage magnitude is taken as 1 p.u. When estimating the voltage magnitude value, the best-estimated voltage phase is used. Such an iterative process will stop when the convergence condition of the problem is satisfied. The proposed approach is implemented in MATLAB 2016Rb software and validated by the IEEE 14-bus, 30-bus, and 118-bus transmission systems using both conventional and PMU measurements. The simulation results of the proposed approach are compared with those of previous articles and the genetic algorithm, in which the individual includes both V and θ simultaneously.
2 Problem formulation and proposed approach
Before proposing a novel approach of the genetic algorithm to solve the PSSE problem, some terms, such as gene, individual, and population, are introduced as follows:
• A gene presents the solution to one variable of the problem. In the PSSE problem, a gene can be a bus voltage magnitude or phase angle.
• An individual is a set of genes or a possible solution to the problem.
• A population is known as a set of individuals. The population is improved through the iterative processes of three major operators: selection, crossover, and mutation. In each iteration (or generation), every individual in the population is evaluated using their fitness values, which are known as objective function values.
Among the three operators used in this paper, the selection operator is Roulette wheel selection because it is most suitable for PSSE problems (Tran and Kieu, 2021). The two others are heuristic crossover and uniform mutation.
The output of the power system state estimation (PSSE) problem includes voltage magnitude and phase angle values, which are decimals. In order not to transform decimals into binary and vice versa, the continuous variable genetic algorithm is used in this study. Section 2.1 presents the objective function of the problem. The proposed approach of the continuous variable genetic algorithm is presented in Section 2.2.
2.1 Objective function of the power system states the estimation problem
Selecting an objective function model for a heuristic search optimization algorithm is a matter of concern because the search direction is mainly based on the objective function value. Tungadio et al. (2016) and Hussein and Sultan (2018) used two types of objective functions: the weighted least square (WLS) and the weighted least absolute value (WLAV). Their simulation results show that using the weighted least squared model shows better results. In this paper, the weighted least squared model is concerned with state variables limited to the search space domain. Since the genetic algorithm searches based on the orientation of the objective function value, the constrained optimization problem is transformed into the unconstrained optimization problem by adding a penalty function to the objective function. Therefore, the objective function will have an additional component P(x), which is a penalty function, to evaluate the individuals whose variable value exceeds the search interval.
We consider an N-bus system that includes m set of measurements zi:
where z is a set of measurement values, h(x) is the nonlinear function related to the measurement type, x represents the state variables, and e is the error of the measurements that are independent and distributed, following the Gaussian probability density.
In power system state estimation, the state variables x consist of the voltage magnitude and phase angle. The measurement data can be taken from SCADA or PMU systems. These measurements can be active/reactive power injected into a bus, active/reactive power or current flowing through transmission lines, voltage magnitude, and phase angle of a bus. Corresponding to each measurement, the function h(x) is as follows:
Consider the complex form of branch current as Iij = Iij.re + i.Iij.im:
where Vi, Vj, θi, and θj are voltage magnitude and voltage phase at bus i and bus j, respectively. Yij is the ij-th element of the bus admittance matrix, φij is the angle of Yij, and Ysi = gsi + jbsi is the shunt admittance of branch ij on the side of bus i.
The unconstrained objective function is formed as in Eq. 10 (Tungadio et al., 2016):
where F(x) is the unconstrained objective function (fitness function) of GA, J(x) is the constrained objective function,
2.2 Proposed approach
Consider a power system consisting of N nodes. On the application of the genetic algorithm for the estimation, published studies use individuals of (2N–1) genes, where N genes are values of N voltage magnitudes V and (N-1) genes are (N-1) values of voltage phase θ (one node is selected as a reference node, and its phase value is set to 0). Applying the existing general process of continuous GA provided in the study by Haupt and Haupt (2004) for the state estimation problem, the CGA algorithm of estimating V-θ simultaneously can be described as follows:
Step 1:. Set the parameters of the algorithm, including the number of individuals in the population (nbrIn), the selection rate, the probability of mutation and crossover, and the maximum number of iterations.
Step 2:. Initialize the population, including nbrIn individuals. Each individual has (2N–1) genes.
Step 3:. Calculate the value of the objective function of every individual in the population.
Step 4:. Perform elitism to keep some chromosomes, which have good value of the objective function.
Step 5:. Perform selection, crossover, and mutation operations to create a new population.
Step 6:. Check convergence conditions. If satisfied, perform step 7. If the convergence condition is not satisfied, repeat step 3 for further calculation. The convergence condition is usually the maximum number of iterations or when the objective function of m consecutive iterations has values that do not change much.
Step 7:. Print the estimated results of voltage magnitude and phase and stop.The flowchart of the aforementioned steps is shown in Figure 1.In the way of estimating V-θ simultaneously, as described earlier, some good individuals are kept for the next population through elitism. The crossover and mutation operators change the voltage magnitude and phase of the parents simultaneously to produce offspring. The reactance/resistance (X/R) ratio of the transmission line is large, and voltage phases are relatively small in most operations. Hence, there is a strong coupling between real power and voltage phase, as well as between reactive power and voltage magnitude, while there is a weak coupling between real power and voltage magnitude, as well as between reactive power and voltage phase. Moreover, the values of voltage magnitude and phase angle are very different (voltage magnitude usually has a value of around 1 p.u, while the voltage phase usually has a value of around 0). Therefore, the simultaneous estimation of V and θ, as presented earlier, can be an inappropriate approach. Hence, this paper proposes a novel approach to the GA algorithm for PSSE. In this novel approach, the voltage magnitude and phase are separately estimated in every loop. Specifically, when estimating the voltage phase value, the voltage magnitude value will remain constant and vice versa. Thus, in the PSSE problem, there will be two types of individuals. The first type, x1, includes (N–1) genes corresponding to (N–1) voltage phase values, and the second type, x2, includes N genes corresponding to N voltage magnitude values. First, the population of x1 will be estimated, and then, the best individual of this population will be used to estimate the new population of x2. After creating a new population of x2, the best individual of this population is again used to estimate the next population of x1. This iteration process continues until the stopping condition is satisfied. The proposed approach includes the following steps:
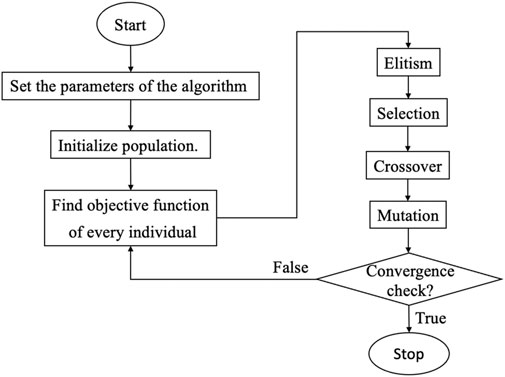
FIGURE 1. Flowchart of the CGA algorithm for simultaneous V-θ estimation.
Step 1:. Set the parameters of the algorithm, including the number of individuals in the population, the selection rate, the probability of mutation and crossover, the maximum number of iterations.
Step 2:. Initialize the population of x1 consisting of (N–1) genes corresponding to voltage phases. Initialize the population of x2 consisting of N genes corresponding to voltage magnitudes.
Step 3:. Calculate the value of the objective function of every individual in the population of x1.
Step 4:. Perform elitism to the population of x1.
Step 5:. Perform selection, crossover, and mutation operations to create a new population of x1.
Step 6:. Check convergence conditions of the population. If satisfied, perform step 7. If not satisfied, repeat step 3 for further calculation. The convergence condition is usually the maximum number of iterations or when the objective function of m consecutive iterations has values which do not change much.
Step 7:. Use the best individual obtained from step 6 to calculate the objective function value of every individual in the x2 population.
Step 8:. Perform elitism to the population of x2.
Step 9:. Perform selection, crossover, and mutation operations to create a new x2 population.
Step 10:. Check the conditions of population convergence x2. If satisfied, perform step 11. If not satisfied, repeat step 7 for further calculation. The convergence condition is usually the maximum number of iterations or when the objective function of m consecutive iterations has values that do not change much.
Step 11:. Check the convergence condition of the problem, which can be the maximum number of iterations. If satisfied, stop. If not satisfied, repeat step 2. When returning to the second step, a number of the best individuals of x1 and x2 are kept and passed to step 2. In our approach, we keep 10% of the best individuals.The flowchart of the aforementioned steps is shown in Figure 2.To verify the effectiveness of the aforementioned proposed algorithm, the two calculation approaches are programmed in MATLAB and applied to the IEEE 14-, 30-, and 118-bus grids. Input data are conventional and PMU measurements.
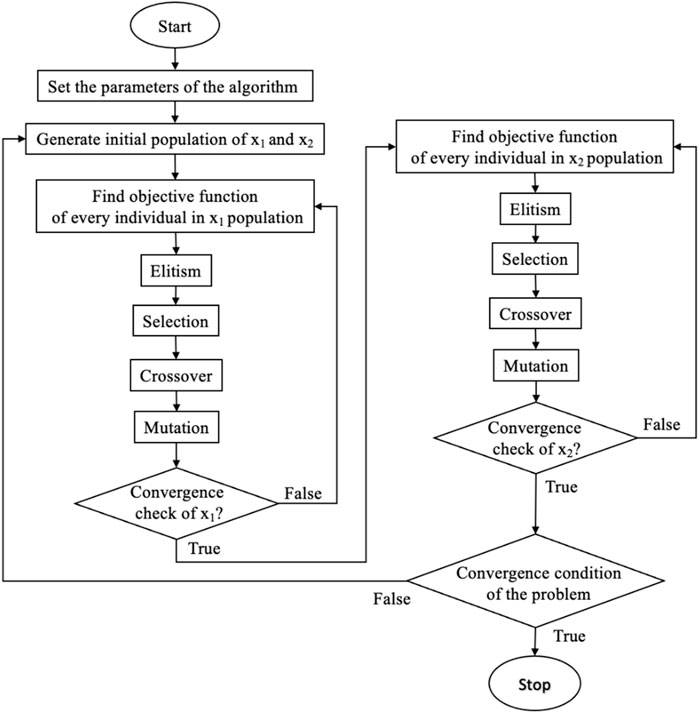
FIGURE 2. Flowchart of the proposed CGA algorithm for separate V-θ estimation.
3 Results and discussion
The proposed approach is applied to estimate the state of IEEE 14-bus, 30-bus, and 118-bus power grids. The measurement data consist of both conventional and PMU data. The conventional data consist of N active power injection, N reactive power injection measurements, and one voltage magnitude measurement. The data of PMUs include voltage magnitude, voltage phase, branch current magnitude, and branch current phase. If a PMU is installed on a bus, the current magnitude and phase of all branches connecting to that bus will be measured.
The CGA presented in Section 2.2 is tested in each system with the following parameters:
• Maximum iteration: 50,000 for simultaneous V-θ estimation, 300 for the outer loop, and 3,000 for the inner loop of separate V-θ estimation;
• Population size: 40 for the IEEE 14-bus grid, 100 for the 30-bus grid, and 400 for the 118-bus grid;
• Elitism rate: 0.05;
• Mutation rate: 0.01;
• Crossover rate: 0.8;
3.1 IEEE 14-bus test case
The considered system is an IEEE 14-bus system, which has 14 buses and 20 branches. The parameters of the system are taken from Power Systems Test Case Archive (1993b). The number of conventional measurements used in the estimation is 29, which are bus active and reactive powers at 14 buses, and a voltage magnitude of bus 1 is used.
PMUs are installed on buses 2, 6, 7, and 9 (Kamh et al., 2021). There are 38 measurements by PMUs, including voltage magnitude and phase of buses 2, 6, 7, and 9; and current magnitude and phase of branches 2–1, 2–3, 2–4, 2–5, 6–5, 6–11, 6–12, 6–13, 7–4, 7–8, 7–9, 9–4, 9–7, 9–10, and 9–14.
Figure 3A presents the estimated results of voltage magnitude, and Figure 3B presents the results of voltage phase in four cases: simultaneous V-θ estimation using conventional measurement (SIM-CONV), simultaneous V-θ estimation using PMU measurement (SIM-PMU), separate V-θ estimation using conventional measurement (SEP-CONV), and separate V-θ estimation using PMU measurement (SEP-PMU), as well as the reference values. Table 1 shows the maximum errors of these estimations.
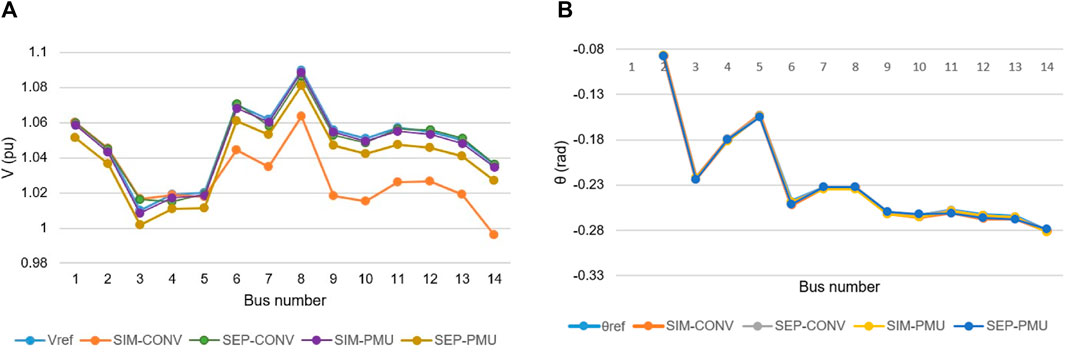
FIGURE 3. Reference and estimated values of the voltage magnitude (A) and phase (B) of the IEEE 14-bus network.
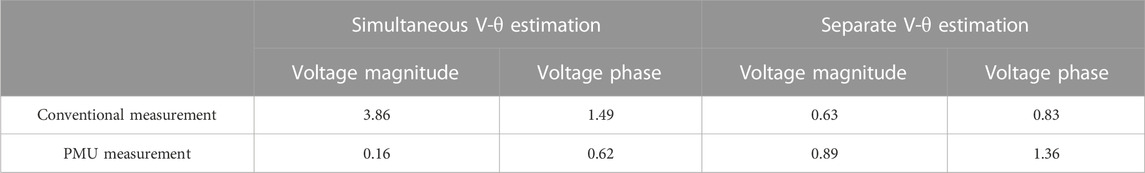
TABLE 1. Maximum error (%) of the IEEE 14-bus network voltage magnitude and phase in the four cases.
The maximum error of the simultaneous V-θ estimation using conventional measurement is 3.86%, while using PMU measurement gives a much smaller error, 0.62%. In the case that voltage magnitude and phase are separately estimated, the maximum error of the two approaches is 1.36%. This error is much smaller than the one of simultaneous estimation. Figure 3 and Table 1 show that the estimated result of SIM-CONV has the largest deviation from the reference value. With the same data from conventional measurement, when using the proposed algorithm, the percentage error of the estimated voltage magnitude decreases from 3.86% to 0.63%, correspondingly reduced by six times. The estimated voltage phase error is reduced from 1.49% to 0.83%, which is about 1.8 times. Therefore, the separate V-θ estimation is better than the simultaneous estimation. If an acceptable error is 5%, the comparison shows that both simultaneous and separate V-θ estimations are appropriate to the IEEE 14-bus system.
3.2 IEEE 30-bus test case
The second test case is the IEEE 30-bus system, which has 41 branches. The parameters of the IEEE 30-bus system are taken from the study by Saadat (1999) and Power Systems Test Case Archive (1993b).
The number of conventional measurements used in the estimation is 61, which are bus active and reactive powers at 30 buses, and a voltage magnitude of bus 1 is used. PMUs are installed at buses 2, 4, 6, 9, 10, 12, 15, 18, 25, and 27 (Kamh et al., 2021). There are 104 measurements by PMUs.
Figure 4A presents the estimated results of voltage magnitude, and Figure 4B presents the one of voltage phase in the four cases. Table 2 shows the maximum errors of these estimations.
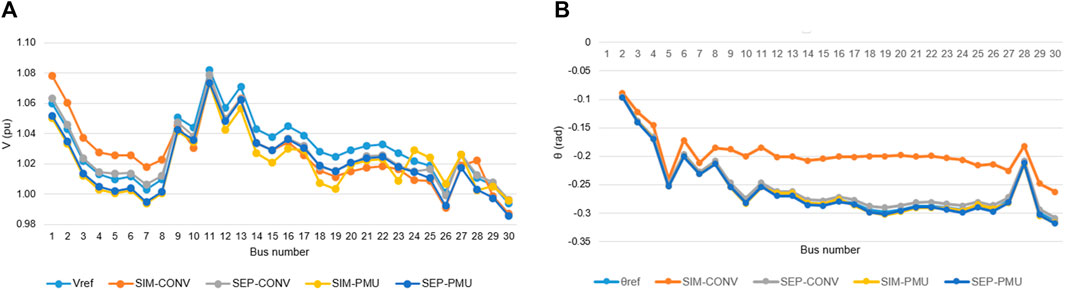
FIGURE 4. Reference and estimated values of the voltage (A) magnitude and (B) phase angle for the IEEE 30-bus network.
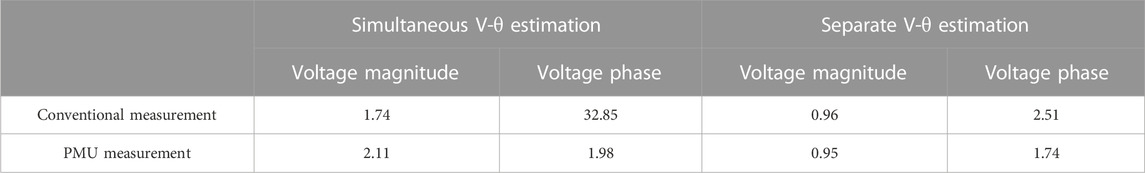
TABLE 2. Maximum error (%) of the IEEE 30-bus network voltage magnitude and phase in the four cases.
In the case of conventional measurement, the results show that using the simultaneous V-θ estimation gives a maximum error of 32.85%, which is much larger than the one of the separate V-θ estimation (2.51%). In addition, the estimated voltage magnitude error is reduced from 1.738% to 0.963%. In more detail, Figure 4B shows that the estimated phases by the simultaneous V-θ estimation using conventional measurement mostly have errors larger than 10%, while those of the separate V-θ estimation are always smaller than 3%. So the simultaneous V-θ estimation cannot be applied to this case. The separate V-θ estimation is good for this case.
In the case of PMU measurement, the maximum error of both two approaches is relatively small and can be acceptable. The maximum error value of this case, as shown in Table 2, is 2.11%. In this case, the simulation using SEP-PMU shows better results than in the case of SIM-PMU, and the percentage error value is reduced by about 2.2 times with the estimated voltage magnitude and 1.1 times with the estimated voltage phase. Hence, both the approaches are appropriate to solve this system.
3.3 IEEE 118-bus test case
The IEEE 118-bus network consists of 118 bus and 186 branches. This paper takes the parameters of the networks in Power Systems Test Case Archive (1993c).
The number of conventional measurements used in the estimation is 237, which are bus active and reactive powers at 118 buses, and a voltage magnitude of bus 69 is used. PMUs are installed at buses 3, 5, 9, 12, 15, 17, 21, 25, 29, 34, 37, 40, 45, 49, 52, 56, 62, 64, 68, 70, 71, 76, 79, 85, 86, 89, 92, 96, 100, 105, 110, and 114. There are 328 measurements by PMUs.
Solving the network by the simultaneous V-θ estimation with two types of measurement gives bad results. The separate V-θ estimation using 237 conventional measurements also has a large error, so the results are not presented here.
Figure 5 and Table 3 present only the results and maximum error of separate V-θ estimation using PMU data, respectively. The estimated results of this case are quite good. In Figure 5, the curve shows the estimated value of the voltage magnitude [SEP-PMU (V)] and phase angle [SEP-PMU (V)] very close to or equal to the reference value (Vref and θref). In Table 3, the maximum error of voltage magnitude is 2.76%, and the maximum error of voltage phase is 8.92%. The results show that the separate V-θ estimation using PMU data is appropriate to solve the network.
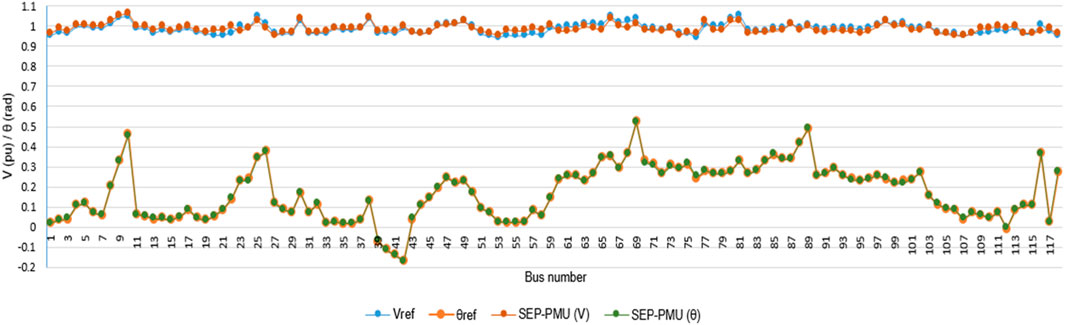
FIGURE 5. Reference and estimated values of V-θ for the IEEE 118-bus network.
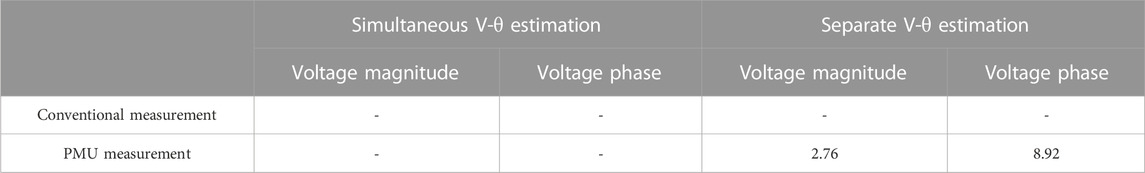
TABLE 3. Maximum error (%) of the IEEE 118-bus network voltage magnitude and phase in the four cases.
3.4 Comparison of the simulation results with existing publications
With the simulation results for the aforementioned three networks of 14-, 30-, and 118-bus systems, we find that the separate V-θ estimation is much better than the simultaneous V-θ estimation, specifically in the case when the number of state variables increases, as in the case of 30- and 118-bus networks. Using measured data from conventional measurements, the simultaneous V-θ estimation process results in very large errors in the grid of 30- and 118-bus networks. Meanwhile, our proposed GA with the separate V-θ estimation can give good results for all three grids using measured data from PMU.
To evaluate our proposed approach further, the aforementioned simulation results of the three networks are compared with the results of existing publications in Table 4. Among nine references in Table 4, there are five, four, and two papers which estimate the state of the IEEE 14-bus, 30-bus, and 118-bus networks, respectively. The error value of the proposed algorithm is also quite good when compared with published papers. The comparison shows that using genetic algorithms, previous works can solve small networks, while the weighted least square method (Jin and Shen, 2018) and the PSO algorithm (Tungadio et al., 2016) can solve large networks. Introducing the decoupling of voltage magnitude and phase in genetic algorithm iterations can solve large networks.
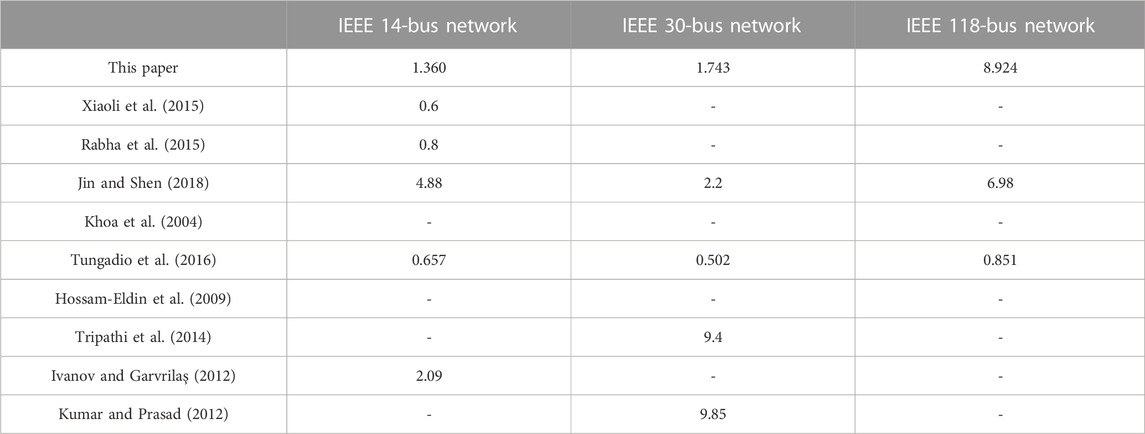
TABLE 4. Comparison of the maximum error (%) of the simulation results.
4 Conclusion
A smart grid requires a state estimation function. This paper presents a novel approach to genetic algorithms for estimating the power system state using both conventional and PMU data. Based on a strong coupling between active power and the voltage phase, as well as between reactive power and voltage magnitude, the voltage magnitude is around 1.0 p.u, and the voltage phase is around 0.0. Our approach proposes to estimate separately voltage magnitude and phase in every iteration of the genetic algorithm. The proposed approach is validated on the IEEE 14-bus, 30-bus, and 118-bus networks. The results show that the IEEE 14-bus and 30-bus networks with conventional or PMU data can be solved by the existing genetic algorithm and this approach. However, the separate magnitude and phase estimation gives better results than the others. There is no solution for the IEEE 118-bus network in the existing publications that use only GA. This paper can solve this network with our proposed approach using PMU data. The simulation results show that our proposed algorithm can be applied to estimate the voltage magnitude and phase angle for large smart transmission networks.
Data availability statement
The original contributions presented in the study are included in the article/Supplementary Material; further inquiries can be directed to the corresponding author.
Author contributions
Conceptualization, T-ST and T-T-HK; methodology, T-ST and T-T-HK; software, T-T-HK; validation, T-ST and T-T-HK; formal analysis, T-ST and D-TL; investigation, T-T-HK; resources, T-T-HK; data curation, T-T-HK; writing—original draft preparation, T-T-HK; writing—review and editing, T-ST and D-TL; visualization, T-T-HK and D-TL; supervision, T-ST; project administration, T-ST. All authors contributed to the article and approved the submitted version.
Conflict of interest
The authors declare that the research was conducted in the absence of any commercial or financial relationships that could be construed as a potential conflict of interest.
Publisher’s note
All claims expressed in this article are solely those of the authors and do not necessarily represent those of their affiliated organizations, or those of the publisher, the editors, and the reviewers. Any product that may be evaluated in this article, or claim that may be made by its manufacturer, is not guaranteed or endorsed by the publisher.
References
Abur, A., and Gómez Expósito, A. (2004). “Weighted least squares state estimation,” in Power system state estimation: Theory and implementation (New York, NY, USA: Marcel Dekker).
Celik, M. K., and Abur, A. (1992). Use of scaling in WLAV estimation of power system states. IEEE Trans. Power Syst. 7 (2), 684–692. doi:10.1109/59.141774
Haupt, R. L., and Haupt, S. E. (2004). “The continuous genetic algorithm,” in Practical genetic algorithms. 2nd ed. (Hoboken, NJ, USA: John Wiley & Sons), 51–56.
Hossam-Eldin, A. A., Abdallah, E. N., and El-Nozahy, M. S. (2009). A modified genetic based technique for solving the power system state estimation problem. Int. J. Electr. Comput. Eng. 3 (7), 1438–1447. doi:10.5281/zenodo.1074922
Hussein, M. A., and Sultan, A. J. (2018). “Enhancement of state estimation power system based hybrid algorithm,” in 2018 1st Annual International Conference on Information and Sciences (AiCIS), November 2018, Fallujah, Iraq, 164–169. doi:10.1109/AiCIS.2018.00040
Ivanov, O., and Garvrilaş, M. (2012). “State estimation for power systems with multilayer perceptron neural networks,” in 11th Symposium on Neural Network Applications in Electrical Engineering, Belgrade, Serbia, September 2012, 243–246. doi:10.1109/NEUREL.2012.6420026
Jin, T., and Shen, X. (2018). A mixed WLS power system state estimation method integrating a wide-area measurement system and SCADA technology. Energies 11 (2). doi:10.3390/en11020408
Kamh, M. Z., Younis, M. R., and Ibrahim, A. M. (2021). Globally optimal phasor measurement unit placement using branch and bound algorithm. Ain Shams Eng. J. 12 (3), 2789–2798. doi:10.1016/j.asej.2021.03.001
Khoa, T. Q. D., Binh, P. T. T., and Khoa, T. V. (2004). “Hopfield network and parallel genetic algorithm for solving state estimate in power systems,” in 2004 International Conference on Power System Technology, September 2004. Singapore, 845–849. doi:10.1109/ICPST.2004.1460111
Korres, G. N., and Manousakis, N. M. (2011). State estimation and bad data processing for systems including PMU and SCADA measurements. Electr. Power Syst. Res. 81 (7), 1514–1524. doi:10.1016/j.epsr.2011.03.013
Kumar, R., and Prasad, D. (2012). “Effect of bad measurements on state estimation in power system,” in 2012 IEEE Fifth Power India Conference, Murthal, India, December 2012, 1–5. doi:10.1109/PowerI.2012.6479495
Li, H., and Li, W. (2009). “A new method of power system state estimation based on wide-area measurement system,” in 2009 4th IEEE Conference on Industrial Electronics and Applications, Xi’an, China, May 2009, 2065–2069. doi:10.1109/ICIEA.2009.5138565
Madtharad, C., Premrudeepreechacharn, S., and Watson, N. R. (2003). Power system state estimation using singular value decomposition. Electr. Power Syst. Res. 67 (2), 99–107. doi:10.1016/S0378-7796(03)00080-4
Mahaei, S. M., and Navayi, M. R. (2014). Power system state estimation with weighted linear least square. Int. J. Electr. Comput. Eng. IJECE 4 (2), 169–178. doi:10.11591/ijece.v4i2.5874
Ni, D., Zhang, W., Yu, B., and Gong, W. (2011). “A new algorithm for power system state estimation with PMU measurements,” in 2011 International Conference on Mechatronic Science, Electric Engineering and Computer (MEC), Jilin, China, January 2011. 114–117. doi:10.1109/MEC.2011.6025413
Power Systems Test Case Archive, (1993a). 14 bus power flow test case. http://labs.ece.uw.edu/pstca/pf14/pg_tca14bus.htm (accessed Jan. 09, 2021).
Power Systems Test Case Archive, (1993b). 30 bus power flow test case. http://labs.ece.uw.edu/pstca/pf30/pg_tca30bus.htm (accessed Jan. 09, 2021).
Power Systems Test Case Archive, (1993c). 118 bus power flow test case. http://labs.ece.uw.edu/pstca/pf118/pg_tca118bus.htm (accessed Jan. 09, 2021).
Rabha, P., Shyam, C. C., and Sinha, A. K. (2015). “Hybrid state estimation of power system using conventional and phasor measurements,” in 2015 International Conference on Energy, Power and Environment: Towards Sustainable Growth (ICEPE), Shillong, India, June 2015, 1–6. doi:10.1109/EPETSG.2015.7510083
Rahman, Md. A., and Venayagamoorthy, G. K. (2017). A hybrid method for power system state estimation using Cellular Computational Network. Eng. Appl. Artif. Intell. 64, 140–151. doi:10.1016/j.engappai.2017.05.018
Salkuti, S. R. (2020). Artificial fish swarm optimization algorithm for power system state estimation. Indones. J. Electr. Eng. Comput. Sci. 18 (3). doi:10.11591/ijeecs.v18.i3.pp1130-1137
Tran, T. S., and Kieu, T. T. H. (2021). “Choice of selection methods in genetic algorithms for power system state estimation,” in Advances in engineering research and application, Springer, Berlin, Germany, 223–231. doi:10.1007/978-3-030-64719-3_26
Tripathi, P., Rahul, J., and Radhamohan, N. A. (2014). “Analysis of state estimation for power system using weighted least square method,” in 2014 IEEE International Conference on Computational Intelligence and Computing Research, Coimbatore, India, December 2014, 1–5. doi:10.1109/ICCIC.2014.7238483
Tungadio, D. H., Jordaan, J. A., and Siti, M. W. (2016). Power system state estimation solution using modified models of PSO algorithm: Comparative study. Measurement 92, 508–523. doi:10.1016/j.measurement.2016.06.052
Vedik, B., and Chandel, A. K. (2015). “Power system state estimation using gravitational search algorithm,” in 2015 International Conference on Computer and Computational Sciences (ICCCS), Greater Noida, India, January 2015, 32–38. doi:10.1109/ICCACS.2015.7361318
Weng, Y., Li, Q., Negi, R., and Ilić, M. (2012), “Semidefinite programming for power system state estimation,” in 2012 IEEE Power and Energy Society General Meeting, San Diego, CA, USA, July 2012, 1–8. doi:10.1109/PESGM.2012.6345536
Xiaoli, Y., Zongshuai, H., Rusen, F., Haotian, X., Heng, Y., Yong, W., et al. (2015), “Weighted least squares state estimation based on the optimal weight,” in 2015 Third International Conference on Technological Advances in Electrical, Electronics and Computer Engineering (TAEECE), Beirut, Lebanon, April 2015, 12–16. doi:10.1109/TAEECE.2015.7113592
Keywords: conventional measurement, decoupling, genetic algorithm, phasor measurement unit, state estimation, transmission network
Citation: Tran T-S, Kieu T-T-H and Le D-T (2023) Decoupling of voltage magnitude and phase in genetic algorithms for smart transmission network state estimation. Front. Energy Res. 11:1204072. doi: 10.3389/fenrg.2023.1204072
Received: 11 April 2023; Accepted: 19 May 2023;
Published: 06 June 2023.
Edited by:
Mamadou Baïlo Camara, University of Le Havre, FranceReviewed by:
Badre Bossoufi, Sidi Mohamed Ben Abdellah University, MoroccoDjamel Ikni, Mobility and electrical network expert, France
Copyright © 2023 Tran, Kieu and Le. This is an open-access article distributed under the terms of the Creative Commons Attribution License (CC BY). The use, distribution or reproduction in other forums is permitted, provided the original author(s) and the copyright owner(s) are credited and that the original publication in this journal is cited, in accordance with accepted academic practice. No use, distribution or reproduction is permitted which does not comply with these terms.
*Correspondence: Thanh-Son Tran, c29udHRAZXB1LmVkdS52bg==