 Yizhi Wu1†
 Aiqng Cao
- 1Exploration and Development Research Institute of Shengli Oilfield Company, Dongying, China
- 2Key Laboratory of Unconventional Oil & Gas Development, China University of Petroleum (East China), Ministry of Education, Qingdao, China
- 3School of Petroleum Engineering, China University of Petroleum (East China), Qingdao, China
- 4South China Sea East Petroleum Research Institute CNOOC (China) Co. LTD, Shenzhen, China
There are abundant bottom water reservoirs in China. Unlike conventional oil reservoirs, bottom water reservoirs have various problems, such as early water breakthrough, short water-free oil recovery period, and rapid water cut increase. For example, during water flooding, the injected water easily breaks into the bottom water and does not effectively displace the upper crude oil. The recovery rate is generally low. Based on this phenomenon, an experimental study of nitrogen foam flooding in bottom water reservoirs is conducted in this paper. The seepage characteristics of nitrogen foam in oil and water layers are studied through one-dimensional core tube experiments. Through two-dimensional plate oil displacement experiments, we have revealed the fluid migration and distribution characteristics in the plane and vertical directions during nitrogen foam flooding in bottom water reservoirs; additionally, we have summarized the mechanisms of nitrogen foam in bottom water reservoirs involved in improving oil recovery characteristics. The research results show that the seepage resistance of foam in the water layer is much greater than that in the oil layer, effectively increasing the displacement strength of the oil layer. During the development stage of bottom water flooding in bottom water reservoirs, the water cut increases rapidly, the bottom water coning is obvious, and the residual oil is mainly distributed between the oil wells and the upper part of the oil layer near the wellbore. During nitrogen foam flooding, the foam enters the water layer to form an effective plug so that the subsequent foam is diverted into the oil layer; additionally, the oil is displaced laterally to the production well for production. When the foam enters the oil layer, it defoams and floats to form a secondary gas cap; this effect causes displacement of the residual oil at the top and effectively improves the displacement efficiency by weeping volume of the injected fluid”
1 Introduction
During the bottom water reservoir development, the existence of bottom water affects the recovery efficiency of the reservoir. Various problems such as early water breakthrough, short water-free oil recovery period, rapid water cut increase, high oil recovery cost and low economic benefit have led to the recovery rate being generally low and increasing the risk of oil field exploitation (Wang et al., 2019a; Alyousef et al., 2020). The core problem to be solved during the development of bottom water reservoirs is to effectively inhibit the bottom water coning or ridging and enhance the oil recovery. Horizontal well is an effective method to exploit the residual oil in bottom water reservoirs, but it also only delays the water breakthrough time, and more oil can be produced before the water breakthrough of oil wells. Once water breakthrough occurs, the water cut increases significantly, which inhibits the flow of oil, and a large amount of residual oil remains in the middle and upper part of the reservoir, reducing the production efficiency (Liu et al., 2016; Wang and Liu, 2020; Zoeir et al., 2020). To address this problem, nitrogen foam flooding is an effective method for improving oil recovery in the middle and late stages of bottom water reservoir development. Nitrogen foam flooding has the characteristics of both nitrogen and surfactant flooding and has the unique properties of rheology and plugging (Liu et al., 2015; Zhao et al., 2017; Zhang et al., 2019; Wang et al., 2023). Gas floating significantly improves the production degree of residual oil at the top of the reservoir. Foam can effectively plugging the water layer, reducing the large amount of injected fluid into the bottom water, improving the displacement strength of the top oil layer, and providing a strong guarantee for the development of bottom water reservoirs (Qu et al., 2018; Wen et al., 2019; Li et al., 2020).
To develop this kind of reservoir efficiently, scholars have conducted many studies (Lotfollahi et al., 2016; Autxu et al., 2017; Wei et al., 2017; Xu et al., 2017; Hematpur et al., 2018; Wang et al., 2019b; Cao et al., 2022a; Wang et al., 2022). L.W. Holm (Holm, 1970) found that foam injected with a mixture of gas and foaming agent solution was a better displacement agent than a single gas, resulting in more oil recoverey from the reservoir; this process improves the oil displacement efficiency. Craig (Craig and Lummus, 1965) conducted an indoor experimental study on foam flooding, adopting a method of injecting foam into an injection well to drive oil to one or more production wells to recover oil from the reservoir. The results showed that the development effect of foam injection was better than that of water injection under the same conditions, and foam injection could effectively improve the oil recovery. (Xiao et al., 2020) conducted an experimental study on nitrogen foam flooding to solve the problems of poor injection ability and unsuitable polymer injection in low-permeability reservoirs. After injecting nitrogen foam, it was found that nitrogen foam flooding improved the oil recovery by approximately 9.63%. The water cut of the Cao 20–10–18 well group in the Shengli Oilfield increased to 90% after development. In 1994, a nitrogen foam flooding experiment was conducted, and nitrogen foam was injected into the well group by coinjection. After this measure was taken, the water cut of the well group decreased to 85%, and the oil production increased by more than 6,000 t in 1 year. Foam flooding has the dual functions of improving the oil displacement and sweep efficiencies, which is an effective method for improving oil recovery (Liu and Min, 1996). The heavy oil reservoir of the Karamay Oilfield has strong heterogeneity, a thin oil layer and low natural energy. In 1985, the field application practice of nitrogen injection-assisted huff and puff began, and eight production wells were fully effective. As of November 2013, the statistics showed that the cumulative oil increase was 970.8 t (Xiang et al., 2017). According to the actual situation of the test well group, foam profile control has exhibited an obvious oil increasing effect, long duration and good economic benefits; this indicates that nitrogen foam flooding technology is relatively mature and can be widely used. However, the current research only focuses on the experimental comparison of the macro development effect, and there is still a lack of research on its micro mechanism and action mode. Therefore, it is extremely important to study the mechanism of this technology in this paper (Chen et al., 2020; Zhang et al., 2023).
Based on this phenomenon, this paper studies the seepage mechanism, influencing factors and adaptability of nitrogen foam flooding in bottom water reservoirs by means of indoor one-dimensional core tube experiment and two-dimensional visualization experiment, so as to further improve the nitrogen foam flooding technology, clarify the fiuid migration and distribution characteristics of nitrogen foam flooding, and discover the mechanism of nitrogen foam flooding to enhance oil recovery, which is of great significance to improve the application level of nitrogen foam flooding in bottom water reservoirs (Sanders et al., 2017; Shah et al., 2020; Cao et al., 2022b).
2 Experiment
2.1 Experimental materials
The nitrogen used in the experiments was produced by Qingdao Hengyuan Gas Co., Ltd. with a purity of ≥99.8%. The water used in the experiments was deionized water made by an ultrapure water apparatus with a resistivity of 18.25 MΩ cm. The oil used in the experiments was made of heavy oil and kerosene with a viscosity of 300 mPas at 25°C; the foaming agent solution was an HY-2 solution produced by Shandong Ruiheng Xingyu Petroleum Technology Development Co., Ltd.
2.2 Experimental apparatus
Sand pack model: The inner diameter was 25.4 mm, the length was 300 mm, and the inside was filled with 80-mesh quartz sands.
Two-dimensional visualization model: This model was self-developed by the laboratory with a size of 250 × 250 × 10 mm, and it was hermetically designed for a front and rear two-layer glass with a maximum pressure of 0.8 MPa. The inside was filled with glass beads, and the bottom of the injection and production wells was perforated.
Other experimental apparatuses included a high-pressure plunger pump (ISCO plunger pump) (Model 100DX, Teledyne Technologies Company), pressure gauge, gas flowmeter, one-way valve, three-way valve, foam generator, high-definition camera, gas pressure reducing valve, white luminous plate, intermediate vessels and experimental glass apparatus.
2.3 Experimental procedures
2.3.1 One-dimensional core tube experiment
1) The experimental instruments and apparatus were debugged to ensure their normal operation.
2) The sand pack was cleaned, 80-mesh quartz sand was filled into the sand pack according to the preset core permeability (approximately 1,000 × 10−3 μm2) and compacted, and then the dry weight of the sand pack was determined.
3) A small amount of nitrogen was injected into the sand pack, and a small amount of foam was smeared to the joint at both ends of the sand pack to check the airtightness. After inspection, the sand pack was connected to a vacuum pump and vacuumed for 4 h.
4) The sand pack was taken down after vacuuming to self-suck the saturated water, the wet weight was determined and the pore volume was calculated.
5) Experimental devices were connected, the sand pack was displaced with formation water at a flow rate of 1 mL min-1, the pressure value was recorded after the injection pressure was stable, and the core permeability was evaluated to verify if it was within the required range (see Table 1 for parameters of experimental sand filling cores).
6) The sand pack was saturated with crude oil, the specimen was placed in a constant-temperature environment for 1 day, and the initial oil saturation was calculated.
7) The experimental devices were connected as shown in Figure 1. Oil was displaced with formation water at a flow rate of 1 mL min-1 until the water cut at the outlet reached 98%, and the production data were recorded.
8) The sand pack was continuously displaced by nitrogen foam until the water cut at the production end increased to 98%, and the production data were recorded.
9) The sand pack was replaced, a sand pack was added to replace the parallel displacement mode, and steps 1–8 were repeated.
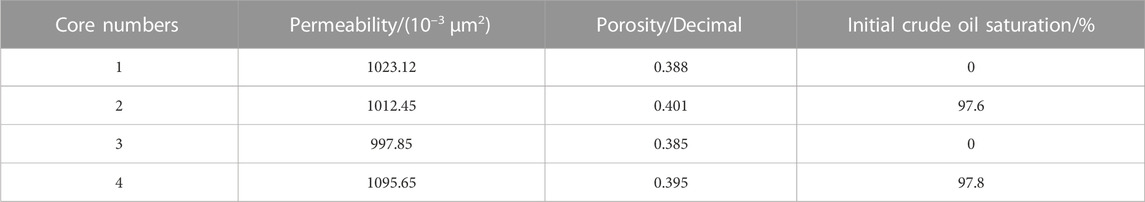
TABLE 1. Sand filling core parameters table.
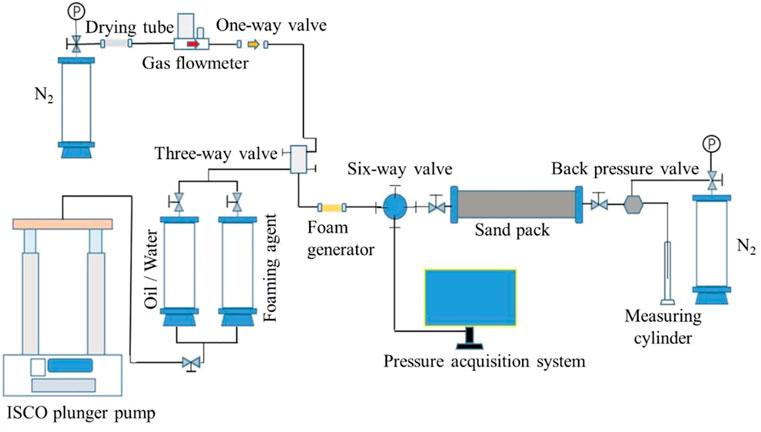
FIGURE 1. Flow diagram of the one-dimensional core tube experiment.
2.3.2 Two-dimensional visualization experiment
1) The model was cleaned, an injection well and a production well were arranged in the upper part of the model (the two wells were produced simultaneously in the bottom water flooding stage, a well was injected, and a well was produced in foam flooding), and the bottom water injection end was arranged at the bottom.
2) Glass beads were filled into the two-dimensional flat model; after compaction, a small amount of gas was introduced to check the airtightness of the model.
3) The model was saturated with water and oil at a rate of 1 mL min-1, and the pore volume, water saturation and oil saturation were calculated.
4) The intermediate vessel filled with formation water was connected to the bottom water injection end at the bottom of the model, the bottom of the intermediate vessel was connected to the gas cylinder simultaneously, and the pressure reducing valve was used to maintain the bottom water pressure during the experiment to simulate the bottom water production, as shown in Figure 2.
5) Other valves were closed, a luminous plate on the back of the model was installed and the gas cylinder switch connected with bottom water was opened for bottom water flooding until the water cut at the outlet reached 98%, and the oil production, water cut and other extraction characteristics were recorded.
6) The bottom water pressure was maintained, foam was injected into the injection well at a rate of 1 mL min-1, and crude oil was displaced. After displacement started, all experimental parameters were recorded, and the distribution, migration and produced liquid states of oil, gas and water were recorded at different times with a high-definition camera.
7) The experimental device was arranged, and the experiment was completed.
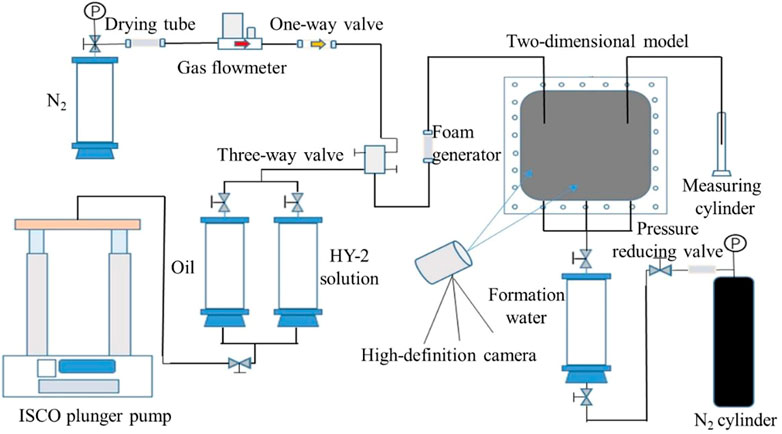
FIGURE 2. Flow diagram of the two-dimensional visualization experiment.
3 Analyses of the experimental results
3.1 Analyses of the one-dimensional core tube experiment results
3.1.1 Study on the characteristics of nitrogen foam seepage resistance
Core No. 1 was a saturated water core, and a seepage resistance characteristic experiment of nitrogen foam water layers was conducted. First, a water flooding experiment was conducted with a cumulative water injection of 1 PV, and then 4 PV foam was injected into the core. After foam flooding, a 1.5 PV water flooding experiment was conducted, and the experimental results are shown in Figure 3.
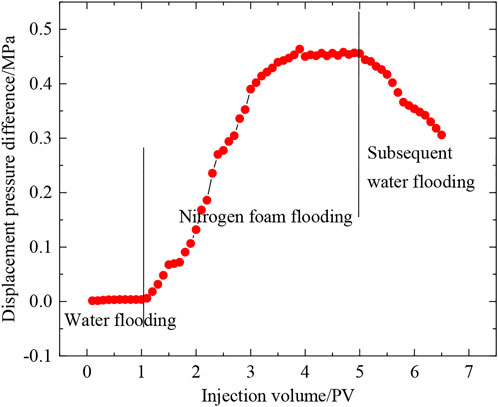
FIGURE 3. Pressure differences between water flooding and foam flooding under oil-free conditions.
At the water flooding stage, the seepage resistance of injected water in the core tube was low, and the water flooding pressure was only 3.5 × 10⁻³ MPa when it was stable.
At the nitrogen foam flooding stage, the displacement pressure difference increased rapidly with increasing volumes of injected foam. When the volume of injected foam reached 3 PV, the displacement pressure difference reached a maximum of 0.45 MPa. At this time, the core tube was completely filled with foam, and the injected foam was trapped in the pores of the formation core in large quantities, forming a good plug. According to Eq. 1, the foam flow resistance factor reached 130.11 at this time, and the plugging performance of the injected nitrogen foam was remarkable. After the injection pressure of nitrogen foam peaked and then the foam was continuously injected for 1 PV, the foam flow resistance basically did not increase, and the injection method changed to water flooding.
At the stage of subsequent water flooding, the injected water started to flush the nitrogen foam trapped in the formation pore space; since part of the nitrogen foam was washed by the injected water, the displacement pressure began to decrease significantly at this time. After 1.5 PV water was injected, the displacement pressure difference decreased from 0.45 MPa to 0.306 MPa, and the pressure decrease was obvious. According to Eq. 2, the residual resistance factor of nitrogen foam flooding was 87.43 at this time, and the resistance factor decreased by 32.24%. Based on the above analysis of the experimental results, it was found that injected nitrogen foam formed an effective plug in water layers, and it had good anti-scouring abilities. After nitrogen foam flooding finished, it played a certain profile control role in the subsequent water flooding stage, forming an effective plug.
where RF is the resistance factor, which represents the plugging strength of foam; ΔPf is the pressure drop of nitrogen foam flowing through the core at the same flow rate, MPa; and ΔPb is the pressure drop of injected water flowing through the core at the same flow rate, MPa.
where RRF is the residual resistance factor, which represents the anti-scouring ability of foam; ΔPa is the core pressure drop after a certain volume is displaced by a certain medium after foam plugging, MPa; and ΔPb is the pressure drop of injected water flowing through the core at the same flow rate, MPa.
Core No. 2 was a saturated oil core. First, Core No. 2 was driven by water to over 98% water cut at the outlet, and then it changed to nitrogen foam flooding. The experimental results are shown in Figure 4.
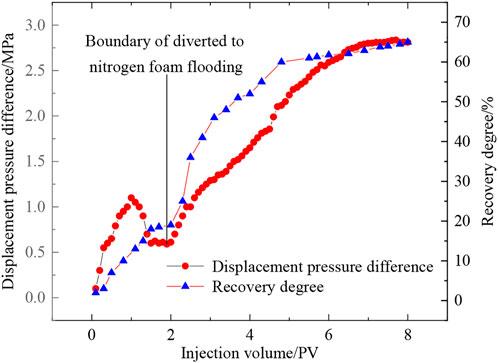
FIGURE 4. Nitrogen foam flooding characteristic curves.
In the early stage of water flooding, the displacement pressure difference increased rapidly. At this stage, the injected water did not rush to the outlet of the core tube; thus, the water flooding resistance was large. As the injected water rushed into the formation and reached the core outlet, the displacement pressure difference of water flooding began to decrease rapidly and finally stabilized at 0.61 MPa; at this time, the water cut of the core tube outlet basically reached 98%. From the perspective of oil recovery, after the displacement pressure difference of water flooding reached a stable level, the oil recovery of water flooding basically did not increase; additionally, the oil recovery of water flooding finally reached 19%, which was at a low level.
When the displacement mode changed to nitrogen foam flooding, the displacement pressure difference started to increase obviously. From the specific form, in the early stage of nitrogen foam injection, the displacement pressure difference increased slowly. At this stage, the nitrogen foam that was injected into the core quickly defoamed after encountering oil, which could not be effectively plugged. With the increase in the PV number of the injected nitrogen foam, crude oil in some formations started to be produced gradually, and the injected nitrogen foam began to be trapped in formation pores. Under the superposition of the Jamin effect, the displacement pressure difference started to increase rapidly with increasing injected fluid volume; finally, the displacement pressure difference reached 2.85 MPa, which was much higher than the stable pressure difference of 0.61 MPa in the water flooding stage. For the recovery rate curve, the recovery degree of core crude oil increased significantly after changing to nitrogen foam flooding and finally increased from 19% in the water flooding stage to 65%, and the recovery degree increased significantly.
3.1.2 Study on the characteristics of nitrogen foam diversion
Core No. 3 was a saturated water core, and Core No. 4 was a saturated oil core. First, Core No. 4 was driven by water to the residual oil stage, and then it was connected with Core No. 3 in parallel. Water flooding was conducted at a flow rate of 2 mL min-1 first, and then it changed to nitrogen foam flooding at the same flow rate after the diversion rate of the water flooding core tube stabilized. The experimental results are shown in Figure 5.
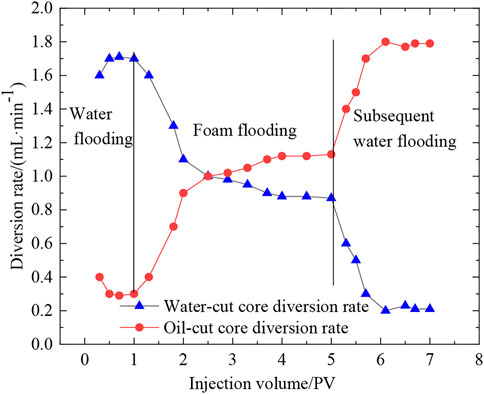
FIGURE 5. Experimental results of the parallel flow of core pipes.
After parallel connection, the difference between the diversion rate of the oil-bearing core tube and saturated water core tube was obvious in the early stages of water flooding. With the increase in injection volume, the diversion rate of the two core tubes gradually stabilized; finally, the diversion rate of the saturated water core tube reached 1.7 mL min-1, and the diversion rate of the oil-bearing core tube was 0.3 mL min-1. There was a significant difference in the diversion rate between oil-bearing and saturated water core tubes.
In the stage of nitrogen foam flooding, the diversion rate of the oil-bearing core tube started to increase rapidly with the injection volume, and the diversion rate of the saturated water core tube decreased rapidly. The diversion rate of the two core tubes finally reached stability, and the diversion rate of the saturated water core tube remained at 0.9 mL min-1. The diversion rate of the oil-bearing core tube remained at 1.1 mL min-1, which was always higher than that of the saturated water core tube. By analysing the reasons for this phenomenon, at the early stage of nitrogen foam injection, the injected foam in the core tube of saturated water quickly accumulated to form an effective plug, and the seepage resistance of the injected nitrogen foam increased rapidly. However, the foam injected into the oil-bearing tube was affected by crude oil and quickly defoamed when exposed to oil, and there was no obvious change in seepage resistance in the oil-bearing tube; thus, the subsequent foam began to enter the oil-bearing tube in large quantities, resulting in the rapid approach of the diversion rate between the oil-bearing tube and the saturated water tube. With the increasing injection volume of nitrogen foam, the seepage resistance in the saturated water core tube gradually reached the peak value, and the diversion rate of the two core tubes gradually stabilized. However, there was still a certain amount of residual oil in the oil-bearing tube, and the seepage resistance of the foam was always smaller than that in the water-bearing tube; thus, the diversion rate of the oil-bearing tube was always higher than that of the saturated water core tube in the stabilization stage.
In the subsequent water flooding stage, with the increase in the injected water volume, the diversion rate in the oil-bearing tube increased rapidly, and the diversion rate in the saturated water core tube decreased rapidly. This phenomenon occurred because in the subsequent water flooding process, compared with the saturated water core tube, the nitrogen foam in the oil-bearing tube was less stable due to the influence of crude oil; additionally, the nitrogen foam was quickly removed by the flushing of injected water, resulting in a rapid decrease in seepage resistance. However, in the saturated water core tube, the nitrogen foam had a relatively good stability, a strong anti-scouring ability, and a small reduction in the seepage resistance in the tube; thus, many subsequent injection fluids entered the oil-bearing tube.
From the above experimental analysis, it could be seen that under the oil–water colayered condition, nitrogen foam could exist stably in the water layer and form an effective plug. When nitrogen foam encountered the residual oil in the oil layer, it defoamed rapidly; thus, more subsequent injected fluids could be diverted into the oil layer, balancing the diversion rates of oil and water layers, effectively displacing the residual oil in the oil layer and thus effectively improving the recovery degree of crude oil from the formation.
3.2 Analyses of the two-dimensional visualization experimental results
3.2.1 Study on the characteristics of bottom water flooding and oil–water distribution
The two-dimensional model used in the experiments is shown in Figure 6. The injection well and the production well were distributed on both sides of the upper part of the model, and the bottoms of the tubes were perforated. The injection and production wells were arranged in the upper area of the oil layer. The production method in the bottom water flooding stage involved double wells for simultaneous production, and the production method in the nitrogen foam flooding stage involved one well for injection and one well for production.

FIGURE 6. (A) Two-dimensional plate model and (B) well layout diagram.
The states of the saturated water and oil of the model after sand filling are shown in Figure 7.
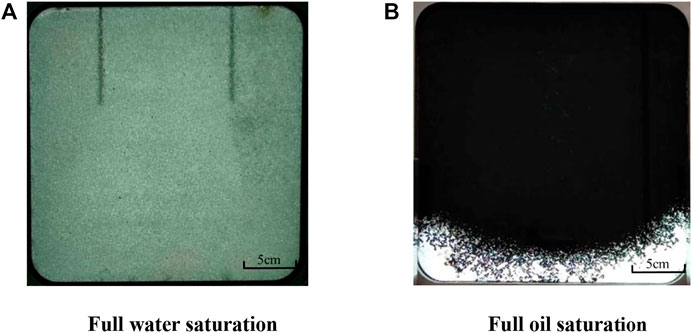
FIGURE 7. Model saturated water and saturated oil states. (A) Full water saturation. (B) Full oil saturation.
In the bottom water flooding stage, the pressure of the bottom water was controlled by a pressure reducing valve, and the injection and production wells were produced as production wells simultaneously. In the picture of the experimental results, the bright white part was the initial bottom water area; the grey white part was caused by the fact that after the crude oil was displaced in the bottom water flooding process, part of the residual oil remained in the formation under the backlight.
The results of bottom water oil flooding at different flow rates are shown in Figure 8 By analysing the oil displacement results at different flow rates, it could be found that under the flow rate of 1 mL min-1, the oil–water interface was irregularly distributed in the results of bottom water flooding. The oil was slightly finger-in, but the bottom water coning phenomenon was not obvious; additionally, no obvious water coning development was observed. However, as the flow rate increased to 5 mL min-1, the final results of bottom water flooding showed that a well-developed water coning began to appear at the bottom of the production wells. When the flow rate of bottom water further increased to 10 mL min-1, the phenomenon of bottom water coning became more obvious. At a flow rate of 10 mL min-1, the water coning formed after the bottom water coning was more completely developed, and a large amount of crude oil at the bottom of the production wells was displaced; this phenomenon left a large grey‒white area at the bottom of the well after being swept by bottom water flooding.
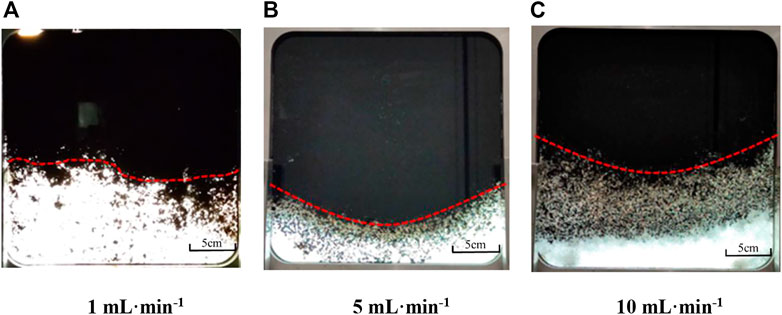
FIGURE 8. Results of water flooding with different flow rates. (A) 1 mL min−, (B) 5 mL min−, (C) 10 mL min−.
Figure 9 shows the process of bottom water flooding under a flow rate of 10 mL min-1. In the early stage of bottom water flooding, the crude oil at the bottom of the formation was first displaced and produced; the oil–water interface began to move upwards slightly at this stage, and the formation in the swept range appeared greyish white. With the gradual increase in the bottom water injection volume, the oil–water interface started to move upwards gradually, showing that the two wings of the oil–water interface moved upwards slightly more than the middle interface. When the injection volume of the bottom water reached 1.0 PV, the bottom water coning was fully developed, and the oil–water interface was pushed to the bottom of the production wells. At this time, the water cut of the production wells increased to more than 98%, and the production wells basically stopped producing oil. Figure 9C shows that when the oil–water interface was not pushed to the bottom of the well, the crude oil in the formation displaced by bottom water was basically completely displaced and appeared greyish white under backlight conditions. After the oil–water interface was pushed to the bottom of the well, a typical bottom water coning phenomenon formed. At this stage, after the water coning advanced to the bottom of the well, the water layer completely communicated with the well. At this time, the injected bottom water entered the well directly along the inside of the water coning, and the subsequent injection of bottom water could no longer effectively improve the swept range of bottom water flooding. In addition, the water coning basically stopped pushing upwards after it reached the bottom of the well, and the shape of the water coning basically did not change; however, the oil recovery rate basically did not increase.
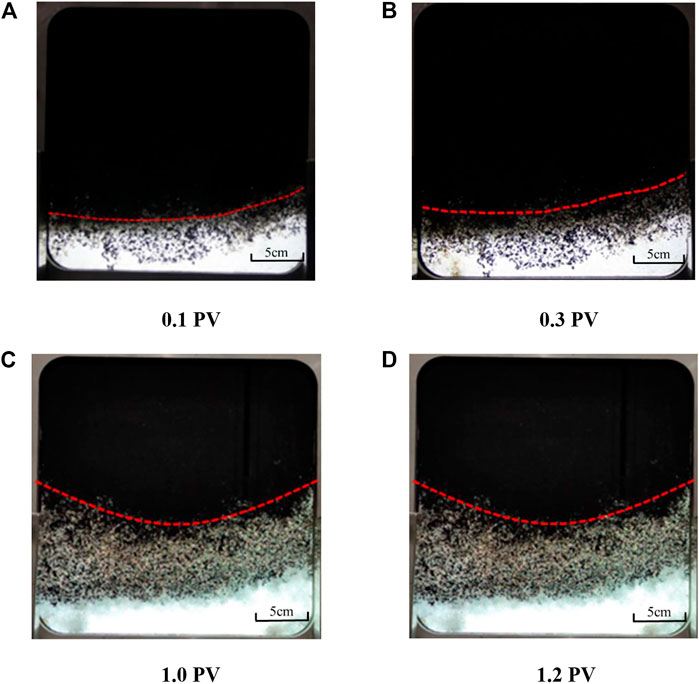
FIGURE 9. Results of 10 mL min-1 flow water flooding. (A) 0.1 PV, (B) 0.3 PV, (C) 1.0 PV, (D) 1.2 PV.
According to the distribution of residual oil, after the bottom water coning fully developed, the crude oil in the swept range at the lower part of the water coning basically displaced completely, and the oil–water interface moved up significantly. In the lower part of the oil–water interface, only a small amount of residual oil existed, a large amount of residual oil in the reservoir was distributed in the non-swept range of the upper part of the oil layer, and a large amount of residual oil that was not swept and displaced was left between the water coning on both sides.
Figure 10 shows the recovery curves at different displacement stages. By analysing the experimental results, it could be seen that the stage of waterless oil recovery was short during bottom water flooding, and the water cut increased quickly to 85.7% after the injected volume of bottom water reached 0.15 PV; additionally, the water cut of bottom water flooding production wells increased extremely fast. With the increasing volume of bottom water injection, the water cut of the production wells continued to increase gradually and exceeded 92%. In terms of stage oil production, the oil production in the early stage of bottom water flooding was relatively high, and the oil production could reach 8.6 mL in the first two counting points. However, with the rapid increase in the water cut in the production wells, the oil production in the middle and late stages of bottom water flooding decreased significantly. The oil production throughout the middle and late stages remained between 2 and 3 mL, and the recovery degree in the bottom water flooding stage was lower at only 18.8%.
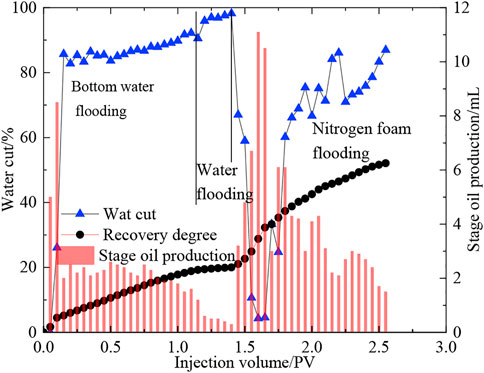
FIGURE 10. Recovery curves at different displacement stages.
To compare the oil displacement effects of water flooding and nitrogen foam flooding under different conditions during water invasion, first, after the water cut of the production wells reached 92%, the right well of the two production wells was restored to be an injection well. The bottom water pressure was kept unchanged, and water flooding was conducted. The production curve of the water flooding stage is shown in Figure 10. According to the analysis of the production curve in the water flooding stage, under the condition of bottom water intrusion, the water cut of the production well further increased from 92% to 98.3% after adopting the water injection development method of water injection wells. After water injection of 0.3 PV, the recovery degree increased from 18.8% to 20%, with a 1.2% improvement. In terms of stage oil production, the stage oil production decreased from 2–3 mL to 0.5–1 mL at the same counting points of the water injection development stage. The results indicated that under the condition of bottom water intrusion, the residual oil could not be effectively produced by water injection development; additionally, the contribution of water injection development to improved oil recovery was extremely low.
3.2.2 Study on the characteristics of nitrogen foam flooding and fluid migration characteristics
At the end of the water flooding stage, the water cut of the production well exceeded 98%, at which point it was diverted to nitrogen foam flooding (to identify the foam distribution, the foaming agent was dyed blue with bright blue dye); the experimental results are shown in Figure 11.
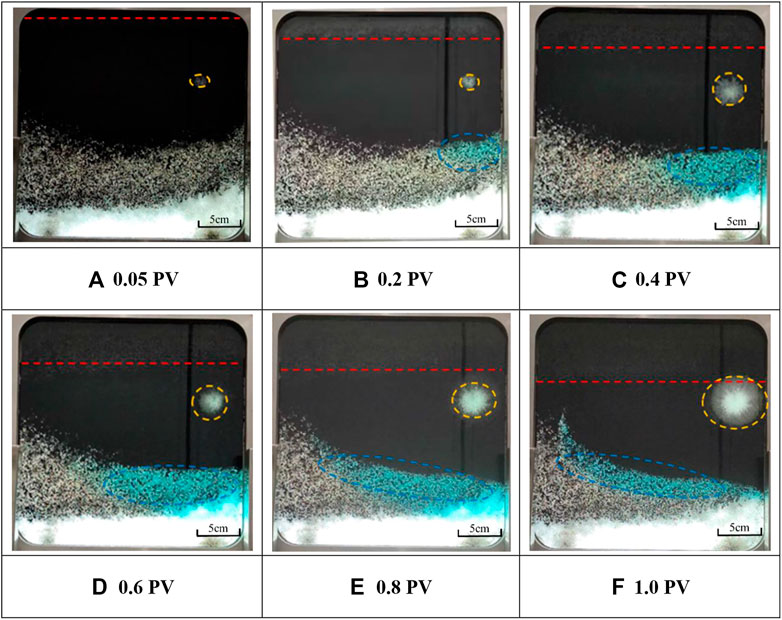
FIGURE 11. Results of nitrogen foam flooding at different stages. (A) 0.05 PV, (B) 0.2 PV, (C) 0.4 PV, (D) 0.6 PV, (E) 0.8 PV, (F) 1.0 PV.
According to the analysis of the experimental images, when the volume of the injected foam was 0.05 PV, some of the foam could be observed near the bottom of the injected wells, the brightness started to increase, and some of the crude oil was cleaned by the foam. This phenomenon occurred because the foaming agent HY-2 had both foaming and emulsifying effects, and the formed nitrogen foam had a stronger oil washing ability than water, which could effectively displace the residual oil formation pores that could not be completely displaced in the water flooding stage. Additionally, since there a large amount of crude oil remained in the oil layer that had not been produced, the injected foam was prone to defoaming when encountering oil. Under the action of gravity differentiation, the nitrogen floated on the top of the oil layer to form a secondary gas cap (which is the red dotted line in Figure 11A), displacing the residual oil at the top. In the initial stage of nitrogen foam flooding, the gas formed by injecting nitrogen foam defoaming moved in the direction of the production well, forming a small secondary gas cap in the oil lay range at the top of the production well. When the injection volume of nitrogen foam reached 0.2 PV, the range of nitrogen foam cleaning at the bottom of the injection well increased, the brightness gradually increased, and the gas cap volume at the upper part of the oil layer further increased and developed near the injection well. More formation crude oil was displaced to the production well, and the oil–water interface obviously moved downwards. When the injection volume of nitrogen foam reached 0.4 PV, a blue area appeared in the water layer, which was generated by a large amount of dyed nitrogen foam accumulating in the water layer (the blue oval part in Figure 11C). As the injected nitrogen foam formed an effective plug in the water layer, the lateral displacement ability of the injected foam increased, effectively improving the lateral flow ability of crude oil. When the foam injection volume reached 1.0 PV, the crude oil around the injection well was basically displaced cleanly, the volume of the gas cap at the upper part of the oil layer and the volume of blue foam in the water layer further increased, and the downwards movement distance of the oil–water interface reached a maximum value.
Combined with the analysis of the liquid production characteristic curve in the nitrogen foam flooding stage in Figure 10, it was found that the water cut of the produced fluid in the production well started to drop rapidly as the nitrogen foam started to be injected into the oil layer. After injecting 0.05 PV of nitrogen foam, the water cut of the production well rapidly decreased to 67%; when the injection volume reached 0.2 PV, the water cut of the production well decreased to 4.3%, which was 94% lower than that of bottom water flooding. Then, the water cut of the production well began to increase gradually and finally reached 87%, but it was still lower than the water cut of 98% under the condition of water flooding. After injecting nitrogen foam, the oil production in each stage increased rapidly, from 0.3 mL in the water flooding stage to 11.1 mL; there was a cumulative oil increase of 51.5 mL in 0.4 PV of injection volume, and the oil recovery increased by 17.2%. After the end of the whole foam flooding stage, 96.3 mL of crude oil increased in total, and the overall recovery degree increased by 32.1%, with an obvious effect of increasing oil and production.
Figure 12 shows the state of produced liquid in nitrogen foam flooding stage. The water cut of the produced liquid was related to the colour of the produced water in the produced liquid overall. The colour of the water in the produced fluid gradually deepened, and the water cut of the produced liquid gradually decreased during the stage from water flooding to nitrogen foam flooding. This phenomenon indicated that the injected nitrogen foam could effectively displace the residual oil in the formation; furthermore, the surfactant formed after defoaming could effectively displace crude oil to improve a part of the crude oil recovery.
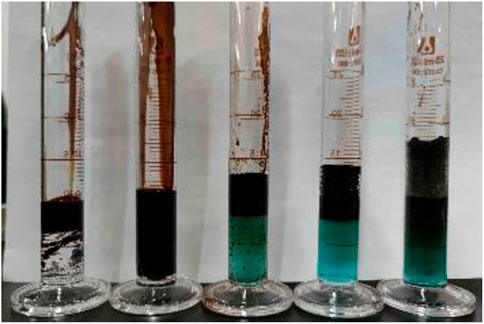
FIGURE 12. Produced fluid status in nitrogen foam flooding stage.
4 Conclusion
During the bottom water reservoir development, injecting nitrogen foam can effectively plug the water layer, solve the water channeling problem, play a good role in profile control and anti-scouring, and greatly enhance the oil recovery. The specific conclusions are as follows.
1) The single-pipe displacement experiments showed that nitrogen foam could effectively enter the pores of the water-bearing formation and be trapped in it. The plugging was effectively produced by superimposing the Jamin effect, and the resistance factor reached 130.11; this phenomenon could play a certain anti-scouring role in the subsequent water flooding process. After continuous water injection of 1.5 PV, the residual resistance factor could be maintained at 87.43.
2) In the double-tube parallel experiments, the injection of nitrogen foam could effectively solve the problem of injected water channeling into the water layer under the oil–water colayered condition; additionally, it could produce effective plugging in the water layer so that more injected water could enter the oil layer. The effect could help control the oil-water profile in the subsequent water flooding process and effectively improve the crude oil recovery.
3) In the development stage of bottom water flooding in the bottom water reservoir, the water cut increased rapidly, the bottom water coning phenomenon was obvious, the recovery degree of the reservoir was low at 20%, and the residual oil was mainly distributed between the oil wells and the upper part of the oil layer near the wellbore.
4) During nitrogen foam flooding, the foam could enter the water layer to form an effective plug so that the subsequent foam diverted into the oil layer, and the oil displaced laterally to the production well for production. When the foam entered the oil layer, it defoamed and floated to form a secondary gas cap; this phenomenon displaced the residual oil at the top, effectively improving the displacement efficiency and swept volume of the injected fluid.
Data availability statement
The original contributions presented in the study are included in the article/Supplementary Material, further inquiries can be directed to the corresponding author.
Author contributions
YW: Conceptualization, methodology, data curation. YZ: Validation, formal analysis, writing—original draft. JW: Validation, data curation. YM: investigation, formal analysis. ZS: Project administration, methodology. XZ: visualization, supervision. AC: Conceptualization, writing—review and editing. All authors have read and agreed to the published version of the manuscript.
Funding
This research was supported by the National Science and Technology Major Project of the Ministry of Science and Technology of China (No. 2016ZX05056006).
Conflict of interest
XZ was employed by South China Sea East Petroleum Research Institute CNOOC (China) Co. LTD.
The remaining authors declare that the research was conducted in the absence of any commercial or financial relationships that could be construed as a potential conflict of interest.
Publisher’s note
All claims expressed in this article are solely those of the authors and do not necessarily represent those of their affiliated organizations, or those of the publisher, the editors and the reviewers. Any product that may be evaluated in this article, or claim that may be made by its manufacturer, is not guaranteed or endorsed by the publisher.
References
Alyousef, Z., Ayirala, S., Gizzatov, A., and mKokala, S. (2020). Evaluating foam stability using tailored water chemistry for gas mobility control applications. J. Pet. Sci. Eng. 195, 107532. doi:10.1016/j.petrol.2020.107532
Autxu, A., Mu, L., Bo, B., Shan, F., and Li, X. (2017). “Development and application of a modified superheated steam flooding assisted by N2foam and high-temperature resistant gel,” in Abu Dhabi International Petroleum Exhibition and Conference, Abu Dhabi, UAE, 31 October – 3 November.
Cao, L., Sun, J., Liu, J., and Liu, J. (2022). Experiment and application of wax deposition in dabei deep condensate gas wells with high pressure. Energies 15, 6200. doi:10.3390/en15176200
Cao, L., Sun, J., Zhang, B., Lu, N., and Xu, Y. (2022). Sensitivity analysis of the temperature profile changing law in the production string of a high-pressure high-temperature gas well considering the coupling relation among the gas flow friction, gas properties, temperature, and pressure. Front. Phys. 10, 1050229. doi:10.3389/fphy.2022.1050229
Chen, L., Huang, M., Li, Z., Liu, D., and Li, B. (2020). Experimental study on the characteristics of foam flow in fractures. J. Petroleum Sci. Eng. 185, 106663. doi:10.1016/j.petrol.2019.106663
Craig, J. F. F., and Lummus, J. L. (1965). Oil recovery by foam drive. U.S. Patent and Trademark Office.
Hematpur, H., Mahmood, S. M., Nasr, N. H., and Elraies, K. A. (2018). Foam flow in porous media: Concepts, models and challenges. J. Nat. Gas. Sci. Eng. 53, 163–180. doi:10.1016/j.jngse.2018.02.017
Holm, L. W. (1970). Foam injection test in the siggins field, Illinois. J. Pet. Technol. 22, 1499–1506. doi:10.2118/2750-pa
Li, S., Wang, Z., Han, R., Wang, L., and Hu, Z. (2020). Experimental study on the cyclic steam stimulation assisted by flue gas under shallow heavy-oil reservoir conditions: Optimization of the steam-flue gas ratio. Front. Energy Res. 8, 599370. doi:10.3389/fenrg.2020.599370
Liu, Y., Zhang, L., Ren, S., Ren, B., Wang, S., and Xu, G. (2016). “Injection of nitrogen foam for improved oil recovery in viscous oil reservoirs offshore bohai bay China,” in Proceedings of the SPE Improved Oil Recovery Conference, Tulsa, Oklahoma, USA, 11-13 April 2016.
Liu, Y., Zou, J., Meng, X., Han, X., Sun, Y., Zhang, W., et al. (2015). “Treatment technology of steam breakthrough for offshore heavy oil reservoirs developed by huff and puff with multi-component thermal fluid,” in Proceedings of the SPE Asia Pacific Enhanced Oil Recovery Conference, Kuala Lumpur, Malaysia, 11-13 August 2015.
Liu, Z., and Min, J. (1996). Application of foam flooding in Shengli Oilfield. Pet. Geol. Recovery Effic. 03, 23–29.
Lotfollahi, M., Kim, I., Beygi, M. R., Worthen, A. J., Huh, C., and Johnston, K. P. (2016). “Experimental studies and modeling of foam hysteresis in porous media,” in Paper presented at the SPE Improved Oil Recovery Conference, Tulsa, Oklahoma, USA, 11-13 April 2016, SPE179664.
Qu, M., Hou, J., Qi, P., Zhao, F., Ma, S., Churchwell, L., et al. (2018). Experimental Study of fluid behaviors from water and nitrogen floods on a 3-D visual fractured-vuggy model. J. Pet. Sci. Eng. 166, 871–879. doi:10.1016/j.petrol.2018.03.007
Sanders, A., Nguyen, M. N., Ren, G., Westemoreland, D., Nguyen, Q., Dong, S., et al. (2017). “Development of novel foaming agents for high temperature steam applications,” in Paper presented at the Abu Dhabi International Petroleum Exhibition and Conference, Abu Dhabi, UAE, 13-16 November 2017, SPE188682.
Shah, S. Y., Syukri, A. H., Wolf, K-H., Pilus, R. M., and Rossen, W. R. (2020). Foam generation in flow across a sharp permeability transition: Effect of velocity and fractional flow. SPE J. 25, 451–464. doi:10.2118/195517-pa
Wang, F., Du, D., Chen, H., and Zhang, C. (2019). Simulation of evolution mechanism of dynamic interface of aqueous foam in narrow space base on level set method. Colloid Surf. A 574, 1–11. doi:10.1016/j.colsurfa.2019.04.004
Wang, H., and Liu, Y. (2020). Horizontal well completion with multiple artificial bottom holes improves production performance in bottom water reservoir. Math. Prob Eng. 2020, 1–11. doi:10.1155/2020/7247480
Wang, W., Tan, J., Mu, S., Li, B., and Zhang, W. (2019). Study on flow unit of heavy oil bottom water reservoir with over-limited thickness in offshore Oilfield. Open J. Geol. 9, 507–515. doi:10.4236/ojg.2019.99033
Wang, Z., Li, S., Jin, Z., Li, Z., Liu, Q., and Zhang, K. (2023). Oil and gas pathway to net-zero: Review and outlook. Energy Strategy Rev. 45, 101048. doi:10.1016/j.esr.2022.101048
Wang, Z., Li, S., and Li, Z. (2022). A novel strategy to reduce carbon emissions of heavy oil thermal recovery: Condensation heat transfer performance of flue gas-assisted steam flooding. Appl. Therm. Eng. 205, 118076. doi:10.1016/j.applthermaleng.2022.118076
Wei, P., Pu, W., Sun, L., and Wang, B. (2017). Research on nitrogen foam for enhancing oil recovery in harsh reservoirs. J. Pet. Sci. Eng. 157, 27–38. doi:10.1016/j.petrol.2017.07.010
Wen, Y., Qu, M., Hou, J., Liang, T., Raj, I., Ma, S., et al. (2019). Experimental study on nitrogen drive and foam assisted nitrogen drive in varying-aperture fractures of carbonate reservoir. J. Pet. Sci. Eng. 180, 994–1005. doi:10.1016/j.petrol.2019.06.028
Xiang, X., Chen, J., Hou, J., Qiao, Q., Yang, Z., and Liu, H. (2017). Application of nitrogen foam flooding in heavy oil reservoirs in Karamay Oilfield. Xinjiang Pet. Geol. 38, 76–80.
Xiao, Z., Yang, S., Ma, X., Han, J., and Wang, M. (2020). Adaptability evaluation of nitrogen foam flooding after water-flooding in low-permeability light oil reservoirs. Xinjiang Pet. Geol. 41, 729–734.
Xu, X., Saeedi, A., and Liu, K. (2017). Experimental study on a novel foaming formula for CO2foam flooding. Energy Resour. Technol. 139, 022902. doi:10.1115/1.4034069
Zhang, C., Wang, P., and Song, G. (2019). Study on enhanced oil recovery by multi-component foam flooding. J. Pet. Sci. Eng. 177, 181–187. doi:10.1016/j.petrol.2019.02.043
Zhang, Y., Li, B., Lu, T., Li, Z., Zeng, X., and Song, Y. (2023). Adaptation study on nitrogen foam flooding in thick reservoirs with high water cut and high permeability. Colloid Surf. A 657, 130539. doi:10.1016/j.colsurfa.2022.130539
Zhao, F., Qu, M., Wu, J., Hou, J., and Wang, Y. (2017). Influencing factors of the effect of nitrogen gas drive in fractured-vuggy carbonate reservoir. Pet. Geol. recov. Effic. 24, 69–74. doi:10.13673/j.cnki.cn37-1359/te.2017.01.010
Keywords: bottom water reservoirs, nitrogen foam flooding, fluid migration, secondary gas cap, improved oil recovery
Citation: Wu Y, Zhang Y, Wang J, Ma Y, Song Z, Zeng X and Cao A (2023) Study on the mechanism of improved oil recovery by nitrogen foam flooding in bottom water reservoirs. Front. Energy Res. 11:1120635. doi: 10.3389/fenrg.2023.1120635
Received: 10 December 2022; Accepted: 08 February 2023;
Published: 01 March 2023.
Edited by:
Jinlong Liu, Zhejiang University, ChinaReviewed by:
Huachao Yang, Zhejiang University, ChinaYu Zhang, Zhejiang University City College, China
Junqing Zhu, ExxonMobil Research and Engineering, United States
Copyright © 2023 Wu, Zhang, Wang, Ma, Song, Zeng and Cao. This is an open-access article distributed under the terms of the Creative Commons Attribution License (CC BY). The use, distribution or reproduction in other forums is permitted, provided the original author(s) and the copyright owner(s) are credited and that the original publication in this journal is cited, in accordance with accepted academic practice. No use, distribution or reproduction is permitted which does not comply with these terms.
*Correspondence: Aiqng Cao, Y2FxMDAwMEAxNjMuY29t
†These authors have contributed equally to this work and share first authorship