 Tian Xia
 Cencen Liu
- Marketing Service Center of State Grid Hubei Electric Power Co., Ltd., Wuhan, China
Smart meters generally suffer degradation of metering accuracy and performance due to aging, faults, and other factors, which, however, are difficult to detect. This study proposes a measurement error estimation method for distributed smart meters based on a modified BP neural network. First, the relationship model between the metering correction coefficient, network loss, and energy consumption measurement value for the distributed system is established. Then, a modified BP neural network for the parameter estimation method is proposed, in which the internal activation function, iterative step size, and other parameters are comprehensively designed. Finally, the parameters of the distributed smart meter measurement error are solved through training and learning. The case study verifies the effectiveness of the proposed method, and this study lays a theoretical foundation for accurate prediction of the measurement error for distributed smart meters.
1 Introduction
With the popularization of power networks and the full coverage of smart meters, energy metering engineering has become the focus of increasing attention of the operation department of power companies. Among them, the measurement error of the metering device is directly related to the accuracy of the electric energy measurement and is also the basis for the economic accounting of the power company (Wang et al., 2019a). Monitoring and evaluating the measurement error of electric energy metering by metering devices has become an imperative method for the economic interest and fairness of transactions for both power supply companies and users, and it is also an effective means to manage and predict the use of electric energy (Steiner et al., 2018).
Generally, the measurement errors of electric energy metering devices are mainly caused by electric energy meters, transformers, and secondary wiring. Many related works have been presented, including error source detection, error modeling, and error evaluation. Among them, the measurement error model, which describes the differences between the actual value and the estimated value, can be obtained in the calibration study for smart meters (Dong et al., 2018); the corresponding measurement error is commonly detected by the test system based on a pseudorandom distortion test signal and indirect likelihood function (Wang et al., 2019b), which could also be confirmed by testing devices or platforms (Donahue et al., 2014). In addition, the current remote error estimation has also become a state-of-the-art field, in which remote calibration and monitoring systems including some monitoring equipment, communication networks, and the master station should be installed (Gao et al., 2019;Zhang et al., 2018). However, solving the measurement error requires the installation of a large number of standard terminal devices, increasing investment, and operation and maintenance costs (Luan et al., 2015).
Recently, the application of deep learning and mathematical model construction methods to realize the remote analysis of smart meter measurement error has become a state-of-the-art field. A mathematical model of smart electrical meter errors in the smart grid was proposed by Kong et al. (2020, 2021), which was built by using the dimension reduction estimation model and damped recursive least squares, and then the clustering and Kalman prediction methods were presented to estimate smart meter errors. An artificial neural network for power loss estimation was proposed by Kashef et al. (2018a) to estimate line loss; the advantage is that it has real-time estimation and high precision for fast calculation of power loss of each line in the distribution system. A remote estimation method based on the neural network filter and generalized damping recursive least squares was proposed by Kashef et al. (2018b), which can estimate both users’ smart meters’ errors and the loss accurately. Most of the mentioned methods integrated the analytical formulas of network loss into the estimation models to mitigate the impact of network loss changes (Sun et al., 2016;Liu et al., 2015), which, however, are generally limited by the complexity, calculation accuracy, and applicability of the network loss analytical formulas (Alonso et al., 2020;Xia et al., 2019).
To overcome the above drawbacks, artificial intelligence methods, especially neural networks, have been applied to avoid cumbersome analytical formulas and improve applicability. The back-propagation (BP) neural network algorithm was used to achieve distributed computing of network losses, and finally, obtain a root mean square error that is lower than 5% by Chao et al. (2018). A novel real-time power loss estimation method was proposed by Kashef et al. (2018b) for the distribution system, in which a neural network power loss estimation method was applied. Although neural network-related methods generally need sample training to obtain good performance in estimating network losses (Hao et al., 2020;Ruan et al., 2019), it induces frequent and drastically changing network losses simultaneously (Kashef et al., 2018b), which results in neural networks becoming unstable for remote error estimation (Zhou et al., 2021).
Motivated by the above analysis, this study proposes a novel remote measurement error estimation method for distributed smart meters through a modified BP neural network. The main contributions lie in the following: 1) a measurement error model considering network loss is established, and the k-means clustering method is introduced to simplify the model in estimating the correction parameter; 2) a traditional BP network model is modified to fit the established model, where the intrinsic activation function and iterative rules are optimized to ensure the utilization of new data, estimator change range reduction, and good robustness against the network loss; and 3) a simulated distributed smart electricity meter system is built for analyzing the distributed smart meter data, the feasibility, and effectiveness of which are verified through tests. Finally, the proposed method provides a basis for efficiently detecting smart electricity meters with large measurement errors.
The rest of the article is organized as follows: Section 2 introduces the distributed smart meter error model, which builds the relationship among the master meters’ reading value, network loss, and sub-meters’ reading value. Then, an overview of the measurement error estimation method based on a modified BP neural network is described in Section 3. In Section 4, experiments are carried out, as well as the verification experiment of the measurement error estimation. The conclusions are drawn in Section 5.
2 Distributed Smart Meter Error Model
In the distribution energy consumption measurement system, the classic topology for the distribution feeder unit is shown in Figure 1. According to the conservation of energy, there is an electric energy relationship between the smart electricity meters of the terminal and the master meter in the distributed topology during the tth measurement period, that is,
where
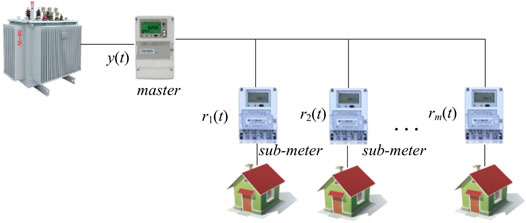
FIGURE 1. The distribution of smart meters in the electric grid.
Based on the error model analysis in Eq. 1, each terminal smart meter (sub-meter) measurement may be biased due to the degradation or lack of proper maintenance, thus leading to the measurement results of the master smart meter being biased from the actual value. For description convenience, the reading value of the smart meters and the master smart meter is applied into Eq. 1. Thus, Eq. 1 can be written as follows:
where Y(t)t×1 is the matrix represented by Y(t)t×1 = [y(1) y(2)…y(t)]T, R′(t)t×(m+t) is the matrix written as R′(t)t×(m+t) = [R(t)t×m It×t] with R(t)t×m = [r(1)1×m r(2)1×m…r(t)1×m ]T, where r(i)1×m = [r1(i) r2(i) …rm (i)], i = 1,…, t, and It×t is the identity matrix. Let
From the description of linear equations in Eq. 2, the final matrix X(t) can be solved by the least-squares method, that is,
Generally speaking, the actual model of smart meter errors can be considered as a set of linear equations consisting of t equations. However, X is a matrix of unknowns to be solved since it contains m + t unknown variables. In this situation, if the number of unknown variables is more than those of equations, then the matrix inverse may not be solvable, where R′(t) may contain an indefinite value. To this end, a modified BP neural network is proposed to solve the model parameters for estimating the measurement error of smart electricity meters.
3 Parameter Estimation for the Model
To estimate the parameters in the distributed energy consumption measurement system, the following strategies are carried out. First, the k-means clustering method is adopted for classifying the data from the master smart meter to simplify the model considering the same network loss in the same class. Then, a traditional BP neural network is modified in terms of an activation function and iterative length to fast fit the model for the distributed measurement system.
3.1 k-Means Clustering Model
The k-means clustering algorithm is a classic clustering method based on Euclidean distance. Since the number of centers k is given, the data will be classified into the center under the criterion that its distance to the center is minimized. Through the cluster centers being updated iteratively, the classes will finally be generated. Generally, the mathematic model is to minimize the within-class variance as follows:
where x is the data belonging to the class Ci; k is the number of cluster centers; and mi is the center of the class Ci containing Ni data, which is obtained by
Based on the rule of the k-means clustering, the number of classes will be obtained once the number of smart meters is set. In each class, network loss can be considered as a constant, that is,
where y(t)c is the data belonging to cluster C and Δwc is the constant network loss. If the number of data is larger than the number of smart meters, the correction coefficient ξi can be obtained by Eq. 6, and Δw(t) can be then calculated by Eq. 1. Notably, the value of network loss is often positive. So, it is necessary to place the constraint condition to solve the value of Δw(t) in cluster C. Here, Δwc is obtained by the minimum error in Eq. 7, that is,
where Δwc>0 and
Notably, the network loss listed in Eq. 1 is mainly generated by the branch of smart meters. To alleviate the network loss while fitting the model, the number of classes can be set by using the number of meters.
Additionally, Δwc calculated by Eq. 6 simplifies the model in Eq. 1. However, the network loss still affects the result of the correction coefficient calculated by the least-squares method. Thus, in this article, a modified BP neural network is proposed to achieve the optimal value of the correction coefficient ξi.
3.2 BP Neural Network
The BP neural network is regarded as a widely used neural network and has wide applications. The main idea of the BP neural network is to adopt a gradient descent to search for the hypothesis space of possible weight vectors. Thus, the BP neural network is generally taken as a gradient descent method to adjust the weights of each layer of the neural network to minimize the total error. On the one hand, the minimum mean square error of reality and expectation can be achieved through neural network iteration. On the other hand, the BP neural network algorithm takes a forward feedback learning process, which, in essence, is a process where errors propagate backward and the weight coefficients of each layer are connected as well. Since the feedback learning runs through the adjustment of the connection mode, weight and threshold of each neuron, and the identification of the whole network, the corresponding neural network structure can be given as in Figure 2. Usually, the neural network has three layers, that is, input layer, the hidden layer, and output layer. The data stream often contains two aspects. One aspect is the data forward feedback, that is, the input data xi is transmitted to the output layer via the hidden layer. In this process, the neuronal state of each layer only affects the neuronal state of the next layer, and the state is determined by the weight and bias terms as well as the activation function. The other aspect is the back-propagation error, that is, network weights and thresholds are adjusted according to the prediction error, such that the BP neural network prediction output can constantly approach the desired output.
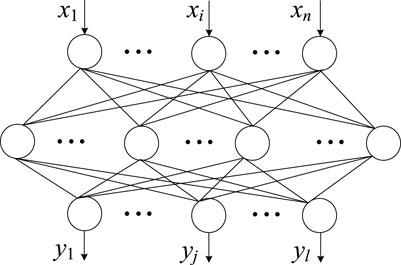
FIGURE 2. BP neural network structure diagram.
To be specific, let x be the input data, ω and b1 be the parameters from input layers to the hidden layers, and v and b2 be the parameters from hidden layers to the output layers. Each neural layer is connected by the activation function, which is designed as follows:
(1) The activation function S1 from the input layer to the hidden layer
(2) The activation function S2 from the hidden layer to the output layer
According to Eqs 8, 9, the predicted value of the neural network can be written as
To measure the approximation between the predicted value and the actual value, the expected value of the loss function adopted by the BP neural network is obtained as
where θ is the parameter of the inner model. By the derivative of the loss function in Eq. 11 for v and b2, respectively, the error terms of the output unit can be calculated as follows:
where k is the iteration number and
During back-propagation, the learning rate parameter η is used to update the weights and bias terms of the BP neural network. Then, it can be written as
Alternatively, the parameter can then be updated in hidden layers as follows:
With the neural network iterations described above, the parameters of the weights and biases in the neural network are optimal since the loss function is satisfied with the condition that the error is less than the given threshold or the number of iterations exceeds the setting value. Then, the neural network can work well in terms of classification, prediction, and so on.
3.3 A Modified BP Neural Network for Parameter Estimation
In the BP neural network, the activation function is the core part that enables the neural network to achieve good performance. Traditional activation functions, such as the sigmoid function, generally aim at nonlinear data mapping. The established mathematical model contains linear equations as previously discussed, as seen in Eq. 3. The traditional activation functions of the BP neural network may not be suitable to solve the parameters of the model. Thus, the BP neural network is optimized and improved here, the framework of which is shown in Figure 3. The details are given as follows.
(1) Parameter for the BP neural network
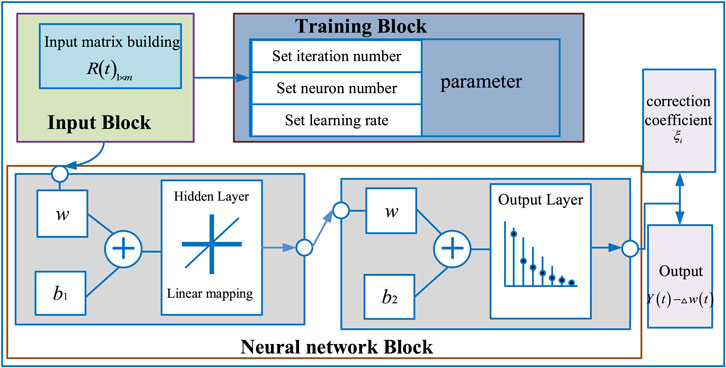
FIGURE 3. The framework of our model.
To facilitate the corresponding modified BP neural network, the input x in the neural network model and neuron weight ω can be expressed as
where k is the number of hidden-layer neurons and m is the number of input.
(2) Structure for BP neural network
The BP neural network with one hidden layer in an engineering application usually has better approximation performance, and the number of neurons in the hidden layer plays a role in fitting the output value. Here, the empirical formula is adopted (Erik et al., 2018), which is expressed as
where n is the number of neurons in the input layer, k is the number of neurons in the output layer, a is a constant selected from the range [1, 10], and ceil (.) is the top integral function.
(3) Activation function for BP neural network
In this article, Eq. 1 belongs to the multivariate linear model. Thus, the activation functions S1 and S2 are set as the linear model:
The output can be then written as
Thus, the correction coefficient ξi can be finally determined by ω and v.
(4) Iterative step length for the BP neural network
Consider the fact that ξi is related to the weights that do not change frequently with time in the mathematical model. Thus, let the correction coefficients ξi of smart meters be unchanged over time. The updating procedure of parameters can be simplified as
where sign is a symbolic function and expressed as
4 Test Results and Discussion
To verify the effectiveness of the proposed method, experiments were carried out in a laboratory. In this case, seven smart meters were installed. One of them was taken as a master meter and the others as sub-meters. In the sub-meters, sub-meter 2 was set with a 15% measurement error for the test, and the remaining measurement accuracy was 0.5 s level. The whole experimental test period was 2 days, and energy consumption data were recorded every 15 min. A total of 192 measuring points were recorded, as shown in Figure 4 and Figure 5. In the test, k was set as 6 in the k-means clustering; the weight ω of the modified BP neural network was initialized as the full 1m × k matrix, and other parameters are shown in Table 1. Experiments were performed by using MATLAB 2021A on a computer with Intel(R) Core(TM) 2 Duo 2.1 GHz i7 CPU 16G RAM, and Windows 64bit operation system.
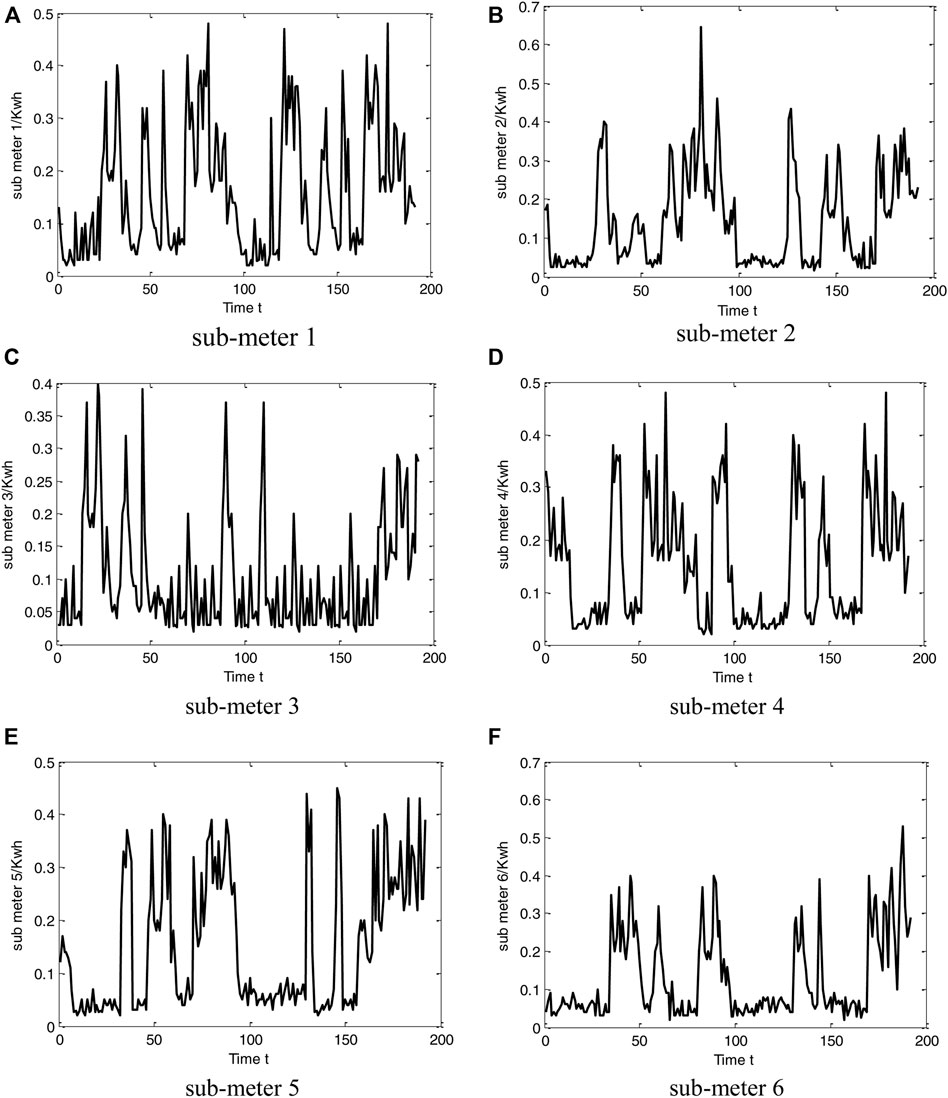
FIGURE 4. The data from six smart electricity meters: (A) sub-meter 1, (B) sub-meter 2, (C) sub-meter 3, (D) sub-meter 4, (E) sub-meter 5, and (F) sub-meter 6.
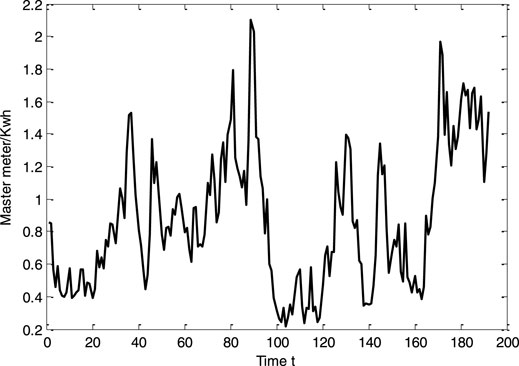
FIGURE 5. The data from the master meter.
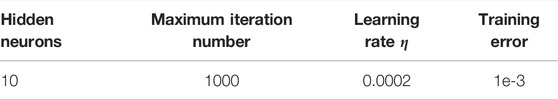
TABLE 1. The parameter setting of the BP neural network.
Table 2 illustrates the class centers computed by k-means clustering. It can be seen that the network loss in each class is very small. This phenomenon occurred because it only had small loads such as lighting among the master meter and the sub-meters, and the master meter was not far away from the sub-meters in the test environment.
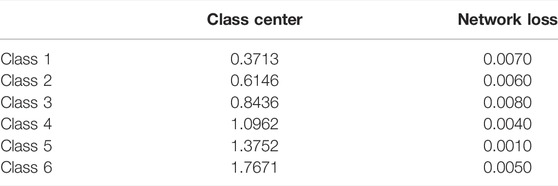
TABLE 2. The class center and network loss.
Figure 6 illustrates the error during the proposed modified BP neural network training. It can be seen that the error decreases as the number of iterations increases. After 50 iterations, the error tends to be 0.05, and the final predicted value of the proposed BP model is basically close to the actual value, as shown in Figure 7. Thus, it will fit the mathematical model in Eq. 1. The parameter of the proposed BP neural network is listed in Table 3.
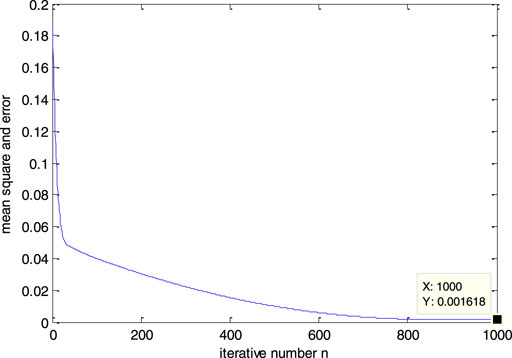
FIGURE 6. | The modified BP neural network training error during iteration.
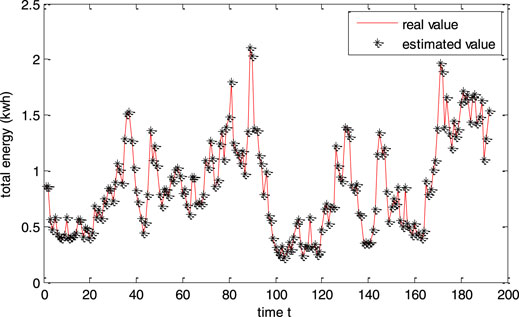
FIGURE 7. The data from the master meter and the predicted value by the proposed method.
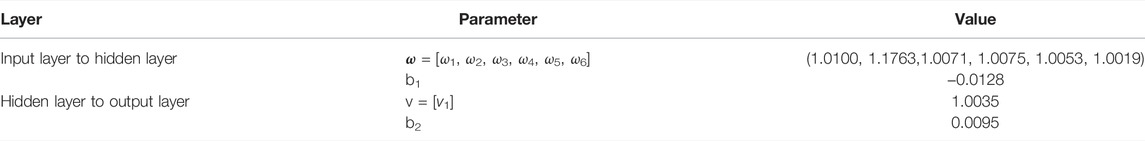
TABLE 3. The parameter results from the proposed modified BP neural network.
Since the BP neural network is modified as linear mapping as in Eq. 20, the proportional coefficient ξi can be obtained from ω and v, where ξi = vTωiT. Thus, the measurement accuracy of each sub-meter can be then solved by 1/ξi, i = 1, 2,…, 6, as shown in Table 4. It can be seen that the value of 1/ξ2 is 0.8532. Thus, the measurement error is 0.1468, which is close to the 15% measurement error in sub-meter 2. This demonstrates that our model can effectively detect the measurement error.

TABLE 4. Measurement error estimation.
Alternatively, to demonstrate the performance of the proposed method in estimating the measurement error, a comparison with the least-squares method was carried out. The results are shown in Table 5. It can be seen that the result value 1/ξ2 from the least-squares method is 0.8606. Thus, the measurement error is 0.1394, which is a larger offset than the 15% measurement error. Generally, the least-squares method only pursues the minimum error of least-squares equations, regardless of the network loss. Nevertheless, our method uses the k-means clustering method to classify the data, which can eliminate the influence of the unknown network loss during the calculation of the correction coefficient ξi. To demonstrate this point, the result of the modified BP neural network without the k-means clustering method is listed, as seen in Table 5. It can further demonstrate the desired performance of the proposed method in detecting the measurement error.
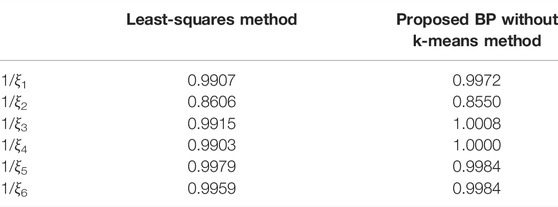
TABLE 5. Comparison results.
Table 6 illustrates the running time of the above methods. It can be seen that the proposed method costs more CPU time than that of the least-squares method. Nevertheless, to obtain a better parameter, the proposed model utilizes k-means clustering and a modified BP neural network. Generally, it has the same level of running time. However, the original strategy for parameter updating takes a bit more time than the proposed method. This demonstrates the usefulness of the modified strategy.
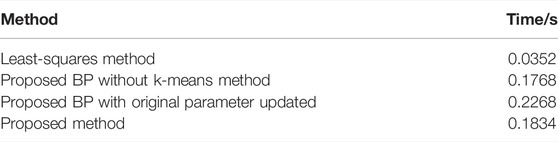
TABLE 6. Running time.
5 Conclusion
In this article, a remote error estimation method is proposed which is based on a modified BP neural network. The method takes the distributed smart electricity meter as the research object and builds the mathematical model inherent in the correction coefficient that is hidden by the energy from the smart meter and the master meter in the system. A classic k-means clustering is applied to classify the data, allowing the model to be simplified during the calculation of parameters. The BP neural network is then optimized to solve the parameter by modifying the activation function and the update rule of the neural network parameter. The experiments show that the desired performance can be obtained by our model. In the near future, the proposed method will be applied to the actual application, and the remote experiment platform will be set up as well.
Data Availability Statement
The raw data supporting the conclusion of this article will be made available by the authors, without undue reservation.
Author Contributions
TX provided the idea of work, SX implemented the idea by MATLAB, DL organized the framework of this manuscript, DM set up the experiment platform, ML collected the experiment data, and CL conducted the calculation and proof.
Funding
This work is supported by Science and technology project of State Grid Hubei Electric Power Co., Ltd (52154320000P).
Conflict of Interest
Authors TX, SX, DL, DM, ML, and CL are employed by the Marketing Service Center of State Grid Hubei Electric Power Co., Ltd.
Publisher’s Note
All claims expressed in this article are solely those of the authors and do not necessarily represent those of their affiliated organizations, or those of the publisher, the editors, and the reviewers. Any product that may be evaluated in this article, or claim that may be made by its manufacturer, is not guaranteed or endorsed by the publisher.
References
Alonso, A. M., Nogales, F. J., and Ruiz, C. (2020). “Hierarchical Clustering for Smart Meter Electricity Loads Based on Quantile Autocovariances,” IEEE Trans. Smart Grid, 11(5). 4522–4530. doi:10.1109/tsg.2020.2991316
Chao, S., Zhensheng, L., Jinlei, H., Zhenxing, K., and Zheng, W. (2018). “Line Loss Calculation in Power Distribution Network Based on Power Measurement Data and BP Neural Network,” in International Conference on Power System Technology, Guangzhou, China, 6-8 Nov. 2018, 4107–4112. doi:10.1109/powercon.2018.8601813
Donahue, S. T., Storm, C. L., Wetz, D. A., and Lee, W.-J. (2014). Study of the Effects of Smart Meter RF Transmissions on GFCI Outlets. IEEE Trans. Electromagn. Compat. 56 (6), 1361–1369. doi:10.1109/temc.2014.2354016
Dong, X., Li, Z., Dai, Y., Wang, Q., Zhang, Z., Wang, P., et al. (2018). “Research on Error Verification of Harmonic Smart Electricity Meter”, in 3rd International Conference on Mechanical, Control and Computer Engineering(ICMCCE), Huhhot,China, 2018 sep14-16. 286–290. doi:10.1109/icmcce.2018.00065
Erik, C., Luis, E., and Deniel, Z. (2018). A Selection Method for Evolutionary Algorithms Based on the Golden Section. Expert Syst. Appl. 106, 183–196. doi:10.1016/j.eswa.2018.03.064
Gao, Y., Foggo, B., and Yu, N. (2019). A Physically Inspired Data-Driven Model for Electricity Theft Detection with Smart Meter Data. IEEE Trans. Ind. Inf. 15 (9), 5076–5088. doi:10.1109/tii.2019.2898171
Hao, X., Song, J., Pei, T., Zhang, C., Li, Y., and Zhou, Z. (2020). Application of FCM and Neural Network in Power Load Data Correction. Transducer Microsyst. Technol. 39 (4), 152–155. doi:10.13873/J.1000-9787(2020)04-0152-04
Kashef, H., Mahmoud, K., and Abdel-Nasser, M. (2018). “Power Loss Estimation in Smart Grids Using a Neural Network Model,” in International Conference on Innovative Trends in Computer Engineering, Aswan, Egypt, 19-21 Feb. 2018, 258–263. doi:10.1109/itce.2018.8316635
Kashef, H., Mahmoud, K., and Abdel-Nasser, M. (2018). Power Loss Estimation in Smart Grids Using a Neural Network Model. Proc. Int. Conf. Innov.Trends Comput.Eng. 1. 258–263. doi:10.1109/itce.2018.8316635
Kong, X., Zhang, X., Li, G., Dong, D., and Li, Y. (2020). An Estimation Method of Smart Meter Errors Based on DREM and DRLS. Energy 204, 117774. doi:10.1016/j.energy.2020.117774
Kong, X., Zhang, X., Lu, N., Ma, Y., and Li, Y. (2021). Online Smart Meter Measurement Error Estimation Based on EKF and LMRLS Method. IEEE Trans. Smart Grid 12 (5), 4269–4279. doi:10.1109/tsg.2021.3077693
Liu, X., Zhu, P., Zhang, Y., and Chen, K. (2015). A Collaborative Intrusion Detection Mechanism against False Data Injection Attack in Advanced Metering Infrastructure. IEEE Trans. Smart Grid 6 (5), 2435–2443. doi:10.1109/tsg.2015.2418280
Luan, W., Peng, J., Maras, M., Lo, J., and Harapnuk, B. (2015). Smart Meter Data Analytics for Distribution Network Connectivity Verification. IEEE Trans. Smart Grid 6 (4), 1964–1971. doi:10.1109/tsg.2015.2421304
Ruan, J., Jiang, H., Li, X., Shi, Y., Chan, F. T. S., and Rao, W. (2019). A Granular GA-SVM Predictor for Big Data in Agricultural Cyber-Physical Systems. IEEE Trans. Ind. Inf. 15 (12), 6510–6521. doi:10.1109/tii.2019.2914158
Steiner, R., Farrell, M., Edwards, S., Ford, J., and Nelson, T. (2018). “ANIST Testbed for Examining the Accuracy of Smart Meters Under High Harmonic Waveform Loads,” in Conference on Precision Electromagnetic Measurements, Prance,France, 8-13 July2018, 1–2. doi:10.1109/cpem.2018.8501026
Sun, Q., Li, H., Ma, Z., Wang, C., Campillo, J., Zhang, Q., et al. (2016). A Comprehensive Review of Smart Energy Meters in Intelligent Energy Networks. IEEE Internet Things J. 3 (4), 464–479. doi:10.1109/jiot.2015.2512325
Wang, Y., Chen, Q., Hong, T., and Kang, C. (2019). Review of Smart Meter Data Analytics: Applications, Methodologies, and Challenges. IEEE Trans. Smart Grid 10 (3), 3125–3148. doi:10.1109/tsg.2018.2818167
Wang, X., Wang, J., Yuan, R., and Jiang, Z. (2019). Dynamic Error Testing Method of Electricity Meters by a Pseudo Random Distorted Test Signal. Appl. Energy 249, 67–78. doi:10.1016/j.apenergy.2019.04.054
Xia, X., Xiao, Y., and Liang, W. (2019). ABSI: An Adaptive Binary Splitting Algorithm for Malicious Meter Inspection in Smart Grid. IEEE Trans.Inform.Forensic Secur. 14 (2), 445–458. doi:10.1109/tifs.2018.2854703
Zhang, Z., Gong, H., Li, C., Wang, Z., and Xiang, X. (2018). Research on Estimating Method for the Smart Electric Energy Meter's Error Based on Parameter Degradation Model. IOP Conf. Ser. Mat. Sci. Eng. 366, 012065. doi:10.1088/1757-899x/366/1/012065
Keywords: modified BP neural network, smart meters, measurement error, activation function*, linear model
Citation: Xia T, Liu C, Lei M, Xia S, Li D and Ming D (2022) Measurement Error Estimation for Distributed Smart Meters Through a Modified BP Neural Network. Front. Energy Res. 10:928681. doi: 10.3389/fenrg.2022.928681
Received: 26 April 2022; Accepted: 09 May 2022;
Published: 05 July 2022.
Edited by:
Yushuai Li, University of Oslo, NorwayReviewed by:
Chaoqiang Jiang, City University of Hong Kong, Hong Kong SAR, ChinaHongyu Chu, Southwest University of Science and Technology, China
Xiaogang Lin, Chongqing University, China
Copyright © 2022 Xia, Liu, Lei, Xia, Li and Ming. This is an open-access article distributed under the terms of the Creative Commons Attribution License (CC BY). The use, distribution or reproduction in other forums is permitted, provided the original author(s) and the copyright owner(s) are credited and that the original publication in this journal is cited, in accordance with accepted academic practice. No use, distribution or reproduction is permitted which does not comply with these terms.
*Correspondence: Tian Xia, Y3Jvc3MyMDIxMDkwN0AxNjMuY29t