- 1Shenyang Institute of Engineering, Shenyang, China
- 2Key Laboratory of Regional Multi-energy System Integration and Control of Liaoning Province, Shenyang, China
- 3State Grid Liaoning Electric Power Co., Ltd, Shenyang, China
With the contradiction between energy consumption and ecological protection becoming increasingly prominent, it has become a serious issue to study an energy system with high efficiency, low pollution, and strong controllability. The application of the backpressure unit and the peak-shaving electric boiler makes the power grid and the heat grid connected and becomes an electro-thermal coupling system, which can be studied as a representative of the integrated energy system. In this study, to make full use of energy, a power system model considering a large number of distributed energy injections and a multi-source thermal system model are constructed. After the energy flow is solved, the optimization method of the electrothermal coupled system is studied to minimize the fuel consumption and obtain the minimum operating cost. In addition, a more comprehensive algorithm is proposed in this study, and the actual model is used in the fourth section of the article to verify that the algorithm can be practically applied.
1 Introduction
The development of the integrated energy system (IES) can make the allocation of resources more rational and optimal, which is a good way to deal with the huge energy consumption and resource depletion in the current era, and it is also a foundation for the complete transformation of the country’s energy structure in the future (Moeini-aghtaie et al., 2014). In the traditional energy systems such as power grids and thermal networks, each energy system has an independent operating system, the coupling between them is not tight, and the energy efficiency is low. The coupling between integrated energy systems is tight, the energy utilization rate is high, and the ability to absorb renewable energy is greatly improved (Liu et al., 2016; Sun et al., 2020; Zhang et al., 2022). When the power grid is actually running to calculate the power flow, the forward-backward method and the Newton–Raphson method are mostly used (Hu et al., 2020). These two methods have a strong theoretical system in the power grid, and their ideas are also relatively mature. However, when it is applied to an electro-thermal combined system, the solution program becomes complicated, the number of iterations is large, and it is difficult to realize the combination between the various systems. At present, many scholars at home and abroad have proposed energy flow solving methods for integrated energy systems (Jia et al., 2014; Xia et al., 2017; Yu et al., 2021). Liu et al. (2021) have refined the heat network and considered the method of solving the energy flow in the case of heat loss. Guo et al. (2019) constructed a unified energy flow solution method based on energy hubs. Li et al. (2015) have considered the effect of adding energy storage elements to the whole system.
The modeling of each part of the network and the energy flow solution of the electro-thermal coupled system are the basis of the optimal energy flow research. As the most important part of this study, the control variables are not given as the general energy flow calculation but need to be determined through optimization, thus forming a nonlinear programming problem with multiple constraints, and the solution methods are also diverse to simplify the nonlinear programming method represented by the gradient method, and the interior point method is used more. The research on the optimal power flow has been very extensive. Zhang et al. (2019) considered the construction of the heat network model more comprehensively and built a refined energy flow solution model on the basis of the heating system. Jiang and Liang. (2015) considered the characteristics of poor performance in traditional AC-DC hybrid power flow calculation and uses the Gaussian method for an iterative solution to improve the applicability of the entire system. To realize the optimal allocation of energy and reduce energy consumption, this study constructs a simplified integrated energy system model and uses a unified solution method to achieve a fast and accurate solution, simple solution process, high calculation accuracy, and simple programming and does not require too many iterations (Krause et al., 2011; Malley and Kroposki, 2013; Chen et al., 2020). When a large number of PV nodes are injected into the system, the PV nodes can be equivalent to improve the traditional forward and backward generation method. In addition, the interior point method chosen in this study in the process of solving the optimal energy flow does not need to find the initial value in the feasible region, and it will adapt quickly when the system scale increases (Wang et al., 2019; Wang et al., 2020; Wang et al., 2021a; Wang et al., 2021b). In the fourth section of the study, an optimal energy flow calculation model including a distributed power grid and a multi-heat source radiant heat grid is established, and two examples are used to analyze the characteristics of the two solutions proposed.
2 Research on the Energy Flow Calculation Model and Algorithm of the Combined Electric-Heat System
2.1 Power System Model
The running state of the power system is not constant, and a power flow equation can be listed in each state. If the column is written as the node voltage, it can be expressed as follows:
The node power equation of power flow calculation can be expressed as follows:
where
2.2 Thermal System Model
The thermodynamic system model is composed of a hydraulic model and a thermodynamic model. According to the hydraulic model of the heat network, the amount of water flowing through the pipeline and the injected water flow at the heat load node can be obtained. The following flow continuity equation is used to express as follows:
where
A thermal model can be used to determine the temperature of each node of the thermal network, including the following equations. Eq. 4 is the equation of node injection heat power, mass flow, and node temperature. Eq. 5 is the relationship between the temperature of the head and tail of the pipeline. Eq. 6 is the equation for the outflow of hot water from the heat source through different heat networks and finally mixed at heat loads.
where
There is often more than one heat source in a thermal system. Figure 1A is the schematic diagram of the radiant heat system model with multiple heat sources. In this model, two heat sources are used to heat the heat load at the same time. Then, the two heat sources are transformed into two equivalent heat sources shown in Figure 1B to heat the heat load. Therefore, the multi-heat source radiation type heat network is converted into multiple single heat source radiation-type heat networks. The transformation is as follows:
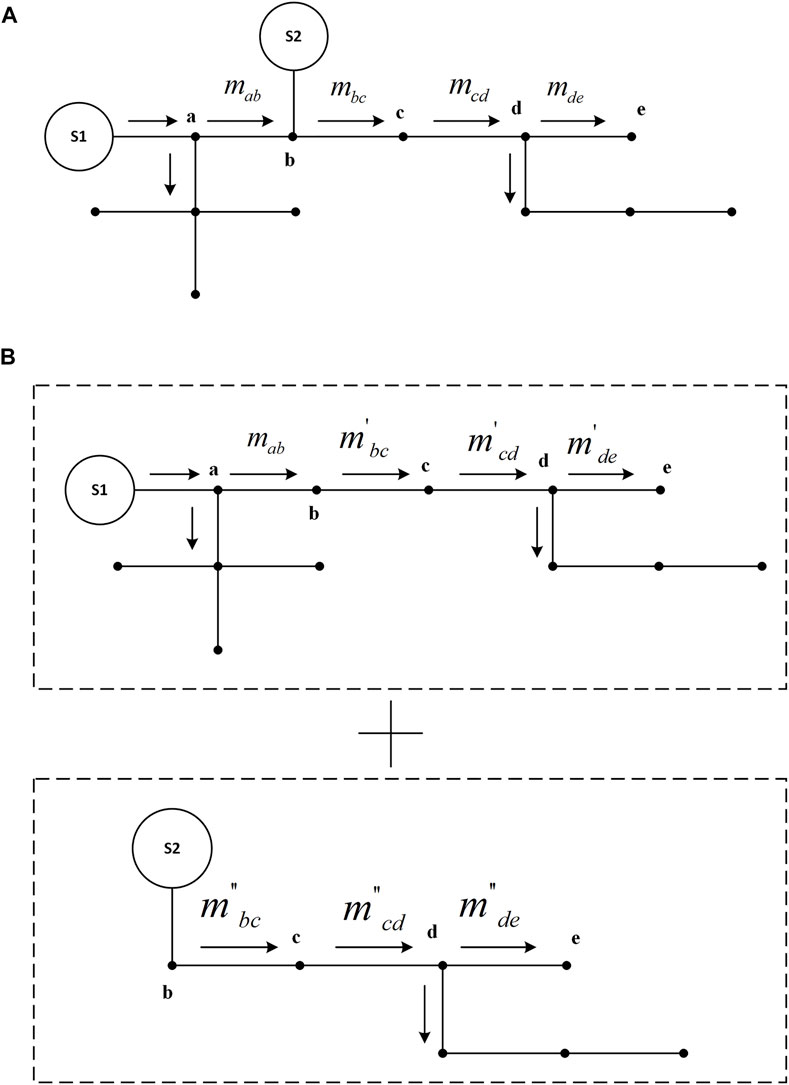
FIGURE 1. (A) Multi-source radiant thermal system model. (B) Single-heat source radiant heat network model.
This is rewritten in the matrix form as
where,
where,
2.3 Thermal-Electro Coupled Model
Coupling elements of power systems and thermal systems such as thermoelectric units and heat pumps have the property of generating heat while supplying power. A backpressure unit is a widely used thermoelectric unit, which does not contain a condenser. The exhaust heat in the back pressure unit will be fully utilized, and the thermal efficiency is high. The disadvantage is that the generating capacity of the backpressure unit should be based on heat production, and the regulation sensitivity is not strong. Therefore, the backpressure unit is generally selected as the heat source to play a central role in the thermal system, and the electric boiler is selected to meet the demand for peak shaving.
The thermal power and electrical power emitted by the backpressure unit satisfy the following equation:
where
The equation of thermal power and electrical power emitted by a peak-shaving electric boiler is as follows:
where
2.4 Calculation Method of the Energy Flow in the Electro-Thermal Coupled System
At present, Newton–Raphson’s energy flow solution method is the most widely used. However, the Newton–Raphson method has the shortcomings of strict requirements on the initial value and more iterations. Therefore, this study proposes an improved forward-backward generation method, which improves the drawbacks that the traditional forward-backward generation method cannot deal with PV nodes, and is extended to the radiant thermal system with multiple heat sources, which reduces the number of iterations and the requirement for initial values. The improvement of the thermal system simplifies the model and improves the calculation speed.
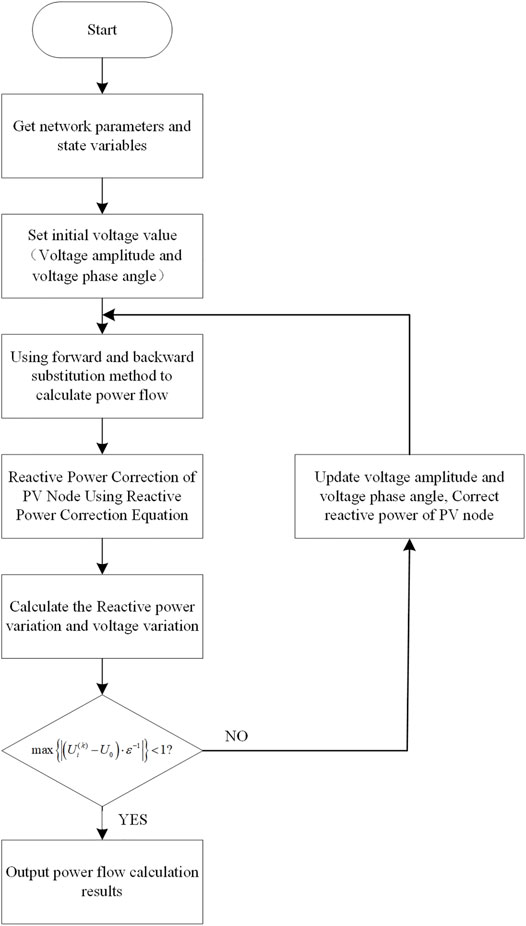
When distributed energy is added to the grid, PV nodes will become more. But the traditional push-back method cannot handle this. Therefore, it can be improved to allow power flow calculations to continue. Figure 2 shows the flow solution diagram of the improved forward-backward substitution method.
The power loss formula is as follows:
where
Next, the voltage drop formula of each line is calculated as follows,
where
For the
where
Since the injection of distributed generation into the distribution network will increase the number of
The correction equation is as follows:
where
The fact that whether the voltage of each node satisfies the convergence condition of the following equation is judged. If not, the voltage value is updated before the power flow calculation, and the equation is corrected until the voltage satisfies the convergence condition.
The convergence condition is as follows:
where
The aforementioned idea can be extended to the thermal system to be equivalent to the power system. The temperature of the heat network is analogous to the voltage of the power grid, the heat flow is analogous to the current, the heat load node is equivalent to the load, the heat source node is equivalent to the power supply, and the node with known heating temperature is an analogy to the balance node in the power system. Then, according to the coupled part modeling mentioned in 2.3, the sum of thermal power of all equilibrium nodes in the thermal system is transformed into the power of electric load to realize the transformation process of the power flow solution.
3 Research on the Optimal Energy Flow Calculation Model and Algorithm of the Electric-Heat Combined System
3.1 Problem Description
One of the main research problems in this study is the construction of the optimal energy flow model for the entire system and the solution method. The purpose of solving the optimal energy flow is to make the entire system run efficiently and to obtain security guarantees at the same time. Adjustment through certain algorithms of the output of each energy unit can achieve the optimal distribution of energy among various systems. When the model is built, the grid is used as the basis. The thermal grid and the grid are connected together through coupling elements at a certain node, and the thermal power of the thermal grid is converted into electrical power and introduced into the grid. To calculate the optimal energy flow, the objective function must be selected first. In this study, the goal is to minimize the operating cost of the entire system. This is a nonlinear programming problem that considers multiple constraints of independent networks and coupled parts. The following assumptions should be made before modeling:
1) The operating conditions of each power source and a heat source are known (if there is a parallel connection between power sources or heat sources, it will not be considered);
2) The output of each power source and heat source are known;
3) The topologies of the heat grid and the grid are known;
4) The node load size is known;
5) The parameters of the overall network are known.
The mathematical model of the optimal energy flow can be expressed as
where
3.2 Objective Function
If the objective function is to minimize the operating cost, the corresponding coal consumption should be minimized. The heat source selected in this study is a backpressure unit, and a peak-shaving electric boiler is used to assist it, so it can be considered that the objective function established in this study is based on heat production and production. Electricity is a quadratic fitting function of the variable, and the objective function is as follows:
where
3.3 Restrictions
The equation constraints of the power grid can be considered as the active and reactive power equations of the power flow calculation, and the balance condition is that the inflow power of each node in the power grid is equal to the sum of the outflow and losses:
where
The power balance constraints of the heating network include the electric power balance of backpressure unit nodes, the thermal power of heat source nodes, the thermal power used by users and the thermal power supplied by electric boilers, and the temperature balance of hot water flowing into pipes.
where
For all backpressure units, the upper and lower power limits of active and reactive power are met:
where
Similarly, all peak-shaving electric boilers also meet the upper and lower power limits of active and reactive power:
where
To meet the stability of power grid operation, it is necessary to restrict the amplitude of the voltage and the phase angle difference of the voltage:
where
If the variables
When the backpressure unit is used as the hub of the power grid and the heating network and when the peak-shaving electric boiler assists in regulation, there is the following power balance equation at the junction of the two networks:
The aforementioned formula is the conversion relationship between thermal power and electric power of the backpressure unit and electric boiler.
3.4 Calculation Method of the Optimal Energy Flow in the Electrothermal Coupling System.
Among many methods for solving optimal energy flow, the nonlinear programming method and interior point method are widely used. Compared with the former, the interior point method has the advantages of fast calculation speed and better convergence. When the system is huge, the calculation amount is not as complex as other methods, and the initial value is not particularly strict. Therefore, the interior point method is selected to solve the optimal energy flow of the whole joint system in this study. The traditional interior point method is always in the feasible region in the iterative process. Therefore, it is often difficult to choose the initial value. However, with the emergence of the central trajectory method, it is not necessary to find the initial value in the feasible region of the established model, and the range has changed greatly than the previous one. It only needs to meet the conditions of relaxation variables and disturbance factors, and the requirements for the initial value are no longer so strict.
At first, the interior point method appeared to calculate the optimal power flow in the power grid. When constructing the objective function, it is not necessary to list the state variables and control variables separately like other power flow models. In the interior point method, these two variables are not distinguished, and they are uniformly represented by
After the aforementioned analysis, the optimal power flow model is simplified as the following formula:
where
For Equation 28, it is difficult to solve the model. Two relaxation variables
where
If the solution directly according to the aforementioned formula may make the result beyond the feasible range, Eq. 29 can be combined with the objective function to limit the solution result within the determined range, and once it approaches the boundary, the result increases rapidly and returns to the region again.
where
For equality constraints, Lagrange functions can be constructed to find the extremum of each variable:
where
The partial derivatives of
where
Newton's method is used to solve the aforementioned differential equation and simplify it, and the simplified modified equation matrix form is as follows:
where the matrices
According to Eq. 33, a group of solutions closest to the optimal solution can be solved.
4 Example Verification
4.1 Example Verification of the Energy Flow Calculation of the Electrothermal Coupling System
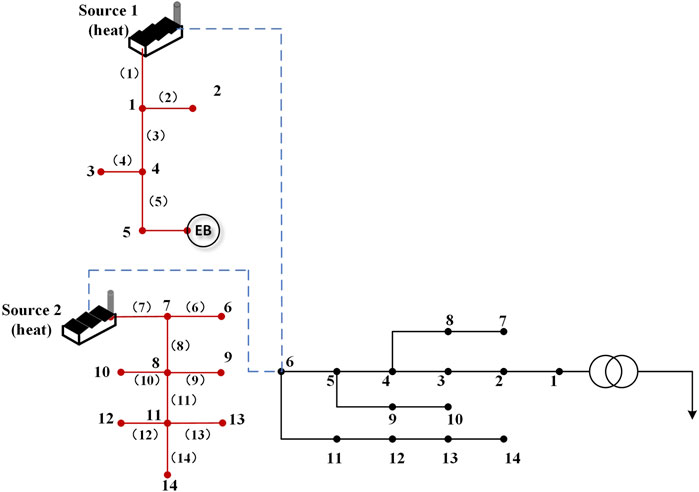
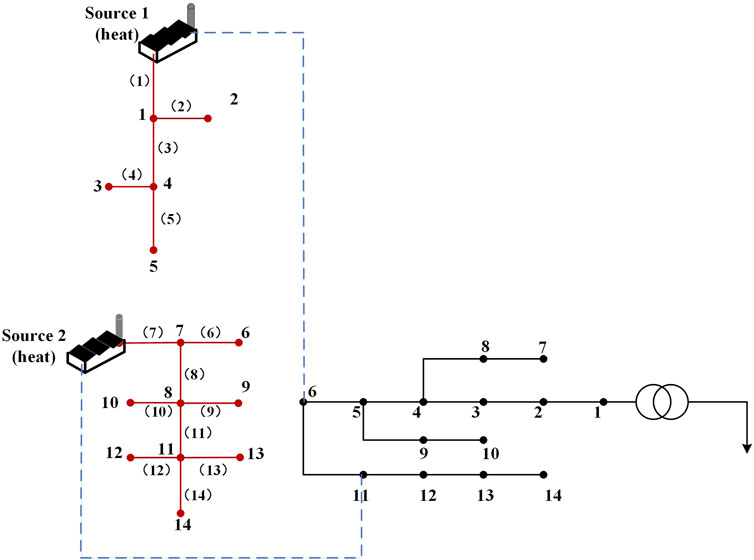
To prove that the aforementioned method can be practically applied, an actual model is used in Figure 3 as an example to conduct experiments.
In this example, the heat grid and the power grid are coupled through the cogeneration unit. The heat network part includes two heat source nodes source 1 and source 2 using a backpressure unit, a peak-shaving electric boiler located at node 5, and 14 heat load nodes. The peak modulation ratio is 0.45, the thermoelectric ratio is 1.4, and the heat load is 0.5 MW. The length of each pipeline is set to 1.58 km,
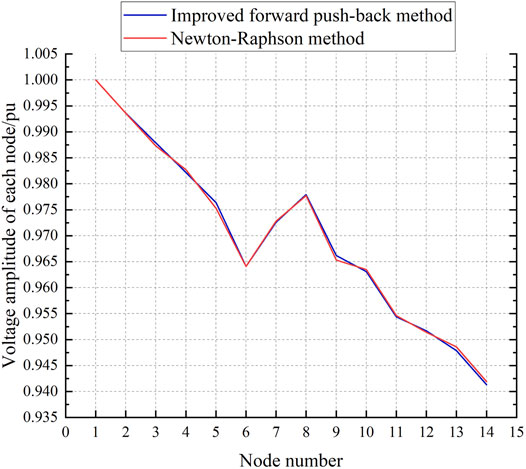
The thermal system and power system are coupled through node 6. The thermal power of node 6 is 1.7347 MW, which is converted to 2.2551 MW. The power grid part selects 14 node distribution networks, node 1 is set to 1.00
4.2 Example Verification of the Optimal Energy Flow Calculation of the Electrothermal Coupling System
In this chapter, the model of the 14-node grid and 14-node heating network shown in Figure 5 is selected for example verification. Two heat sources
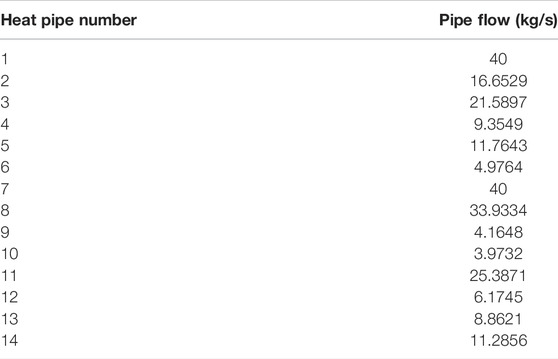
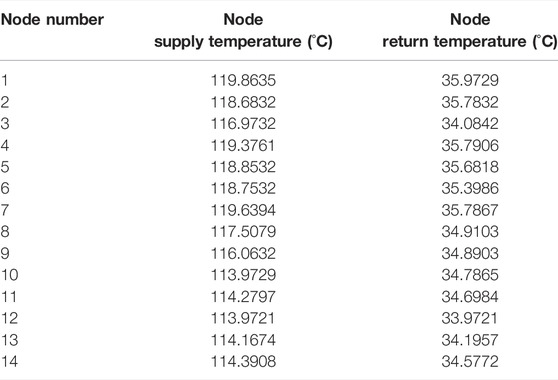
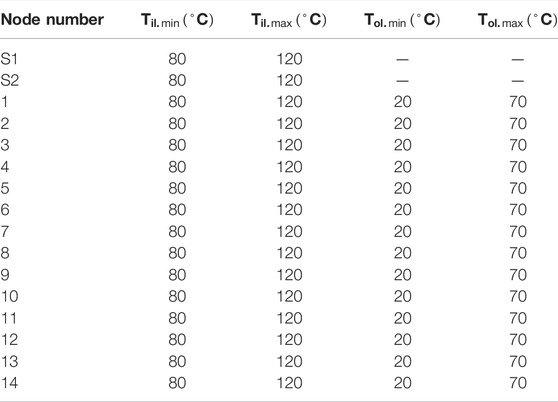
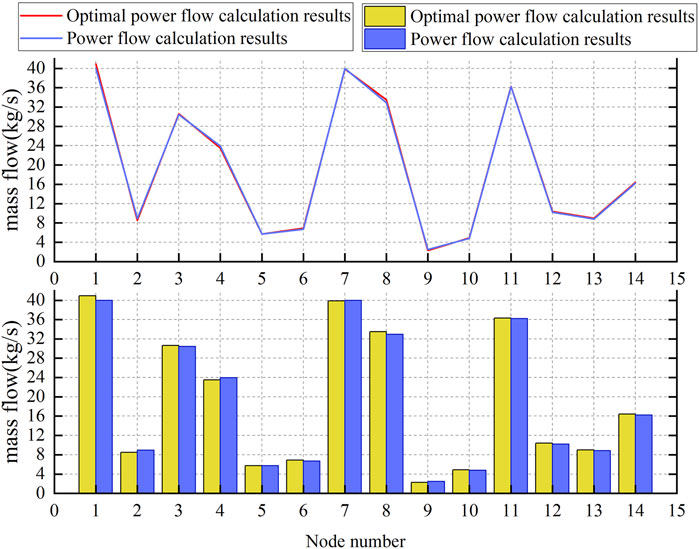
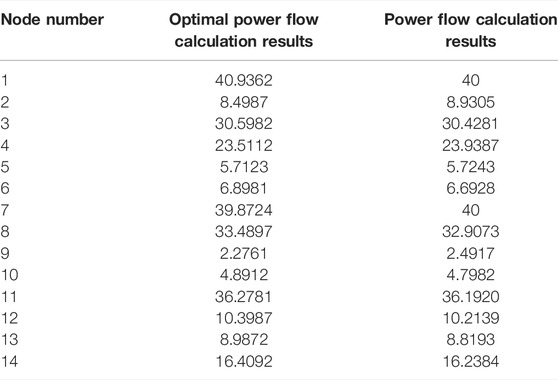
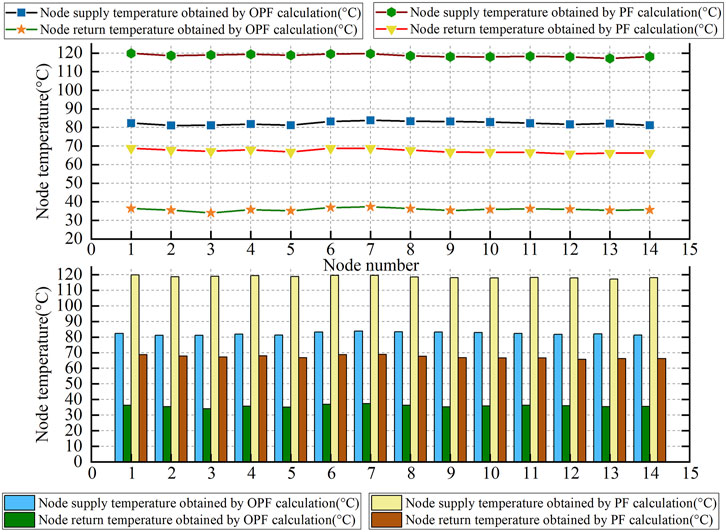
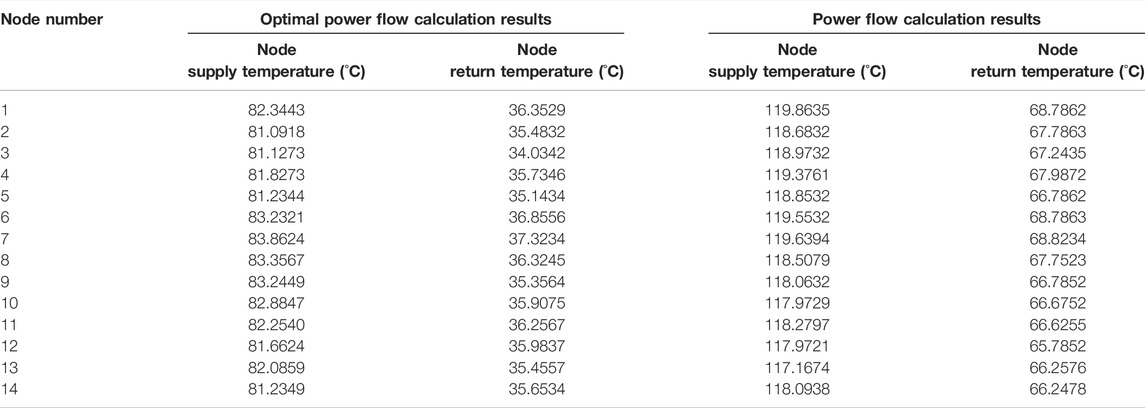
When setting the objective function, the minimum operating cost is selected as the objective function, and the fitting constant in the objective function is selected in Table 4. After setting the initial values and upper and lower limits of each parameter, the simulation is carried out according to the optimal energy flow calculation method described in Section 3.4, and the running cost of the system is minimized by adjusting the thermal power and electric power of the power supply and heat source. The comparison diagram of pipeline flow calculation results of optimal power flow and general power flow is shown in Figure 6 and Table 5. The comparison diagram of the supply and return temperature of each node is shown in Figure 7 and Table 6.
The node temperature obtained from the optimal power flow calculation is determined by optimizing the control variables, while the control variables in the ordinary power flow are initially given. Therefore, it is more economical to introduce the results of the optimal power flow into the actual operation, and the coal consumption will be lower, thus achieving the purpose of the optimal energy flow calculation.
5 Conclusion
In this study, an improved forward push-back substitution method is proposed for the combined electric and heat system. First, models of individual systems and coupled parts are built, and the calculation model of the electro-thermal combined system is constructed. The improved forward-backward substitution method is used for energy flow calculation to realize the analysis and calculation of the energy flow of the whole combined system. Finally, through the calculation and analysis of the example of the comprehensive energy test system, it is proved that the idea proposed in this study can be practically used. In the part of the study of the optimal energy flow calculation method, the interior point method is used to find the parameters that meet the optimal operation conditions of the system. By comparing the simulation results of energy flow calculation and optimal energy flow calculation, it can be obtained that the interior point method is feasible and economical to calculate the optimal energy flow of the electrothermal combined system.
Data Availability Statement
The original contributions presented in the study are included in the article/supplementary material, further inquiries can be directed to the corresponding author.
Author Contributions
ZL was responsible for the main idea, simulation part, and writing work of this study. YZ and JX were responsible for the mathematical derivation. QS participated in the coordination of the study and reviewed the manuscript.
Funding
This work was supported by the Key R&D Program of Liaoning Province (2020JH2/10300101), the Liaoning Revitalization Talents Program (XLYC1907138), the Technology Innovation Talent Fund of Shenyang (RC200252), and the Key R&D Program of Shenyang (GG200252).
Conflict of Interest
QS was employed by the State Grid Liaoning Electric Power Co., Ltd.
The remaining authors declare that the research was conducted in the absence of any commercial or financial relationships that could be construed as a potential conflict of interest.
Publisher’s Note
All claims expressed in this article are solely those of the authors and do not necessarily represent those of their affiliated organizations, or those of the publisher, the editors, and the reviewers. Any product that may be evaluated in this article, or claim that may be made by its manufacturer, is not guaranteed or endorsed by the publisher.
Acknowledgments
The authors acknowledge the funding of the Key R&D Program of Liaoning Province (2020JH2/10300101), the Liaoning Revitalization Talents Program (XLYC1907138), the Technology Innovation Talent Fund of Shenyang (RC200252), and the Key R&D Program of Shenyang (GG200252).
References
Chen, B. B., Sun, H. B., Yin, G. X., Wu, W. C., and Guo, Q. L. (2020). Energy Circuit Theory of Integrated Energy System Analysis (II): Hydraulic Circuit and Thermal Circuit. Proc. CSEE 40, 2133–2142. doi:10.13334/j.0258-8013.pcsee.200098
Guo, Z. G., Lei, J. Y., Ma, X. Y., Yuan, Z. Y., Dong, B., and Yu, H. (2019). Modeling and Calculation Methods for Multi-Energy Flows in Large-Scale Integrated Energy System Containing Electricity, Gas, and Heat. Proc. CSU-EPSA. 31, 97–102. doi:10.19635/j.cnki.csu-epsa.000283
Hu, X., Shang, C., Cheng, H. Z., Wang, L., Chen, D. W., and Li, Y. (2020). Review and Prospect of Calculation Method for Energy Flow in Integrated Energy System. Automation Electr. Power Syst. 44, 179–191. doi:10.7500/AEPS20191113001
Jia, H. J., Wang, D., Xu, X. D., and Yu, X. D. (2014). Research on Some Key Problems Related to Integrated Energy Systems. Automation Electr. Power Syst. 39, 199–207. doi:10.7500/AEPS20141009011
Jiang, P., and Liang, L. (2015). Reactive Power Optimization of Hybrid AC/HVDC Power System Combining Interior Point Algorithm and Genetic Algorithm. High. Volt. Eng. 41, 724–729. doi:10.13336/j.1003-6520.hve.2015.03.004
Krause, T., Andersson, G., Fröhlich, K., and Vaccaro, A. (2011). Multiple-energy Carriers: Modeling of Production, Delivery, and Consumption. Proc. IEEE 99, 15–27. doi:10.1109/JPROC.2010.2083610
Li, J. L., Tian, L., and Lai, X. K. (2015). Outlook of Electrical Energy Storage Technologies under Energy Internet Background. Automation Electr. Power Syst. 39, 15–25. doi:10.7500/AEPS20150906004
Liu, H., Zhao, C. X., Ge, S. Y., Li, J. F., and Liu, J. Y. (2021). Sequential Power Flow Calculation of Power-Heat Integrated Energy System. Automation Electr. Power Syst. 45, 63–72. doi:10.7500/AEPS20200312009
Liu, X., Wu, J., Jenkins, N., and Bagdanavicius, A. (2016). Combined Analysis of Electricity and Heat Networks. Appl. Energy 162, 1238–1250. doi:10.1016/j.apenergy.2015.01.102
Moeini-aghtaie, M., Abbaspour, A., Fotuhi-firuzabad, M., and Hajipour, E. (2014). A Decomposed Solution to Multiple-Energy Carriers Optimal Power Flow. IEEE Trans. Power Syst. 29, 707–716. doi:10.1109/TPWRS.2013.2283259
OMalley, M., and Kroposki, B. (2013). Energy Comes Together: The Integration of All Systems [Guest Editorial]. IEEE Power Energy Mag. 11, 18–23. doi:10.1109/MPE.2013.2266594
Rui, W., Qiuye, S., Pinjia, Z., Yonghao, G., Dehao, Q., and Peng, W. (2020). Reduced-order Transfer Function Model of the Droop-Controlled Inverter via Jordan Continued-Fraction Expansion. IEEE Trans. Energy Convers. 35, 1585–1595. doi:10.1109/TEC.2020.2980033
Sun, G. Q., Wang, W. X., Wu, Y., Hu, W., and Jing, J. P. (2020). Fast Power Flow Calculation Method for Radiant Electric-Thermal Interconnected Integrated Energy System. Proc. CSEE 40, 4131–4141. doi:10.13334/j.0258-8013.pcsee.190583
Wang, R., Sun, Q., Hu, W., Li, Y., Ma, D., and Wang, P. (2021a). SoC-based Droop Coefficients Stability Region Analysis of the Battery for Stand-Alone Supply Systems with Constant Power Loads. IEEE Trans. Power Electron. 36, 7866–7879. doi:10.1109/TPEL.2021.3049241
Wang, R., Sun, Q., Ma, D., and Liu, Z. (2019). The Small-Signal Stability Analysis of the Droop-Controlled Converter in Electromagnetic Timescale. IEEE Trans. Sustain. Energy 10, 1459–1469. doi:10.1109/TSTE.2019.2894633
Wang, R., Sun, Q., Tu, P., Xiao, J., Gui, Y., and Wang, P. (2021b). Reduced-order Aggregate Model for Large-Scale Converters with Inhomogeneous Initial Conditions in DC Microgrids. IEEE Trans. Energy Convers. 36, 2473–2484. doi:10.1109/TEC.2021.3050434
Xia, T., Chen, Y. W., Guo, Q. L., Sun, H. B., Xiong, W., and Liu, Y. Q. (2017). Power Flow Calculation Based on PSASP for Combined Thermal and Electric Energy System. Electr. Power Autom. Equip. 37, 55–61. doi:10.16081/j.issn.1006-6047.2017.06.008
Yu, J., Yang, D., and Chen, Z. (2021). Multi-energy Flow Calculation Based on Energy Cell and Parallel Distributed Computation. Int. J. Electr. Power & Energy Syst. 131, 107147. doi:10.1016/j.ijepes.2021.107147
Zhang, T., Li, Z., Wu, Q., Pan, S., and Wu, Q. H. (2022). Dynamic Energy Flow Analysis of Integrated Gas and Electricity Systems Using the Holomorphic Embedding Method. Appl. Energy 309, 118345. doi:10.1016/j.apenergy.2021.118345
Keywords: distributed energy, power system, thermal system, energy flow calculation, optimal energy flow
Citation: Li Z, Zhao Y, Xu J and Shao Q (2022) Research on Optimal Energy Flow Calculation of an Electro-Thermal Coupled System via an Interior-Point Approach. Front. Energy Res. 10:911939. doi: 10.3389/fenrg.2022.911939
Received: 03 April 2022; Accepted: 26 April 2022;
Published: 16 June 2022.
Edited by:
Rui Wang, Northeastern University, ChinaReviewed by:
Pengning Zhang, China University of Mining and Technology, ChinaJiaqi Shi, North China Electric Power University, China
Copyright © 2022 Li, Zhao, Xu and Shao. This is an open-access article distributed under the terms of the Creative Commons Attribution License (CC BY). The use, distribution or reproduction in other forums is permitted, provided the original author(s) and the copyright owner(s) are credited and that the original publication in this journal is cited, in accordance with accepted academic practice. No use, distribution or reproduction is permitted which does not comply with these terms.
*Correspondence: Yan Zhao, emhhb3lhbkBzaWUuZWR1LmNu
 Zhaoying Li1,2
 Yan Zhao