
95% of researchers rate our articles as excellent or good
Learn more about the work of our research integrity team to safeguard the quality of each article we publish.
Find out more
METHODS article
Front. Energy Res. , 16 August 2022
Sec. Advanced Clean Fuel Technologies
Volume 10 - 2022 | https://doi.org/10.3389/fenrg.2022.907877
This article is part of the Research Topic Recent Advances in High-efficiency Development of Conventional/Unconventional Gas Reservoirs and CCUS Technologies View all 51 articles
 Lu Ming1,2
 Liao Hualin1,2*
 Wang Huajian1,2Liu Jiansheng1,2He Yuhang1,2Qu Fengtao1,2Niu Wenlong1,2Wang Yifan1,2,3
The slip of the packer is the core part of the anchoring system. Unreasonable design of the slip structure can easily cause damage to the anchor claw of the slip, unstable anchoring, and even damage to the casing. At present, the main methods of slip anchoring performance tests are indoor design and field tests, and slips with different structural parameters need to be processed to verify their anchoring performance. In order to ensure that the slips can play a good anchoring effect and reduce the damage to the casing, this study uses a combination of finite element analysis, BP&NSGA-II, and indoor tests to study the mechanical behavior of the slips during the anchoring process. A prediction model was established to optimize the key parameters affecting anchoring performance, such as slip angle, inclination angle, inner cone angle, the radius of curvature, and spacing. Indoor experiments show that the prediction method can greatly improve the efficiency and accuracy of the design and test the anchoring performance of slips.
In view of the nonlinearity and furrow phenomenon in the anchoring process of slips and casing, the design method based on the experiment is mainly used to analyze the anchoring performance of slips and casing. In the entire design process, structural design-test-optimize the structural parameters of slips-test verification. This method not only exhibits a long design cycle but also exhibits a high research and development cost.
Ma measured the internal stress and contact stress of slips and obtained the stress changes of slips (Ma and Zhai, 2009). The simulation test research on packer slips was carried out and studied the stress changes of slips (Yong, 2008). Li analyzed the occlusion of slips and casing and pointed out the deformation law of slips (Tong and Qing-Xian, 2004). Next, Wang analyzed the stress conditions of flukes and casing through photo elastic physics and numerical simulation, and the results showed that the flukes exhibited uneven stress, which laid a foundation for subsequent structural optimization (Wang and Zhu, 2008).
The BP neural network is a forward artificial neural network that is widely used at present. Because the network demonstrates good associative memory and fault tolerance, it can quickly and effectively reflect the complex and highly non-linear relationship between input and output in the actual application process. Based on this, many scholars at home and abroad have carried out a lot of related scientific research (Lou and Yang, 1998a; Lee et al., 1999a). At present, the main methods of slip anchoring performance tests are indoor design and field tests, and slips with different structural parameters need to be processed to verify their anchoring performance. However, still, no report exists about the use of this method to predict the performance of kava anchoring.
This study will use the method of BP&NSGA-II (back propagation and non-dominated sorting genetic algorithm) to study the prediction method of slip anchoring mechanical properties, in order to provide certain technical support for the optimization design of downhole packer slips.
The structure of the packer is more complicated, but the main load transfer during the anchoring process is the cone, slips, slip seat, and casing. In order to facilitate the analysis of the anchoring performance of slips, the actual structure of the packer was simplified, and a structural model of the slip system was established. The structural model of the slip system is shown in Figure 1, R is the radius of curvature of the slip anchor claw (initial value is 62 mm), α is the inclination angle of the anchor claw (the initial value is 60°), β is the anchor claw angle (the initial value is 60°), and d is the distance between the anchor claws (initial value) 8 mm), of which the inner diameter of the casing is 124.26 mm.
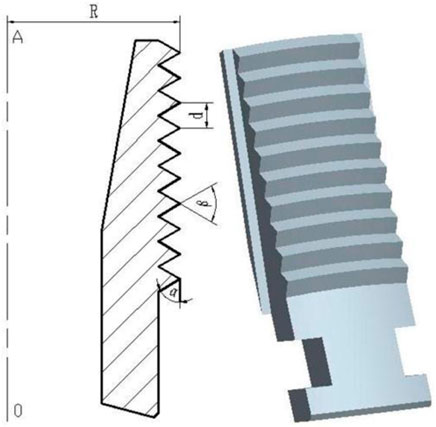
FIGURE 1. Slip system structure model.
Next, as the calculation of the contact problem with the casing during the slip anchoring process is more complicated, in order to facilitate the calculation and analysis, the following points were considered in the process of establishing the finite element model of the slip system:
1) Since the slips are distributed in five equal parts on the surface of the packer, the finite element model only takes 1/5 of the structural model.
2) Since the center tube, the sleeve and other parts do not affect the contact analysis between slips and casing, and the above parts are ignored in the finite element model. The finite element model of the slip system is shown in Figure 2.
3) Since all the components of the slip system are continuums, SOLID95 elements are used for meshing. This element can get the calculation result more accurately when it is subjected to large deformation and large strain. Also, the grid division of the slip system is shown in Figure 3.
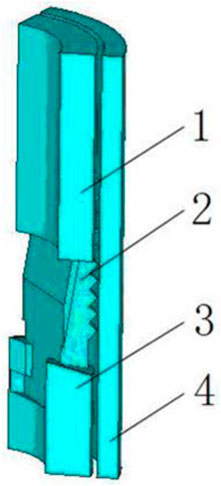
FIGURE 2. The finite element model of the slip system.
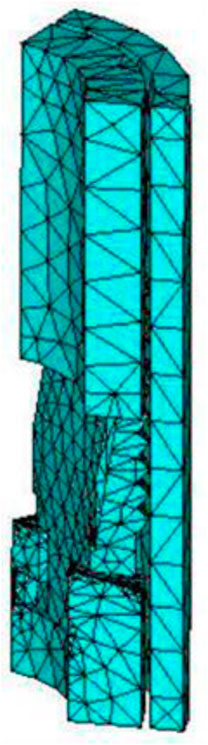
FIGURE 3. Schematic diagram of grid division.
According to the working environment of the packer, set the boundary conditions of the finite element model as follows:
1) The movement of the cone can only be translated along the axial direction, restricting its circumferential and radial movement;
2) Symmetrical constraints are imposed on the circumference of the side profile of the cone, slip seat, and casing;
3) The slip seat and the bottom surface of the casing are fully restrained.
The load is applied, and a load of 120 kN is applied at the anchor time based on field experience, so a normal load of 24 kN is applied to the upper section of the cone. The Von Mises equivalent stress distribution cloud diagrams of slips and casing are obtained by calculation, as shown in Figures 4, 5.
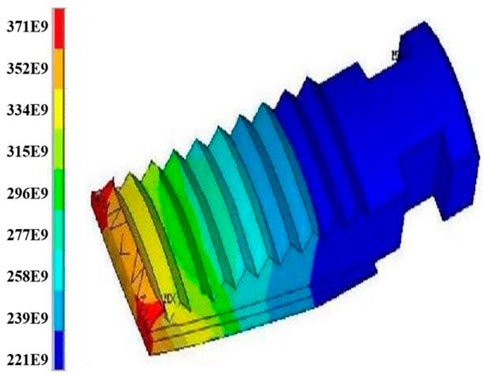
FIGURE 4. KaVo Von Mises equipotency distribution cloud map.
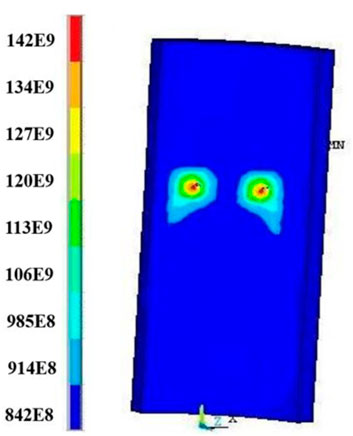
FIGURE 5. Von Mises isopotency distribution cloud diagram of casing.
According to the calculation results, the following conclusions can be drawn:
1) The maximum contact pressure between slips and casing is 26.508 kN, which is likely to cause unstable anchoring of the packer;
2) In the same anchor claw of the slip, the stress on both sides is greater than the middle part;
3) In the axial section of slips, the upper-end anchor claw stress in the same axial direction is greater than the lower end anchor claw stress;
4) Slips and casing exhibit stress concentration, and both are easily damaged.
The above conclusion shows that the contact pressure distribution between slips and casing is unreasonable, and the overall structure of slips needs to be optimized.
According to the previous non-linear contact finite element analysis of the structural parameters of the slips, the effect of the key structural parameters of the slips on the performance is understood; in the entire optimization design, the radius of curvature of the slips, the overall cone angle, the anchor teeth, the profile angle, the pitch of the anchor claws, and the overall oblique angle of the anchor claws are designed to optimize the design variables, and the maximum value of the contact pressure between the slips and the casing and the uniform distribution of the slip contact pressure is the optimization targets, that is, the fitness value. Next, the slip prediction model established by the neural network evaluates the maximum value and distribution of contact pressure after contact analysis of each group of slip structure parameters. In order to predict the comprehensiveness and accuracy of the model, ensuring that the sample space is comprehensive and uniform is necessary, and the orthogonal experimental design method in the experimental design method is used to select the experimental parameters (Yang, 2001; Yan et al., 2003).
All sample points designed through orthogonal experiments are numerically simulated using Abaqus software, and the average and maximum contact stress values under different combinations of structural parameters are analyzed. Use the analyzed results to train the neural network and establish the anchoring performance prediction model of slips.
In the structural optimization process of slips, the key points in the optimization process are the selection of optimized parameters and the use of the approximate model neural network to evaluate the fitness value. The key points are analyzed and discussed below.
1) Determine the optimization variable range of slip structure parameters
In the entire optimization design, the radius of curvature of slips, the overall taper angle of slips, the tooth profile angle of slips, the spacing of slips, and the overall oblique angle of slips are used as optimization design variables. The value ranges of the variables of each optimized design are shown in Table 1.
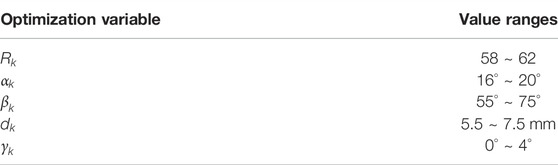
TABLE 1. Value ranges of the optimized variables of slips.
2) Test design planning network sample space
Next, plan the network input sample space according to the orthogonal experiment method in the experiment design. In the structural optimization of slips, five optimization variables are found, and each optimization variable takes five values; 625 kinds of slips exist that need to be tested and studied. This brings a great workload to both processing tests and numerical simulations. In the multi-factor experiment, the orthogonal experiment design method refers to the use of all experimental data as the source, in which some representative test points are selected for test analysis, and the selected test points are required to be “balanced and dispersed,” “tidy and comparable,” “specialty. For the five-factor five-level orthogonal test design method, the orthogonal table is 25 sets of test data, which greatly reduces the difficulty of the test and can effectively carry out the test analysis. Among them, the test data of the orthogonal test design can be used as the training set of the neural network, and the comprehensiveness and uniformity of the sample space will greatly increase the accuracy of the neural network prediction.
Next, according to the characteristics of slip structure parameters, the five-factor and five-level test plan of slips ware established through the orthogonal experiment method. The factor level table of slips is shown in Table 2, and the design scheme of the L25 (55) orthogonal table test is shown in Table 3.
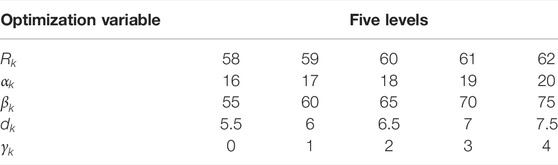
TABLE 2. Factors and their level value table.
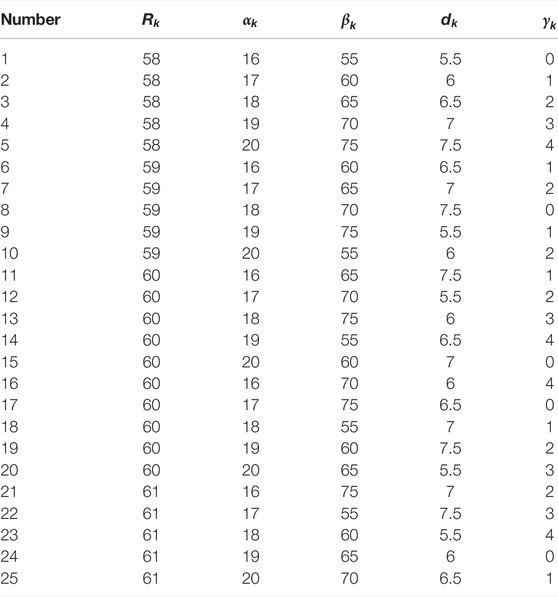
TABLE 3. L25 (55) orthogonal table.
1) Analysis of prediction model topology
N, the entire optimization design, the slip radius of curvature
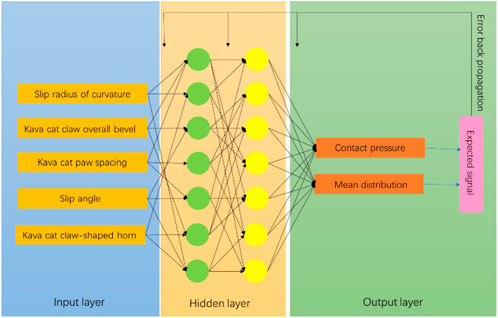
FIGURE 6. Topological structure of BP neural network slip performance prediction model.
2) Normalization of input and output parameters
The input and output parameters of the neural network must be normalized. Since the normalized range of input and output parameters determines the training effect of the neural network, generally, the larger the normalized range of input and output parameters, the faster the final convergence speed. Next, the input and output parameters are normalized according to Formula (1).
3) Training BP neural network
Since the function trainlm is a combination of the gradient method and the Gauss-Newton method, the function trainlm is selected to train the network. According to the error of the output result and reduce the error function value, this training method can dynamically analyze the convergence direction of the iteration. In the entire BP neural network training, the number of training steps is set to 2,000, and the final target error of the network is set to 0.00001. The training process is shown in Figure 7.
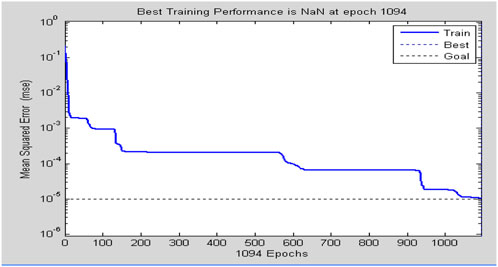
FIGURE 7. Convergence speed during model training.
Through the comparative analysis of the numerical simulation results and the prediction results of the BP neural network prediction model, as shown in Figure 8, it can be seen that the prediction model deviation is 5.5%, to meet the engineering requirements.
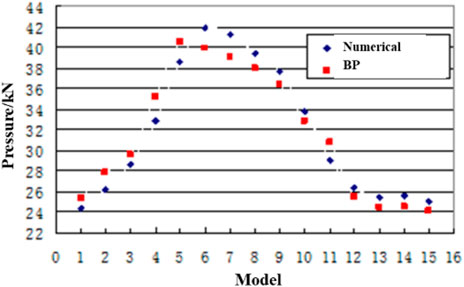
FIGURE 8. Comparison of numerical simulation and neural. network prediction of slip anchoring performance.
Using Matlab language, a multi-objective optimization program for the key components of slips is compiled, namely the following: the NSGA-II optimization program (Lou and Yang, 1998a; Lee et al., 1999a; Tong and Qing-Xian, 2004; Yu et al., 2008; Wang and Zhu, 2008; Zhang, 2009a; Zhang, 2009b; Zhang et al., 2019).
1) Optimize variable initialization
First, use the initialization function Initialize_variable to encode the optimization variables in real numbers and get the initial population optimized by the optimization variables. In this article, real-number coding is used to facilitate the optimization of variables in a large-space evolutionary search under a large range of values. After real-number coding is used for the five structural parameter variables that affect the performance of slips, Initialize_variable generates N initial populations of individuals, that is, the initial population matrix F that generates slip structure variables is shown in Formula (1). Next, the first column of the matrix is that the radius of curvature of slips is
2) Obtain fitness value
To perform the survival of the fittest in the population, the evolution process of the population in the genetic algorithm analyzes and calculates the fitness function value. In this study, a prediction model of key parameters of kava anchoring performance based on the BP neural network is established to calculate the fitness value, and the function Evaluate_objective is used to obtain the fitness value (Lee et al., 1999b; Yu et al., 2008).
To obtain a new matrix F, the performance corresponding to each individual is added to the optimized variable population matrix, as shown in Formula (2). The first four columns in F are the individual vectors in the group, and the last two columns are the fitness values corresponding to each individual, the values of which can be obtained by network prediction. Suppose individuals are found in the group, therefore, F is a matrix of
3) Non-dominant ranking
Use the function Fast_nondominated_sort to perform non-dominated sorting on optimization variables.
As mentioned above, the vector corresponding to the individual in Formula (2) is defined as
In the sorting process, first, all individuals with
After the above sorting is completed,
4) Genetic manipulation
Use the function Genetic_operatorto, perform the genetic evolution operation of selection, crossover, and mutation on the matrix
The selected individuals are uniformly crossed, that is, by exchanging each gene of the two selected individuals in the population. After the exchange, two completely new individuals will be formed.
At random select two bodies from the population
Next, generating new individuals through mutation is also the main step of evolutionary genetic algorithms. Use uniform variation to select uniformly distributed random numbers within a specified range to replace individual values at various locations. For example, when an individual

TABLE 4. NSGA-Ⅱ operating parameters in the optimization of slip structure.
5) Population substitution
Learn from the elite strategy, use the substitution function to expand the sample, and more and better good parents will be found in the next generation, and the parents and offspring will be merged as a new population after expansion. The parent population and the offspring population are integrated through the non-dominated sorting function Fast_nondominated_sort and crowding_distance_assignment to generate an intermediate_chromosome containing 2N individuals, sorting them to the top N individuals. As the subgroup after replacement.
By completing the initialization of optimization variables, obtaining fitness values, non-dominant sorting, genetic operations, and population substitution, the optimization design program will determine the end criterion. When the optimal design procedure reaches the maximum number of iteration steps, the optimization is terminated.
6) Optimization results
After a multi-objective and multi-parameter optimization program based on NSGA-II, the optimization analysis results of the key parameters of the slip setting are shown in Table 5:

TABLE 5. Comparison of initial design and optimal design.
Using Abaqus software for numerical simulation calculation (Malinov and Sha, 2004; Weidong et al., 2004; Bhadeshia et al., 2009; Sun et al., 2010; Liu et al., 2016), the results show that the contact stress between the optimized slip and the casing is increased by 79%, and the numerical simulation calculation results show that the optimized structural parameters of the method improve the anchoring performance. The contact stress cloud diagram after slip optimization is shown in Figure 9, and the contact stress cloud diagram of the casings in contact is shown in Figure 10.
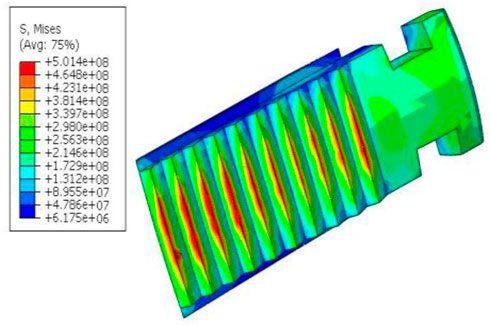
FIGURE 9. KaVo Von Mises stress distribution cloud diagram.
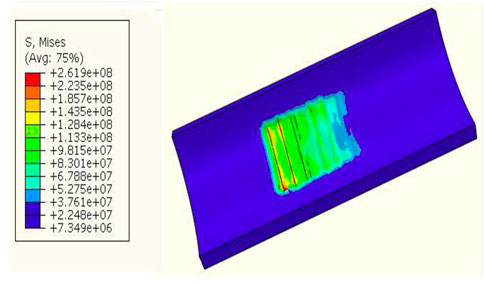
FIGURE 10. Von Mises stress distribution cloud diagram of casing.
1) Test purpose
Simulating the actual conditions of the underground, the slips were installed on the packer for indoor tests, and the slip performance setting test was performed indoors to compare the anchoring performance of slips before and after the optimization of the slip structure. The schematic diagram is shown as Figures 11, 12.
2) Test principle (HOPPERSTAD et al., 2003; Gao et al., 2012; Zhang et al., 2007)
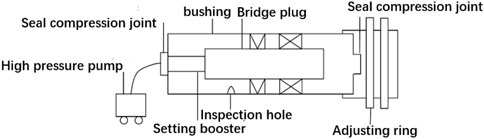
FIGURE 11. Schematic diagram of the overall test of the anchoring performance of the packer and slips.
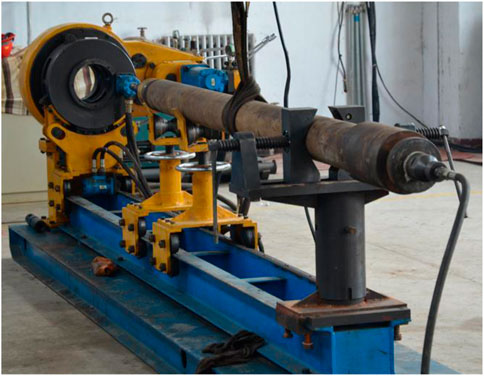
FIGURE 12. Slip anchoring performance and the overall sealing test device of the packer.
The packer is fed into a casing with a diameter of 124 mm. The casing simulates a downhole casing. For the convenience of observation, the casing is divided into two sections. Next, the packer is placed on the disassembly rack. The axial load is applied by an axial loader, and the field test is simulated under indoor conditions.
3) Test device
Disassembly frame (Figures 12, 13), packer prototype, high-pressure pump, high-pressure hose, joints, etc.
4) Test method
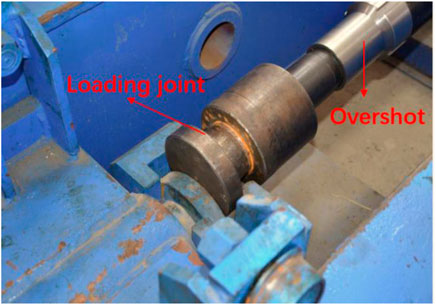
FIGURE 13. Schematic diagram of axial loading.
According to the structural parameters of the slip initial design (No. 1 slip) and the optimal design (No. 2 slip), two sets of different slips were processed for indoor testing.
Assemble the packer compression plug, change button, packer, and anchor seal connection, slowly feed the combination into the casing sub-section in the horizontal direction, and push it together with the packer rubber cylinder and slips into the casing.
The packer is placed on the unloading machine following the casing, pressurized outside the pipe in the experimental wellbore, and axially loaded 70 KN to set the packer. After the setting is completed, pressure is applied to the upper and lower pressure ports to verify the seal and record the test data.
5) Test parameters
The Figure 13 is the schematic diagram of axial loading. The test process adopts the method of increasing the pressure step by step, and the test is divided into four stages:
Stage 1: Pressure is 20 MPa, stabilized for 30 min; Phase 2: Pressure of 30 MPa, stabilization for 30 min; Phase 3: Pressure 75 MPa, stabilized for 30 min; Stage 4: Pressure 105 MPa, stabilized for 48 h.
5) Test results
Figure 14 is shown the wear condition of No. 1 slip group. The experimental results show that the slips in Group 1 (Figure 14) are seriously damaged. Next, when the packer receives an axial load of 30 MPa, it starts to move. When the axial load reaches 105 MPa, the final axial displacement is 300 mm. The slip anchoring performance and the design requirements are not met.
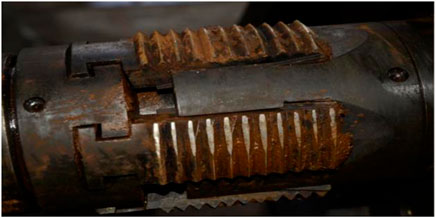
FIGURE 14. Wear condition of No. 1 slip group.
Figure 15 is the wear condition of No. 2 slip group, the axial load reaches 105 MPa, and the pressure is stabilized for 48 h without pressure drop. The packer did not leak during the actual sealing process, indicating that under the action of axial pressure load, the upper and lower slips can achieve uniform occlusion of the casing wall after effective cracking. After the packer is successfully set, the test is over. The slips demonstrate no axial displacement, and the slips basically demonstrate no abrasion. The anchoring performance of the slips is good and meets the design requirements.
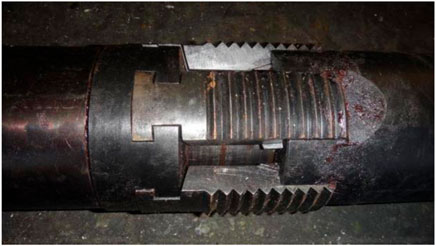
FIGURE 15. Wear condition of No. 2 slip group.
1) In this study, by determining the slip structure parameters to optimize the variable range and the network sample space, the orthogonal experiment method is used to establish a test plan. Based on a large number of slip contact analysis results as the neural network training sample points, a BP neural network-based prediction model of slip anchoring performance realizes the scientific optimization of slip anchoring performance prediction.
2) This study uses the BP neural network to test the parameters outside the training sample space, which verifies that the BP neural network prediction model established in this article demonstrates a certain generalization ability. By comparing and analyzing the results predicted by numerical simulation and BP neural network prediction model, the error meets the requirements of the project.
3) The anchoring performance test results based on slip optimization and the initial structure show that a big gap exists between the slips of the initial structure and the slips optimized by the BP&NSGA-Ⅱ method in terms of anchoring performance. As far as the anchoring performance of slips is concerned, the test results are in good agreement with the numerical simulation results.
4) Experiments verified that the prediction method demonstrates the advantages of good fault tolerance and strong versatility and can effectively optimize the anchoring performance and structural parameters of slips. At the same time, applying the BP&NSGA-Ⅱ method to the field of mechanical design can significantly shorten the equipment design cycle, improve efficiency, and greatly reduce equipment R&D costs.
The original contributions presented in the study are included in the article/supplementary material, and further inquiries can be directed to the corresponding author.
All authors listed made a substantial, direct, and intellectual contribution to the work and approved it for publication.
WY was employed by the CNPC Tarim Oilfield Company.
The remaining authors declare that the research was conducted in the absence of any commercial or financial relationships that could be construed as a potential conflict of interest.
All claims expressed in this article are solely those of the authors and do not necessarily represent those of their affiliated organizations, or those of the publisher, the editors, and the reviewers. Any product that may be evaluated in this article, or claim that may be made by its manufacturer, is not guaranteed or endorsed by the publisher.
Bhadeshia, H. K. D. H., Dimitriu, R. C., Forsik, S., Pak, J. H., and Ryu, J. H. (2009). Performance of Neural Networks in Materials Science. Mater. Sci. Technol. 25 (4), 504–510. doi:10.1179/174328408x311053
Gao, Yifei, Liang, Xinbang, and Deng, Xinglin (2012). Implementation Guide for "Room Temperature Test Method for Tensile Test of Metallic Materials. Beijing: China Quality Inspection Press. [M].
Hopperstad, O. S., Børvik, T., Langseth, M., Labibes, K., and Albertini, C. (2003). On the Influence of Stress Triaxiality and Strain Rate on the Behaviour of a Structural Steel. Part I. Experiments. Eur. J. Mech. - A/Solids 22 (1), 1–13. doi:10.1016/s0997-7538(02)00006-2
Lee, J. A., Almond, D. P., and Harris, B. (1999). The Use of Neural Networks for the Prediction of Fatigue Lives of Composite Materials. Compos. Part A Appl. Sci. Manuf. 30, 1159–1169. doi:10.1016/s1359-835x(99)00027-5
Liu Jingchao, , , Wang Xiao , , and Ma Huanqi, , etc. Experimental Study on the Fracture Pressure of Integral Slips[J]. Drill. Prod. Technol., 2016, 39(4): 67–69. doi:10.1016/j.fuel.2021.121789
Lou, Shuntian, and Yang, Shi (1998). Design and Analysis Based on the MATLAB System-Neural Network (System Analysis and Design Based on MATLAB-Neural Network). China, Xi dian University Press. [M]. Xi an.
Lou, Shuntian, and Yang, Shi (1998). Design and Analysis Based on the MATLAB System-Neural Network[M]. Xi’an: Xidian University Press.
Ma, C., and Zhai, Q. (2009). Analysis on Stress of Packer Slips through Photoelastic experiment[J]. Refining and Chemical Industry.
Malinov, S., and Sha, W. (2004). Application of Artificial Neural Networks for Modelling Correlations in Titanium Alloys. Mater. Sci. Eng. 365, 202–211. doi:10.1016/j.msea.2003.09.029
Sun, Yu, Zeng, Weidong, and Zhao, Yongqing Rare Metal Materials and Engineering[J], 2010, 39(6): 1031
Tong, L. I., and Qing-Xian, M. A. (2004). Simulation Study on Mechanical Conditions in Working Process of Packer slip[J]. Beijing: Oil Field Equipment.
Wang, W., and Zhu, J. (2008). Mechanics Analysis of the Slip Fluke in Retrievable Bridge plug[J]. China: China Petroleum Machinery.
Weidong, Z., Ying, S., and Yigang, Z. (2004). Prediction of Mechanical Properties of Ti-10V-2Fe-3Al Alloy Using Artificial Neural Network Model [J]. Rare Metal Materials and Engineering 10, 1041–1044.
Yan, M., Liang, D. K., and Wan, P. F. (2003). Fractal Neural Network Diagnosis Method of Smart Structure Damage.. Mater. Sci. Eng.
Yang, Jiangang (2001). Practical Application of Artificial Neural Network (Practical Application of Artificial Neural Network) [M]. Hangzhou: Zhejiang University Press, 41.
Yong, B. I. (2008). Experimental Research on Valvular Slip Contact stress[J]. Daqing: Petroleum Geology & Oilfield Development in Daqing.
Yu, S., Zhu, K., and Diao, F. (2008). A Dynamic All Parameters Adaptive BP Neural Networks Model and its Application on Oil Reservoir Prediction. Appl. Math. Comput. 195 (1), 66–75.
Zeng Weidong, Shu Ying and Zhou Yigang. Prediction of Mechanical Properties of Ti-10V-2Fe-3Al Alloy Using Artificial Neural Network Model [J]. Rare Metal Materials and Engineering, 2004(10): 1041–1044.
Zhang, Defeng (2009). Application and Design of Artificial Neural Network Using MATLAB (MATLB Neural Network Application Design [M]. Beijing: China Machine Press, 94.
Zhang, Defeng (2009). Application and Design of Artificial Neural Network Using MATLAB[M]. Beijing: China Machine Press, 94.
Zhang, Limin, Xi, Wenfeng, and Meng, Qinyu (2007). Using MTS Extensometer to Measure Poisson's Ratio of Metal Materials on a Domestic Testing Machine [J]. Laboratory Res. Explor. 26 (11), 315–316.
Keywords: prediction model, BP neural network, numerical analysis, slip sealing, indoor test
Citation: Ming L, Hualin L, Huajian W, Jiansheng L, Yuhang H, Fengtao Q, Wenlong N and Yifan W (2022) Research on Prediction and Optimization Design Method of Slip Anchoring Performance Based on BP&NSGA-II. Front. Energy Res. 10:907877. doi: 10.3389/fenrg.2022.907877
Received: 30 March 2022; Accepted: 17 June 2022;
Published: 16 August 2022.
Edited by:
Hui Zhao, Yangtze University, ChinaReviewed by:
Hao Yu, Southwest Petroleum University, ChinaCopyright © 2022 Ming, Hualin, Huajian, Jiansheng, Yuhang, Fengtao, Wenlong and Yifan. This is an open-access article distributed under the terms of the Creative Commons Attribution License (CC BY). The use, distribution or reproduction in other forums is permitted, provided the original author(s) and the copyright owner(s) are credited and that the original publication in this journal is cited, in accordance with accepted academic practice. No use, distribution or reproduction is permitted which does not comply with these terms.
*Correspondence: Liao Hualin, bGlhb2h1YWxpbjIwMDNAMTI2LmNvbQ==
Disclaimer: All claims expressed in this article are solely those of the authors and do not necessarily represent those of their affiliated organizations, or those of the publisher, the editors and the reviewers. Any product that may be evaluated in this article or claim that may be made by its manufacturer is not guaranteed or endorsed by the publisher.
Research integrity at Frontiers
Learn more about the work of our research integrity team to safeguard the quality of each article we publish.