- State Grid Zhejiang Electric Power Co. Ltd., Hangzhou Power Supply Company, Hangzhou, China
Prosumers refer to the integration of production and consumption. Due to a large number of access to distributed power sources, electric vehicles, etc., which have a certain impact on power transformers, and increasing potential failures, transformers need to be monitored. In recent years, image recognition technology based on deep learning has been widely used in intelligent inspection image analysis. Aiming at the problem that the accuracy of appearance fault diagnosis in intelligent inspection images is limited by image quantity and quality, an image data set optimization method based on a seamless cloning algorithm and image cleaning is proposed. First, a sample generation method based on the seamless fusion algorithm is proposed, which seamlessly fuses the corroded texture of other power equipment into the transformer image to generate the rust transformer image. On this basis, an image quality evaluation and screening method based on the XGBoost algorithm is proposed to evaluate the image quality of the data set and clean the low-quality images. In addition, aiming at the limitation of a single diagnosis algorithm, an appearance diagnosis method based on heterogeneous model ensemble learning is proposed. By constructing multiple learning models and using a weighted voting strategy to fuse model outputs as final outputs, the accuracy of fault diagnosis is improved.
1 Introduction
Prosumers in the power industry mainly use renewable energy to generate electricity, and the generated electricity can be used by itself and the excess electricity can be sold (Rathnayaka et al., 2011; Damisa and Nwulu, 2019). Transformers play an important role in the prosumer community and are used for power transmission and power conversion. At the same time, transformers have the functions of electrical isolation, suppression components, and matching voltage after distributed power sources are merged into the prosumer community (Wu et al., 2019). Fault monitoring of transformers in prosumers enables more efficient use of equipment, increases equipment utilization, and enables purposeful repairs, improving repair levels and making the entire prosumer community safer and more reliable. The transformer is exposed to outdoor operation for a long time. Due to severe weather and a damp environment, the transformer appears to rust and other appearance faults occur, affecting its safe and stable operation (Zhang et al., 2021). The monitoring of hidden danger areas is realized by using computers and sensors instead of manual inspection, which provides a new auxiliary method for diagnosing the transformer appearance state efficiently and reliably.
In the early application of image recognition in the power industry, feature extraction and matching of feature quantity need to be designed according to practical problems, which have a high threshold and poor universality. The designer is required to have a high level of mathematics and data sensitivity. A transmission wire foreign body method based on the linear segment detection algorithm and multi-constraint feature is proposed (Liang et al., 2022). A linear structuring aware point–point line fault detection algorithm used gradient operators in horizontal and vertical directions to detect linear objects (Wang et al., 2015). Lu et al. (2017) proposed a method to identify transformer oil leakage by using the relationship between saturation and intensity in the color space. There is a method that can detect whether the cable is damaged or not by comparing the difference between the cable contour in the image and the ideal cable contour (Ishino and Tsutsumi, 2004). Jiao and Wang (2016) used the frame difference method to mark foreign objects in the keyframes of aerial video and proposed the K-means algorithm cluster analysis ORB (Oriented FAST and Rotated BRIEF) operator to simplify feature points to improve the matching rate.
Although the method (Golightly and Jones, 2013) based on deep learning avoids artificial selection features and can adapt to the complex and changeable inspection image background relatively, the accuracy is often greatly affected by the number of images in the data set. The scarcity of samples is currently a major obstacle to introducing deep learning to the electrical industry. In practical application, it is difficult to collect a large number of annotated available data sets for specific power inspection application scenarios. (Goodfellow et al. (2020 proposed a generative adversarial network that converts parts of normal images into defective images for data enhancement, but this method is based on the learning of a large number of defective images, which we lack. From the perspective of image fusion, Dwibedi et al. (2017) proposed the use of image masks to fuse the target into the background image and reduce the dependence on image rendering. Gupta et al. (2016) explored the use of computer rendering to generate samples but the application scenario is mainly text recognition in images, which is quite different from the grid foreign object detection scenario. In addition, images are an important information source for parameter learning of deep learning algorithms and their quality plays a decisive role in the adequacy and accuracy of acquired information. It is difficult for the algorithm to learn effective and correct information because the main object of power equipment may be unclear and fuzzy in the images collected by the drone or inspection robot (Zhao et al., 2020).
The main contributions of this study are summarized as follows:
1) Aiming at the problem of sample scarcity, a sample generation method based on a seamless fusion algorithm is proposed. The method utilizes an adaptive gradient domain to seamlessly embed the rust texture into the transformer image to generate new rust samples.
2) To reduce the influence of low image quality on fault diagnosis, a quality evaluation and screening method based on the XGBoost algorithm is proposed. The method improves the accuracy and reliability of the information obtained by the fault diagnosis model from the data set by identifying and cleaning the low-quality images in the generated images.
3) To overcome the limitations of a single diagnosis algorithm, an appearance diagnosis method based on the ensemble learning of heterogeneous models is proposed. The method integrates the results of multiple diagnostic algorithms through a weighted voting strategy, balances the advantages and disadvantages of each algorithm, and improves diagnostic accuracy.
2 Data Set Optimization Method
2.1 Appearance Fault Sample Generation Method
2.1.1 The Algorithm Principle of Seamless Cloning
The seamless cloning algorithm (Perez et al., 2003) is mainly used for image mosaic and texture fusion. The algorithm solves the image fusion problem by minimizing the following formula:
where f represents the image region Ω after seamless cloning, ∇ represents the gradient operator, V represents the guidance gradient field of the target to be fused, and f* is the value of f on ∂Ω, with ∂Ω representing the boundary of Ω.
The solution of the aforementioned equation is the only solution of the following equation satisfying the Dirichlet boundary condition f|∂Ω = f*|∂Ω:
where Δ represents the Laplace operator and div represents the divergence operator.
For the image, Ω is a set composed of discrete points. Eq. 1 can be discretized to obtain Eq. 3, where all pixel points p∈∂Ω:
where p represents the pixels on the fused image, <p, q > represents a pixel pair satisfying q∈Np, with Np being the set of four adjacent pixels of pixel point p, fp is the value of f at pixel p, fq is the value of f at pixel q, and vp,q represents the projection of V ((p + q)/2) onto the vector [p, q].
The solution of Eq. 3 satisfies the following equation:
For the pixels inside Ω, Eq. 4 can be simplified into Eq. 5 without meeting the boundary conditions:
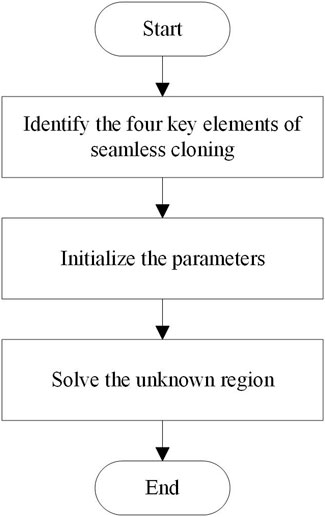
In use, first, we identify the four key elements of seamless cloning, that is, determine the source image Ω, the target image S, the boundary ∂Ω of Ω, and the guiding field V. As shown in Figure 1, we find the middle line of the overlapping area (defined as the bisector of the number of columns in the overlapping area), divide the overlapping area of image I2 into two parts, take the right part as the source image Ω, and define the overlapping area of image I1 as the target image S.
Then, we initialize the parameters. S and Ω take the pixel value of the corresponding image, respectively, the upper and left boundary ∂Ω1 of Ω take the corresponding pixel value of image I1, and the lower and right boundary ∂Ω2 take the corresponding pixel value of image I2. When only horizontal displacement exists in the two images, the upper and lower boundary pixel values are directly zero. For the guidance field V of Ω, in this study, we use the mixed gradient to replace the source image gradient, so as to control the guidance degree of the source and target image gradients to the fusion image gradient.
When the gradient of a point on the target image is relatively large, this gradient value is considered to replace the gradient value of the source image. Therefore, for each point in the source image Ω, the larger gradient (absolute value) is selected as the guiding field guidance interpolation by comparing its gradient on the source and target graphs, and the formula for calculating the mixed gradient is as follows:
where f(x) and g(x) represent scalar functions on the target graph and source graph, respectively.
The discrete form of the mixed gradient is shown in Eq. 7:
Finally, we solve the unknown region. The color image is divided into R, G, and B channels for seamless cloning, and each pixel in the unknown region is solved using Eqs 4 and 5. The obtained equations are combined and converted into the form Ax = b, where A is the coefficient corresponding to Laplace convolution, x is the brightness of each point in the unknown region, and b is the mixed gradient. Finally, the conjugate gradient descent method is used to solve the equation to complete the fusion. The process of a seamless cloning algorithm is shown in Figure 2.
2.1.2 Appearance Fault Sample Generation Method
In practical applications, the performance of the appearance fault diagnosis model based on machine vision may be affected because there are too few defect samples that can be collected. Therefore, it is necessary to generate defect samples through algorithms to expand the data set.
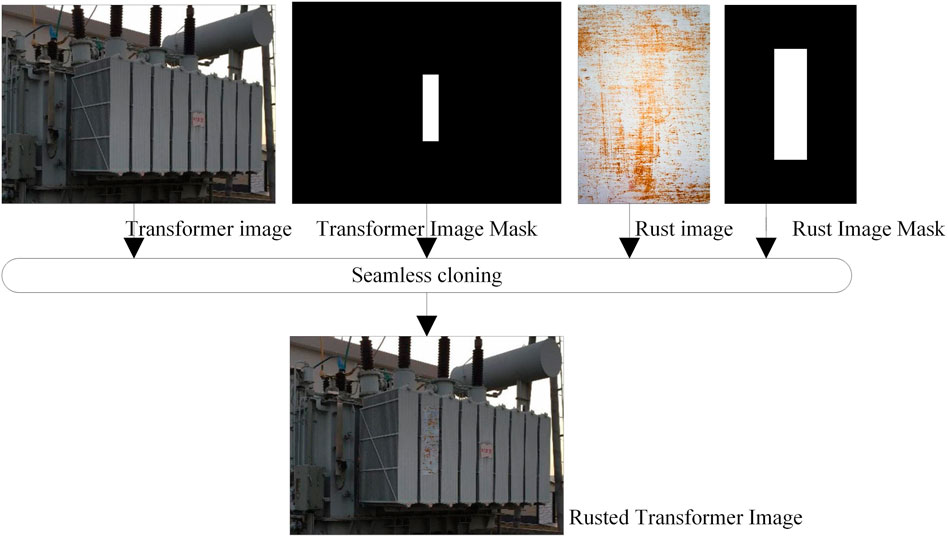
A seamless cloning algorithm can freely select the areas that need to be fused with the corroded image in the transformer image and have much better performance for the fusion between the rusty area and the transformer image (Xi et al., 2018). In an actual substation inspection, although it is difficult to collect a sufficient number of appearance fault samples, many rust images of other equipment can be collected, and these rust samples have important texture information similar to rust images of a transformer. Figure 3 shows the appearance fault sample generation method for the transformer.
2.2 Quality Evaluation Screening
2.2.1 Principle of XGB Algorithm
XGBoost is an optimized integrated tree model, improved and extended from the gradient ascending tree model. The ensemble model of the tree is as follows:
where z’i is the model-predicted value of the ith sample, K is the number of trees, F is the set space of the tree, di represents the feature vector of the ith data point, and fk corresponds to the structure q and leaf weight w of the kth independent tree.
The loss function L of the XGBoost model contains two parts:
where part 1 is the training error between the predicted value z’i and the target true value zi. The second part is the sum of the complexity of the tree, which is the regular term used to control the complexity of the model:
where μ and η represent the penalty coefficients for the model.
During the minimization of the sequence minimization, in Eq. 9, the incremental function ft(di) is added in each round to minimize the loss function as much as possible. The objective function of round t can be written as
2.2.2 Image Quality Evaluation Method
An image is an important information source for parameter learning of a deep learning algorithm and its quality plays a decisive role in the adequacy and accuracy of the information obtained by the algorithm. The main object of substation equipment is unclear and fuzzy in the images taken by inspection robots and other image acquisition devices, and some of the images generated by the image style transfer algorithm are not realistic. The aforementioned low-quality images cannot effectively reflect the image features of substation equipment, which is not conducive to the learning and training of appearance fault diagnosis algorithms and directly affects the accuracy of appearance fault diagnosis. Therefore, data cleaning is necessary.
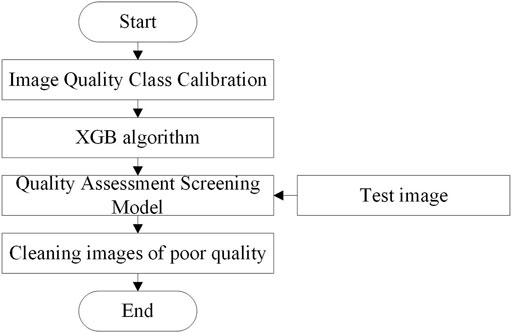
Data cleaning usually involves the manual identification of data set images one by one and the deletion of low-quality images according to the requirements of the recognition task. There are many problems in the process, such as repeated workload and inconsistent judgment criteria. As shown in Figure 4, to conduct the automatic quality assessment and screening of the original substation equipment images and images generated based on the appearance fault sample generation method, a machine learning classification model is used to conduct image quality assessment and screening (Xi et al., 2020). First, the images in the data set are labeled as low quality and high quality according to their quality. Then, the quality evaluation and screening model based on the deep learning classification algorithm (Melgani and Bruzzone, 2004) is trained. Finally, the model is used to calculate the quality category of test images and delete the low-quality images. After the annotation and training, the model can be reused for image quality assessment and cleaning in the same recognition task.
3 Appearance Fault Diagnosis of the Transformer
3.1 Heterogeneous Model Ensemble
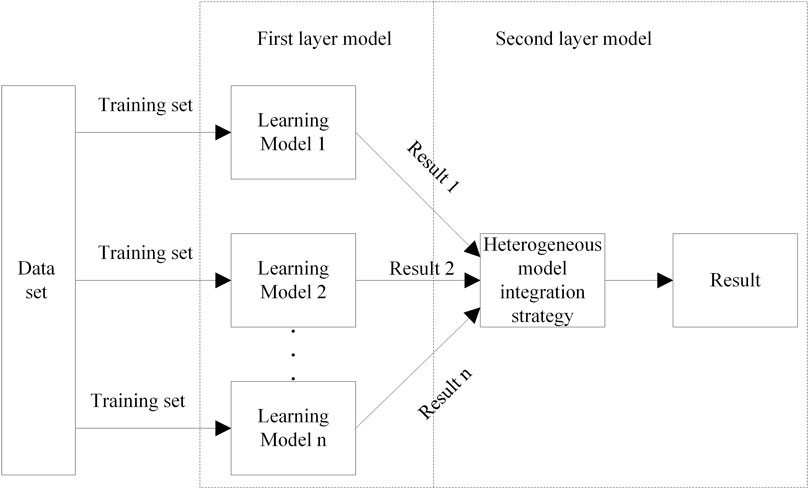
For supervised learning algorithms such as machine learning and deep learning, all kinds of learning models have their own advantages and disadvantages. Therefore, it is often difficult to get a model that can meet all aspects of practical application through learning data sets. Model ensemble (Shi and Zhang, 2019; Li et al., 2020; Liu et al., 2021) is a multi-algorithm fusion machine learning method based on statistical learning theory. The heterogeneous model ensemble is one of the model ensemble methods. By constructing several different learning models and using certain ensemble strategies to fuse the model outputs as the final output, the advantages and disadvantages of each learning model are balanced in order to obtain a better and more comprehensive model. In this method, when a wrong judgment occurs in one of the models, the wrong judgment can be corrected by the other models. Heterogeneous model ensemble learning not only achieves better generalization performance than a single learning model but also reduces the risk of falling into a local minimum by combining multiple individual models. In addition, during the training process, a single learning model can only learn a few important features, while the combination of different learning models can learn more important features (Chen et al., 2021).
The simple principle of heterogeneous model ensemble learning is shown in Figure 5, which includes three parts: data set, first-layer model, and second-layer model. Among them, the individual learning model in the first-layer model is trained independently. The results of these models are then processed as the final result based on some integration strategies.
3.2 Appearance Fault Diagnosis Method
Since appearance fault diagnosis is a classification task, the voting method is selected as a heterogeneous model ensemble strategy, and its mathematical expression is shown as follows:
where class(x) = 1 or −1, respectively, represent the two final recognition states of the input substation equipment image x by the integrated learning model. classifieri(x) represents the identification result of the individual learning model, with 1 or −1 states.
Since different models have different diagnosis veracities, the ensemble strategy based on the weighted voting method is adopted to improve the voting weight of the model with better diagnosis veracity and reduce the weight of the model with poor recognition ability. There are usually two methods for generating voting rights based on the accuracy index and F1 score index, as shown in Eqs 13 and 14, respectively.
where Ai is the recognition accuracy of the ith recognition model and Fi is the F1 score of the ith recognition model.
In addition, the ensemble strategy based on weighted voting is shown in Eq. 15:
where classifieri(x) represents the status of the transformer image x recognized by model i, and its value is 1 or −1. If the weighted sum of n single identification models is 0, the majority voting method will be adopted.
4 Evaluation Index
The performance of the substation equipment state identification method is evaluated by calculating the F1 score and the accuracy rate (accuracy), as shown in the following formulas:
where
In the above equations, FTP indicates the number of images that are positive samples and are predicted to be positive samples, FFN indicates the number of images that are positive samples but are predicted to be negative samples, FFP indicates the number of images that are negative but are predicted to be positive, and FTN indicates the number of images that are negative samples and are predicted to be negative samples.
5 Simulation
In this article, experiments are conducted on a computer equipped with AMDRyzen73700X8-CoreCPU and NVIDIAGeForceRTX2060GPU, Windows 10, and the program running environment is TensorFlow1.13.1 and Python3.7.7. The hyperparameter settings of the various models in this study are as follows: the GoogLeNet v1 learning rate is set to 0.01, the learning rate decay rate to 0.96, the batch size to 32, the momentum to 0.9, and the weight decay rate to 0.0002. The learning rate of BP is set to 0.001 and the batch size to 100. The penalty coefficient C of the python version of SVM is set to 1.0, the radial basis function (rbf) is selected as the kernel function, and the gamma parameter is 0. The LeNet-5 learning rate is set to 0.8, the learning rate decay rate to 0.99, and the batch size to 32.
5.1 Synthetic Samples and Analysis of Results
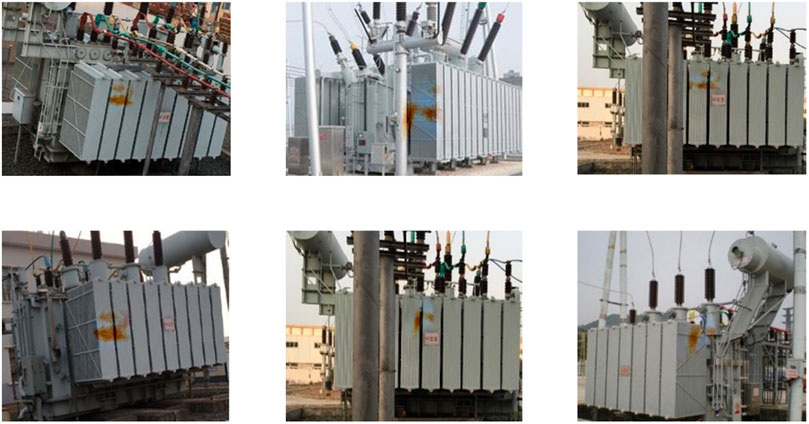
As shown in Figure 6, it is the transformer appearance defect image that is generated based on the method proposed in this study. As shown in the figure, the method is able to expand the transformer appearance defect sample data set by seamless cloning rust textures in the transformer. The 500 images generated based on this method are evaluated for quality screening and quality statistics are shown in Table 1 . The low-quality images accounted for 30%, which shows that the rust texture appeared outside the transformer body, such as the sky and other backgrounds, and are unrealistic; the rust texture in some generated images is poorly integrated with the transformer. The high-quality images account for about 70%, and the images in this part are more realistic.
5.2 Diagnostic Results of Different Sample Proportions
The experiment uses the F1 score and the accuracy rate to judge the diagnosis results. In this section, by comparing the influence of the positive and negative sample ratios of different experiments on the diagnosis results, the appropriate ratio of positive and negative samples of the transformer is selected for the simulation experiment.
The transformer rust samples used in this section are 100, and the normal samples are 100, 200, 300, 400, and 500, respectively. This section is based on GoogLeNet (Szegedy et al., 2015) for training and testing, and the test set includes 100 rust images and 100 normal images. The test results are shown in Table 2. It can be seen that, in the test results, when the proportion of normal samples of the transformer increases, the F1 score and the accuracy rate increase. When the ratio is 1:3, there is a better effect. After that, with the increase of normal samples, the F1 score and accuracy rate decreased because there are too many normal samples in the training set, causing the model to over-learn the features of normal samples.
5.3 Feasibility Analysis of the Augmented Sample Training Model
As the experimental data set of this study, 600 transformer images were collected in a certain area. Among them, there are 200 rusted transformer images and 400 normal images. Also, 100 rust images and 100 normal images are used as the test set A. To study the feasibility of expanding the training set, in this study, the recognition results are compared based on the GoogLeNet, LeNet-5 (Lecun et al., 1998), and SVM (Cortes and Vapnik, 1995; Henz et al., 2015) model using the data set before and after the expansion. Training set A contains 100 rust images and 100 normal images were collected. The training set B contains 100 rusted images obtained based on the sample generation method in this study, and 100 normal images were collected. By merging training sets A and B, we get training set C. The trained model is tested on the same test set. The results are shown in Table 3. The three models of GoogLeNet, LeNet-5, and SVM (support vector machine) are trained using the three data sets A, B, and C, respectively, and then the transformer appearance fault diagnosis is performed based on test A. It can be seen that by adding the generated transformer fault images to the training samples, the diagnostic accuracy of all three models is improved. The results show that the images generated based on the method proposed in this study can effectively improve the accuracy of the appearance fault diagnosis model.
5.4 Validity Analysis of Image Quality Assessment Screening
Among the collected images, there are indistinct and blurred images of the main body of the transformer. In some generated images, the rust texture appears outside the transformer body, which is not realistic. These low-quality images require recognition cleaning. The training sets A, B, and C are, respectively, cleaned by the image quality evaluation and screening method proposed in this study, and the results are used as training sets D, E, and F. It is also based on the GoogLeNet (Szegedy et al., 2016), LeNet-5, and SVM model for training and testing. The test set is also test A. The results are shown in Table 3. Since the images in the training set A have been manually quality screened during the collection process, no low-quality images are detected after screening using the method proposed in this study. Therefore, the three models trained based on the training set D have no change in the diagnostic accuracy on the test set A compared to the previous ones. In addition, after data cleaning, the diagnostic accuracy of the models trained based on the other two data sets has been improved, which proves that the image quality assessment and the screening method proposed in this study have a good effect.
5.5 Heterogeneous Model Ensemble Validity Analysis
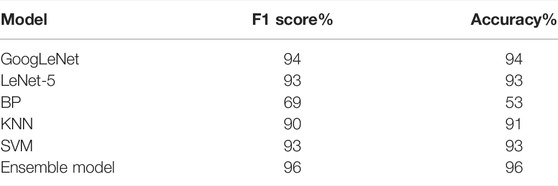
This study selects GoogLeNet, LeNet-5, BP (Back propagation), KNN (K-NearestNeighbor) (Hastie and Tibshirani, 1996), and SVM in the first layer of the heterogeneous model ensemble. After training the first-layer diagnostic models one by one using the training set F, the transformer images in the test set are diagnosed, and the recognition results of the six types of models are combined as the input of the second-layer recognition model. The diagnostic performance of a single model has an important impact on the performance of the model obtained by the final ensemble. Therefore, based on the diagnostic ability of a single model, in the second-layer model, the model with a recognition accuracy rate lower than 85% is deleted. The results are shown in Table 4. Compared with the single model, the ensemble model has higher appearance fault diagnosis accuracy.
6 Conclusion
The safe and stable operation of transformers is an important prerequisite for the safe operation of prosumer communities. Accurate fault monitoring and status identification of transformers can ensure the normal operation and economic benefits of prosumer communities. An intelligent inspection based on artificial intelligence algorithms can not only avoid the difficult working environment of manual inspection but also improve the efficiency of the inspection. This study presents an appearance fault diagnosis of the transformer method based on data set optimization and heterogeneous model ensemble and the following conclusions are obtained:
1) When the samples are insufficient, generating samples with the help of image seamless fusion technology can effectively improve the performance of the image diagnosis model.
2) The image cleaning method based on image quality assessment can identify and delete low-quality images in the data set that are not conducive to the diagnosis task, ensure the accuracy of the information obtained by the diagnosis model, and improve the performance of the diagnosis model.
3) The heterogeneous model ensemble algorithm can overcome the limitations of a single diagnostic model, balance the diagnostic results of each model, and improve the accuracy of the final diagnostic results.
Data Availability Statement
The raw data supporting the conclusions of this article will be made available by the authors, without undue reservation.
Author Contributions
The individual contributions of the authors are as follows: data curation, YX, and LF; formal analysis, YT and ZS; methodology, RH and JJ; supervision, YC and YL; writing (original draft), JH. All authors have read and agreed to the published version of the manuscript.
Funding
This study received funding from the Science and Technology Project of State Grid Zhejiang Electric Power Co., Ltd. (5211HZ190151). The funder was not involved in the study design, collection, analysis, interpretation of data, the writing of this article, or the decision to submit it for publication.
Conflict of Interest
Authors YX, LF, YT, ZS, RH, JJ, YC, YL, and JH are employed by the State Grid Zhejiang Electric Power Co., Ltd. Hangzhou Power Supply Company.
Publisher’s Note
All claims expressed in this article are solely those of the authors and do not necessarily represent those of their affiliated organizations, or those of the publisher, the editors and the reviewers. Any product that may be evaluated in this article, or claim that may be made by its manufacturer, is not guaranteed or endorsed by the publisher.
References
Chen, G., Li, D., and Chen, X. (2021). Low False Alarm Rate Detection Method Based on Improved XGBoost Model[J]. Power Syst. Prot. Control 49 (23), 178–186. doi:10.19783/j.cnki.pspc.210094
Cortes, C., and Vapnik, V. (1995). Support-vector Networks. Mach. Learn 20, 273–297. doi:10.1007/bf00994018
Damisa, U., and Nwulu, N. I. (2019). “Effect of Uncertainty on the Operation of DC Prosumer Microgrids Incorporating Dispatchable Loads,” in IEEE 7th International Conference on Smart Energy Grid Engineering (SEGE), Oshawa, ON, Canada, 12-14 Aug. 2019 (IEEE), 73–76. doi:10.1109/SEGE.2019.8859739
Dwibedi, D., Misra, I., and Hebert, M. (2017). “Cut, Paste and Learn: Surprisingly Easy Synthesis for Instance Detection,” in 2017 IEEE International Conference on Computer Vision (ICCV), Venice, Italy, 22-29 Oct. 2017 (IEEE), 1310–1319. doi:10.1109/ICCV.2017.146
Golightly, I., and Jones, D. (2003). Corner Detection and Matching for Visual Tracking during Power Line Inspection. Image Vis. Comput. 21 (9), 827–840. doi:10.1016/s0262-8856(03)00097-0
Goodfellow, I., Pouget-Abadie, J., and Mirza, M. (2020). Generative Adversarial Networks. Commun. ACM 63, 139–144. doi:10.1145/3422622
Gupta, A., Vedaldi, A., and Zisserman, A. (2016). “Synthetic Data for Text Localisation in Natural Images,” in 2016 IEEE Conference on Computer Vision and Pattern Recognition (CVPR), Las Vegas, NV, USA, 27-30 June 2016 (IEEE), 2315–2324. doi:10.1109/CVPR.2016.254
Hastie, T., and Tibshirani, R. (1996). Discriminant Adaptive Nearest Neighbor Classification. IEEE Trans. Pattern Anal. Mach. Intell. 18 (6), 607–616. doi:10.1109/34.506411
Henz, B., Limberger, F. A., and Oliveira, M. M. (2015). “Color Adjustment for Seamless Cloning Based on Laplacian-Membrane Modulation,” in 2015 28th SIBGRAPI Conference on Graphics, Patterns and Images, Salvador, Brazil, 26-29 Aug. 2015 (IEEE), 196–202. doi:10.1109/SIBGRAPI.2015.9
Ishino, R., and Tsutsumi, F. (2004). “Detection System of Damaged Cables Using Video Obtained from an Aerial Inspection of Transmission Lines,” in IEEE Power Engineering Society General Meeting, Denver, CO, USA, 6-10 June 2004 (IEEE), 1857–1862. doi:10.1109/PES.2004.1373201
Jiao, S., and Wang, H. (2016). “The Research of Transmission Line Foreign Body Detection Based on Motion Compensation,” in 2016 First International Conference on Multimedia and Image Processing (ICMIP), Bandar Seri Begawan, Brunei, 1-3 June 2016 (IEEE), 10–14. doi:10.1109/ICMIP.2016.14
Lecun, Y., Bottou, L., Bengio, Y., and Haffner, P. (1998). Gradient-based Learning Applied to Document Recognition. Proc. IEEE 86 (11), 2278–2324. doi:10.1109/5.726791
Li, Y., Song, Y., Jia, L., Gao, S., Li, Q., and Qiu, M. (2020). Intelligent Fault Diagnosis by Fusing Domain Adversarial Training and Maximum Mean Discrepancy via Ensemble Learning[J]. IEEE Trans. Industrial Inf. 17 (4), 2833–3284. doi:10.1109/TII.2020.3008010
Liang, X., Luo, R., Dang, S., Zhou, J., and Yang, G. (2022). Research on the Identification Method of Foreign Objects in Power Lines Based on Digital Image Processing [J]. Electr. Technol. 23 (02), 73–78. doi:10.3969/j.issn.1673-3800.2022.02.013
Liu, Z., Zhang, M., Liu, F., and Zhang, B. (2021). Multidimensional Feature Fusion and Ensemble Learning-Based Fault Diagnosis for the Braking System of Heavy-Haul Train. IEEE Trans. Ind. Inf. 17 (1), 41–51. doi:10.1109/tii.2020.2979467
Lu, L., Ichimura, S., Moriyama, T., Yamagishi, A., and Rokunohe, T. (2017). A System to Detect Small Amounts of Oil Leakage with Oil Visualization for Transformers Using Fluorescence Recognition. IEEE Trans. Dielect. Electr. Insul. 24 (2), 1249–1255. doi:10.1109/TDEI.2017.006110
Melgani, F., and Bruzzone, L. (2004). Classification of Hyperspectral Remote Sensing Images with Support Vector Machines. IEEE Trans. Geosci. Remote Sens. 42 (8), 1778–1790. doi:10.1109/TGRS.2004.831865
Pérez, P., Gangnet, M., and Blake, A. (2003). Poisson Image Editing. ACM Trans. Graph. 22 (3), 313–318. doi:10.1145/882262.882269
Rathnayaka, A. J. D., Potdar, V. M., Hussain, O., and Dillon, T. (2011). “Identifying Prosumer's Energy Sharing Behaviours for Forming Optimal Prosumer-Communities,” in International Conference on Cloud and Service Computing, Hong Kong, China, 12-14 Dec.2011 (IEEE), 199–206. doi:10.1109/CSC.2011.6138520
Shi, J., and Zhang, J. (2019). Load Forecasting Method Based on Multi-Model Fusion Stacking Ensemble Learning Method [J]. Chin. J. Electr. Eng. 39 (14), 4032–4042. doi:10.13334/j.0258-8013.pcsee.181510
Szegedy, C., Vanhoucke, V., Ioffe, S., Shlens, J., and Wojna, Z. (2016). “Rethinking the Inception Architecture for Computer Vision,” in 2016 IEEE Conference on Computer Vision and Pattern Recognition (CVPR), Las Vegas, NV, USA, 27-30 June 2016 (IEEE), 2818–2826. doi:10.1109/CVPR.2016.308
Szegedy, C., Liu, W., Jia, Y., Sermanet, P., Reed, S., Anguelov, D., et al. (2015). “Going Deeper with Convolutions,” in 2015 IEEE Conference on Computer Vision and Pattern Recognition (CVPR), Boston, MA, 7-12 June 2015 (IEEE), 1–9. doi:10.1109/CVPR.2015.7298594
Wang, W., Zhang, J., Han, J., Liu, L., and Zhu, M. (2015). Broken Strand and Foreign Body Fault Detection Method for Power Transmission Line Based on Unmanned Aerial Vehicle Image [J]. J. Comput. Appl. 35 (8), 2404–2408. doi:10.11772/j.issn.1001-9081.2015.08.2404
Wu, Y., Liu, L., Shi, C., Ma, K., Li, Y., and Mu, H. (2019). “Research on Measurement Technology of Transformer No-Load Loss Based on Internet of Things,” in IEEE 8th International Conference on Advanced Power System Automation and Protection (APAP), Xi'an, China, 21-24 Oct. 2019 (IEEE), 150–153. doi:10.1109/APAP47170.2019.9224961
Xi, L., Chen, J., Huang, Y., Xu, Y., Liu, L., Zhou, Y., et al. (2018). Smart Generation Control Based on Multi-Agent Reinforcement Learning with the Idea of the Time Tunnel. Energy 153, 977–987. doi:10.1016/j.energy.2018.04.042
Xi, L., Zhang, L., Xu, Y., Wang, S., and Yang, C. (2020). Automatic Generation Control Based on Multiple-step Greedy Attribute and Multiple-Level Allocation Strategy. Csee Jpes 8 (1), 281–292. doi:10.17775/CSEEJPES.2020.02650
Zhang, K., Zhou, B., Or, S. W., Li, C., Chung, C. Y., and Voropai, N. (2021). Optimal Coordinated Control of Multi-Renewable-To-Hydrogen Production System for Hydrogen Fueling Stations. IEEE Trans. Ind. Appl. 58, 2728–2739. doi:10.1109/TIA.2021.3093841
Keywords: prosumer, intelligent inspection, sample generation, image quality evaluation, heterogeneous model ensemble
Citation: Xuan Y, Fan L, Tu Y, Sun Z, Han R, Jiang J, Chen Y, Lai Y and Huang J (2022) Appearance Fault Diagnosis of a Transformer Based on Data Set Optimization and Heterogeneous Model Ensemble. Front. Energy Res. 10:902892. doi: 10.3389/fenrg.2022.902892
Received: 23 March 2022; Accepted: 22 April 2022;
Published: 02 June 2022.
Edited by:
Bin Zhou, Hunan University, ChinaReviewed by:
Jieming Ma, Xi’an Jiaotong-Liverpool University, ChinaLei Xi, China Three Gorges University, China
Xu Xu, Hong Kong Polytechnic University, Hong Kong SAR, China
Zhekang Dong, Hangzhou Dianzi University, China
Copyright © 2022 Xuan, Fan, Tu, Sun, Han, Jiang, Chen, Lai and Huang. This is an open-access article distributed under the terms of the Creative Commons Attribution License (CC BY). The use, distribution or reproduction in other forums is permitted, provided the original author(s) and the copyright owner(s) are credited and that the original publication in this journal is cited, in accordance with accepted academic practice. No use, distribution or reproduction is permitted which does not comply with these terms.
*Correspondence: Yi Xuan, OTkxMDA2MzIxQHFxLmNvbQ==
 Yi Xuan
 Libo Fan
