- 1School of Electrical Engineering, Shanghai Dianji University, Shanghai, China
- 2Suzhou Future Electric Co., Ltd., Suzhou, China
In order to improve the accuracy of series arc fault detection and prevent fire accidents caused by series arc fault, a series arc fault simulation experiment circuit was built to obtain the low-frequency and high-frequency current waveform of series arc fault under different loads. The kurtosis, waveform factor, crest factor, pulse factor, and margin factor of low-frequency current waveform are extracted in the time domain. In the frequency domain, a method based on variational mode decomposition and energy entropy is proposed to extract the characteristic quantity of series arc faults. It was found that the energy entropy of the intrinsic mode function component with the largest variance contribution ratio will increase when a series of arc faults occur, and it was used as a characteristic quantity. Characteristic vectors were constructed based on time–frequency characteristic quantities, and the characteristic vector was trained based on the random forest algorithm to obtain the diagnosis model and analyze the series arc fault diagnosis. The analysis showed that the diagnostic accuracy of the model trained by the proposed method was above 97%, and the fault recognition effect was remarkable, which provides an important reference for the improvement of the series arc fault detection technology.
1 Introduction
According to the Fire Statistics Annual Report of China Fire Protection Association (CFPA) Shao (2020), the number of electrical fires in China has been on the rise in recent years, and the proportion of electrical fires ranks first among all types of fires, accounting for about 30%. Arc faults are one of the leading causes of electrical fires. In low-voltage distribution lines, series of arc faults may occur due to aging and damage of insulation of wires, poor connection of wires, or loose connection of electrical equipment (Xiong et al., 2016). A large amount of heat will be generated when the series of arc faults occurs in the line, which is easy to ignite combustible materials and lead to fire [Liu G. et al. (2017), Lin et al. (2021), Liu G. G. et al. (2017)]. In serious cases, explosions will occur, endangering personal safety. Therefore, in order to protect the safety of production and the safety of residents, effectively solving low-voltage series of arc faults has become a research hotspot for scholars at home and abroad.
The current series of arc fault detection technology has the problems of low detection ratio and ineffective identification under mixed loads. In the field of series arc fault detection and diagnosis, the detection methods for low-voltage series arc are mainly divided into two categories: 1) the arc is detected by the radiation, energy, and temperature changes of the arc. 2) Detect series arc faults by current and voltage waveform changes. Wang et al. (2019) and Xiong et al. (2017) used third-order and fourth-order Hilbert fractal antennas to detect electromagnetic radiation (EMR) signals generated by DC arcs. The experimental results show that EMR can be used as a characteristic quantity to characterize a series of arc faults. The Hilbert transform can parse the signal into an analytic signal containing the instantaneous frequency and amplitude, but the disadvantage is that the Hilbert transform is only suitable for part of the frequency band of the electromagnetic radiation signal, and the method is greatly affected by environmental factors, and the positioning range is limited. Lala and Subrata, (2020), Jiang et al. (2021), Chen et al. (2015), Jingjing and Zhihong (2019), Miao et al. (2019) and Liu et al. (2019) took the empirical mode decomposition (EMD) energy entropy as the characteristic quantity of series arc fault. Although good results are obtained, the EMD energy entropy is used as a characteristic quantity, and there are end-point effects and modal aliasing. The methods of arc fault detection using radiation, temperature, and energy have great limitations, so the mainstream research methods are still based on current and voltage waveforms for arc identification. In the article by Chen et al. (2019),Qi et al. (2017),Yu et al. (2020),Ma et al. (2021), Zhang et al. (2018), and Gao et al. (2021), the wavelet transform is used to decompose the current and voltage waveform, and the energy in different frequency bands, the maximum value of detail signal in each frequency band, and the low-frequency approximation coefficient of adjacent periodic current are calculated as the characteristic quantities of series arc faults. The wavelet transform is based on the Fourier transform to refine the signal at multiple scales, and at the same time overcomes the shortcomings such as the window does not change with the frequency during local refinement; however, the wavelet transform is not ideal for the situation where the frequency bands of the useful signal and the noise overlap each other, and the problem of spectral aliasing is prone to occur. Karakose et al. (2018) and Cui and Tong. (2021) used S-transform and generalized S-transform to detect pantograph–catenary system arc faults and aviation arc faults, respectively. The S-transform uses a Gaussian window function, and the window width is proportional to the inverse of the frequency and do not need to select window functions. The selection of the function improves the defect of fixed window width, but the feature quantity extracted by S-transform has the problem of insensitivity to noise. This method is inaccurate in the frequency domain resolution in the higher frequency range, and the resolution is lower than that of the Fourier transform. The series current is an electrical parameter that is easily obtained in the traditional distribution line protection system. The currents in the series loop are equal in magnitude. In principle, the arc detection device can be installed at any point in the loop, and the sampling position is not restricted by the position of the arc in the loop. However, when the load terminal voltage is used as the detection signal, the power terminal voltage and the load terminal voltage are likely to introduce harmonic interference, resulting in misjudgment. So most scholars abandon the voltage and use the current signal as the target quantity for feature extraction. In the article by Syafi’i et al. (2018),Zhang et al. (2016), Karakose et al. (2018), Khafidli et al. (2018) and Wang et al. (2017), characteristic quantities in the frequency domain are extracted by fast Fourier transform, and the amplitude of the harmonic component and the all-phase spectrum is taken as characteristic quantities. However, the disadvantage is that the amount of calculation is large, and the Fourier transform has defects in the analysis of non-stationary time-varying signals, extracting feature quantities in the time domain is good for fault arc diagnosis of a single load line but not very good for circuits with mixed loads. In the article by Lin et al. (2020) and Cui et al. (2021), the series arc fault current waveform is analyzed in the time domain, and the periodic amplitude, the correlation, and the continuity between adjacent periodic current samples, the zero-rest time of the current, and the zero-rest time proportional coefficient of the two periodic currents are calculated as the characteristic quantity. However, it is not good to extract characteristic quantities in the time domain for circuits with different load mixtures. EMD energy entropy as a characteristic quantity has a modal aliasing problem.
In view of the above shortcomings and considering the actual low-voltage series arc fault detection requirements and the realization of the method application in the protection device, this article proposes an arc fault detection method based on time–frequency feature fusion. The specific contributions are as follows:
1) Simulate the series arc fault of different load types and mixed load types, and extract the low-frequency and high-frequency current waveforms when the load is working normally and when the series arc fault occurs. Feature quantities are extracted for low-frequency current components in the time domain.
2) Aiming at the extraction of high-frequency current component features, a series of arc fault feature extraction method based on VMD and energy entropy is studied.
3) Use the random forest algorithm to train and diagnose the extracted feature quantities.
4) Optimize the random forest algorithm to train the diagnostic model to improve its recognition rate and correct rate.
This article is organized as follows: Section 2 conducts low-voltage series arc fault experiments, collects low-voltage AC current data, and performs waveform analysis; Section 3 introduces the extraction method of arc time-domain feature quantity and the feature extraction method based on VMD to extract energy entropy; in Section 4, we build a random forest algorithm training diagnosis model, propose an arc fault diagnosis algorithm, and conduct sum simulation verification; the final conclusions are summarized in Section 5.
2 Series Arc Fault Simulation Experiment
2.1 Experimental Environment
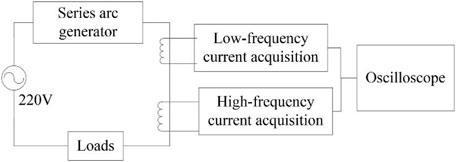
It is difficult to obtain the current waveform of series arc faults from actual distribution wires because of the uncertainty of the occurrence time and location of series arc faults. This article sets up a series of arc fault simulation experiment environments, which are composed of a power supply, series arc generator, signal acquisition module, and loads inspection (General Administration of Quality Supervision, 2014). The schematic diagram of the series arc fault simulation experiment is shown in Figure 1.
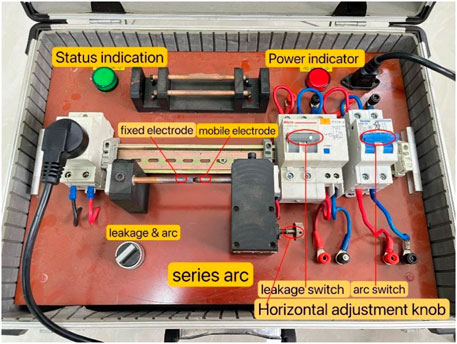
In this article, an arc generator is chosen to simulate the generation of arc faults. The series of arc generator is mainly composed of two electrodes. One electrode which is regarded as a mobile electrode is a carbon-graphite rod with a diameter of 6 ± 0.5 mm. The arc burning end of the electrode is made into a tip and equipped with a sliding block. The clearance between the two electrodes can be controlled by adjusting the horizontal adjusting knob. The other can be a 6 ± 0.5-mm-diameter copper rod set as a fixed electrode. The arc ends of both electrodes should be kept clean to allow for repeatability of arcing. The two electrodes are connected in series by wire, with one end connected to a load and the other to the power supply. A stable arc can be formed by adjusting the horizontal adjustment knob so that the two electrodes are separated at proper distances. The schematic diagram of the device is shown in Figure 2. The physical map is shown in Figure 3.
The signal acquisition module is composed of a current transformer and a filter amplifying circuit and is responsible for collecting arc current signals. The current is converted into a voltage signal through a current transformer and a sampling resistor, then filtered and amplified by the circuit, and finally, the current signal is sampled using an oscilloscope. For the acquisition of the current signal, the low-frequency and high-frequency mutual inductors are used to collect the low-frequency and high-frequency current waveforms, respectively. The low-frequency mutual inductor collects the low-frequency current and outputs the low-frequency current component signal through the low-pass filtering and amplifying circuit. The low-pass filtering circuit consists of an RC low-pass filter. The cut-off frequency is configured according to 1/2πRC to about 1 kHz. The high-frequency mutual inductor collects the high-frequency current and outputs the high-frequency current component signal through the high-pass filtering and amplifying circuit. The high-pass filtering circuit consists of an RC high-pass filter, and the cut-off frequency is configured to be about 1 kHz.
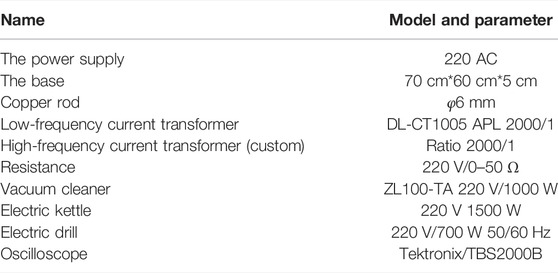
According to GB/T31143-2014 “General Requirements for Series Arc Fault Detection Device (AFDD)" issued by the General Administration of Quality Supervision, Inspection and Quarantine of the People’s Republic of China in 2014, it is stipulated that AFDD must meet the inhibitory load shielding test. Seven shielded loads are specified in the standard; they are vacuum cleaners, switching power supplies, motor loads with capacitive start (such as vacuum cleaners and compressors), electronic light regulators, resistive loads, electric drill loads, and halogen lamps. Therefore, resistance, electric kettle, electric drill, and vacuum cleaner are taken as the loads. The main hardware configuration required for the experiment is shown in Table 1.
2.2 Experimental Process
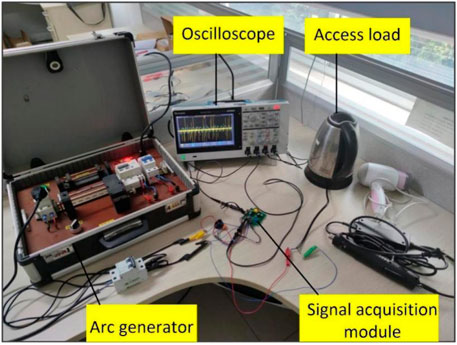
Experiments were carried out at room temperature, the power supply is connected to the arc generator through the isolated power supply, the other end of the arc generator is connected to the load, and the wire of the load end passes through the mutual inductor. The current signal enters the signal acquisition module through the sampling resistor, and the output end of the signal acquisition module is connected to the oscilloscope. The waveform displayed by the oscilloscope is the voltage value, which actually reflects the current waveform in the line. The field diagram of the series arc fault simulation experiment is shown in Figure 4.
The horizontal adjustment knob of the arc generator is adjusted to control the generation of the arc. The sampling frequency of the oscilloscope is set at 62.5 kHz, and the sampling time of each group of waveforms is 320 ms, with a total of 16 cycles. The experiment obtains the low-frequency and high-frequency current waveforms of resistors, electric kettles, electric drills, and vacuum cleaners during normal operation and arc faults, as well as the current waveforms of switching power supplies and electric drills at the moment of startup. For the convenience of subsequent data analysis, the collected data are normalized in MATLAB. Figures 5–8 show the low-frequency and high-frequency arc current waveform of four cycles under different loads.
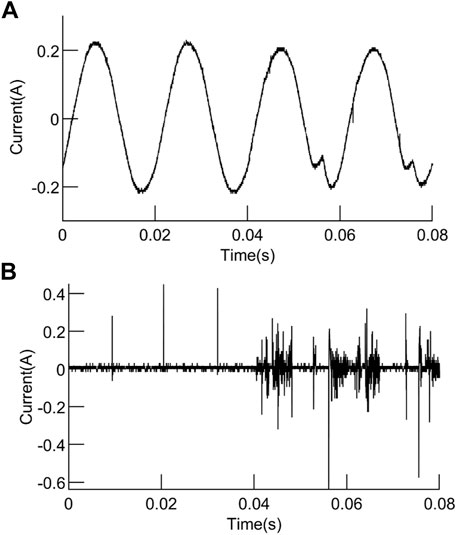
FIGURE 5. Current waveform of the electric kettle: (A) low-frequency waveform. (B) High-frequency waveform.

FIGURE 6. Current waveform of the resistance: (A) low-frequency waveform. (B) High-frequency waveform.
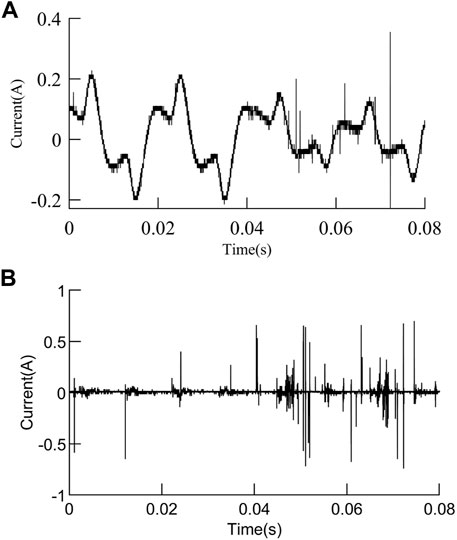
FIGURE 7. Current waveform of the vacuum cleaner: (A) low-frequency waveform. (B) High-frequency waveform.
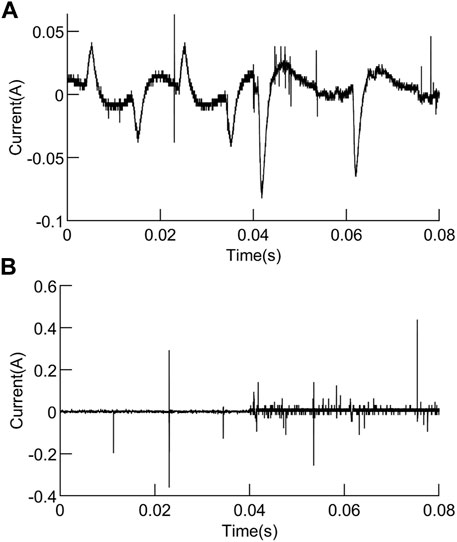
FIGURE 8. Current waveform of the electric drill: (A) low-frequency waveform. (B) High-frequency waveform.
At 0.04 s, the series arc generator simulates the occurrence of series arc faults, that is, the waveform of the first two cycles is in a normal working state, and the series arc faults occur in the last two cycles. It can be seen from the waveform figure that when the electric kettle and resistance work normally, the low-frequency current waveform is a sine wave of 50 Hz, and the high-frequency current signal waveform has a small number of high-frequency pulses. When a series of arc faults occurs, the low-frequency waveform appears and has burrs at the peak, while the high-frequency waveform changes obviously and there are a large number of high-frequency pulses. When the electric drill and vacuum cleaner work normally, the low-frequency current waveform has the “flat shoulder,” which is similar to the low-frequency waveform when the series arc fault occurs between the electric kettle and the resistance. At the same time, the high-frequency current signal waveform also has a small number of high-frequency pulses. When a series of arc faults occurs, the low-frequency waveform changes dramatically, burrs increase, waveform amplitude decreases, waveform distortion is serious, the high-frequency waveform amplitude increases, and there are a large number of high-frequency pulses.
3 Characteristic Extraction of Series Arc Faults
3.1 Analysis of Time Domain Characteristics of Series Arc Faults
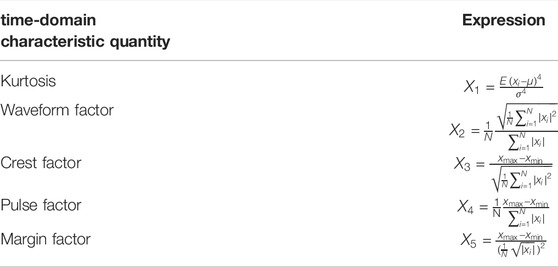
Time domain characteristics refer to the description of signal waveform with time as a variable, which is an important indicator to measure signal characteristics. Characteristic quantities in the time domain are usually divided into dimensionless and dimensional characteristic quantities. Dimensionless characteristics are not sensitive to the change of load and can more intuitively represent the status information of normal operation and fault of load. Kurtosis is often used in the field of bearing fault diagnosis. It has nothing to do with bearing speed and size, etc. It is sensitive to impact signals and is suitable for the description of surface damage faults. It can be seen from the arc fault current waveform diagram in Figures 3–6 that the current waveform will be distorted and high-frequency pulses will appear when an arc fault occurs. These signals are similar to impulse signals. Therefore, this article uses kurtosis as a waveform time domain feature to calculate. The waveform factor is the ratio of the effective value to the rectified average value. When an arc fault occurs, the waveform of the low-frequency current component will be distorted, the periodicity will be destroyed, and both the effective value and the rectified average value will change, so its shape factor can be calculated. The crest factor is defined as the ratio of the peak-to-peak value to the effective value of a signal. When an arc fault occurs, the low-frequency current component will appear “burr,” and its peak-to-peak value will become larger, so the arc fault can be described by calculating the change in the value of the crest factor. The impulse factor refers to the ratio of the peak value of the signal to the rectified average value. Similar to the crest factor, arc faults can also be described by the pulse factor. The margin factor is the ratio of the peak value of the signal to the rms amplitude. Crest factor, impulse factor, and margin factor, like kurtosis, are all indicators used to detect whether there is a shock in a signal. In this article, kurtosis, waveform factor, crest factor, pulse factor, and margin factor are selected as five dimensionless indexes for time domain characteristic extraction. Low-frequency current waveform of two cycles, i.e., 20 ms, and 2,500 points of sampling points N were selected as an analysis sample. Kurtosis, waveform factor, crest factor, pulse factor, and margin factor of low-frequency current waveform were calculated in the time domain, and the five characteristic quantities were marked as X1, X2, X3, X4, and X5 in turn. The expression of each time domain characteristic quantity is shown in Table 2.
In Table 2,
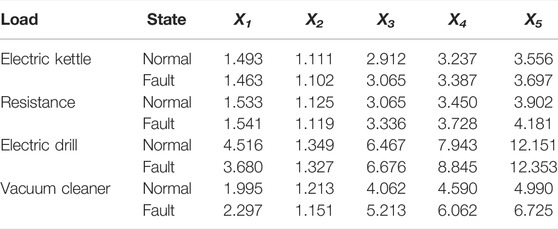
It can be seen from Table 2 that the crest factor, pulse factor, and margin factor of each load increase when a series of arc faults occurs compared with normal operation. The value of the waveform factor decreases when a series of arc faults occurs. For kurtosis, the values of electric kettles and electric drills will decrease in the event of a series of arc faults, and the values of resistance and vacuum cleaners will increase. Under the condition of a single load, the threshold value can be set to determine whether the series of arc faults occurs. But in the actual line, load condition cannot be determined in advance, and threshold setting will be difficult. It can be seen that the high-frequency current waveform changes dramatically when series arc faults occur, and more series arc fault characteristics can be obtained in the high-frequency waveform, so it is necessary to analyze the high-frequency current waveform.
3.2 Analysis of Frequency Domain Characteristics of Series Arc Faults
It is impossible to calculate the characteristic values of the high-frequency current waveform in the time domain because the waveform of the high-frequency current waveform is very drastic. Therefore, characteristic extraction is carried out in the frequency domain.
VMD is a novel adaptive and completely non-recursive signal analysis method provided by Dragomiretskiy and Zosso. (2014) for EMD’s sensitivity to noise and signal sampling. To establish and solve the variational problem as the core, based on the classical Wiener filter, Hilbert transform and mixes as the basis of expansion solution, intrinsic mode function, and their respective central frequencies are obtained through each intrinsic mode function to reconstruct the signal. The reconstructed signal can smoothly reproduce the input signal. VMD is the sum of the input signal f(t) decomposed into K sub-signals (i.e., IMF components) and the remainder:
where uk(t) is the kth IMF component, and ur(t) is the remainder.
The IMF component is a function of amplitude and frequency modulation:
where φk(t) is a non-decreasing function, that is, φ′k(t)≥0,k ≤ K; Ak(t) represents the envelope Ak(t) ≥ 0; k ≤ K.
The VMD algorithm requires the bandwidth and minimum of all IMF components. The solution of the constrained variational problem is constructed as follows:
where ωk is the central frequency of the kth IMF component, ωk = φ′k(t); δ(t) is the Dirac function.
In Formula (3), quadratic penalty term and Lagrange multiplier are introduced to solve the variational problem, making it unconstrained. The augmented Lagrange function is obtained as follows:
where λ(t) is the Lagrange multiplier and α is the penalty factor.
The detailed iterative solution steps of modal components uk(t), central frequency ωk, and λk(t) in Formula (4) can be referred to as the solution steps in the article by Dragomiretskiy K and Zosso D (2014). According to the aforementioned principle, the VMD algorithm is used in MATLAB for waveform decomposition. According to the study of K and α in an article by Ma et al. (2020), the number of decomposition and the penalty factors were set at K = 4 and α = 2000, respectively. Other parameters in the VMD algorithm are set as the default values of the algorithm in an article by Liu et al. (2021). The high-frequency current waveform is taken as an example when an electric kettle works normally and a series of arc faults occurs. For the convenience of analysis, the waveform data were normalized, and then VMD decomposition was carried out to obtain four IMF components, and the corresponding spectrum of each component was obtained by Fast Fourier Transformation in MATLAB. The decomposition results are shown in Figures 9–11. At the same time, the EMD algorithm was used for the same series arc fault waveform to obtain each IMF component and its spectrum after decomposition, as shown in Figure 12.
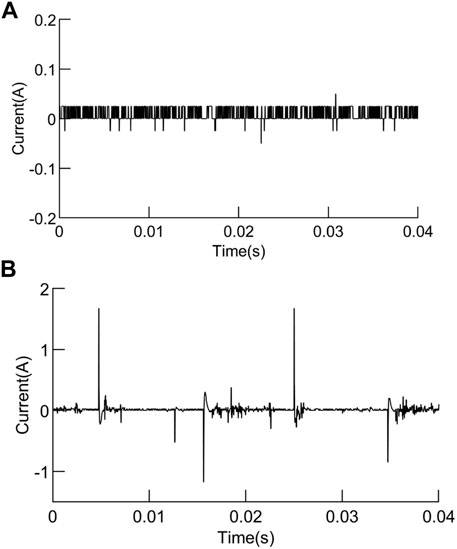
FIGURE 9. High-frequency current component of the electric kettle: (A) normal. (B) Series arc fault.

FIGURE 10. (Continued). VMD decomposition results of normal high-frequency current waveform: (A) IMF1 component. (B) Spectrum of IMF1. (C) IMF2 component. (D) Spectrum of IMF2. (E) IMF3 component. (F) Spectrum of IMF3. (G) IMF4 component. (H) Spectrum of IMF4.

FIGURE 11. (Continued). VMD decomposition results of high-frequency current components of series arc fault: (A) IMF1 component. (B) Spectrum of IMF1. (C) IMF2 component. (D) Spectrum of IMF2. (E) IMF3 component. (F) Spectrum of IMF3. (G) IMF4 component. (H) Spectrum of IMF4.
Figure 9 shows the original current waveform when the electric kettle is in normal operation and series arc fault occurs; Figure 10 shows the decomposition result of VMD algorithm when the electric kettle is in normal operation; Figures 11, 12, respectively, show the decomposition result of VMD and EMD algorithms of the same high-frequency component of the series arc fault. As can be seen from Figure 12, the EMD algorithm decomposes the high-frequency signal into nine components, and the IMF1–9 components are arranged according to the central frequency from large to small. Among them, both IMF1 and IMF2 appear in the frequency band around 5 kHz, with an over-decomposition phenomenon. The center frequency distribution of the IMF2 component is not obvious, including the frequency band [5000 Hz and 10000 Hz], and there is the phenomenon of mode aliasing. In addition, it can be seen from the amplitude–frequency diagram of IMF5–9 components that the component is lower than 1kHz, which is due to the frequency band attenuation of the RC high-pass filter, but it is not needed for the high-frequency component analysis in this article. It can be seen from Figure 11 that the high-frequency current component is decomposed into four IMF components by the VMD algorithm, which are independent of each other without modal aliasing, and the decomposition effect is significantly better than that of the EMD algorithm. The center frequency of each IMF based on the VMD algorithm is shown in Table 4.
Energy entropy can measure the regularity of time series and the energy characteristics of signals in different frequency bands (Jin et al., 2021). When the series arc fault occurs, the current will change and the energy will also change. The energy entropy of mth IMF component is calculated as:
where xm(i) is the value of the ith point of the mth IMF component, m = 1,2,3, … ,K.
where varm is the variance of mth IMF component, m = 1,2,3, … , K and varr is the variance of the remainder.
The energy entropy and variance contribution ratio of each IMF in Figures 8, 9 were calculated according to the aforementioned formula. Table 5 shows the calculation results.
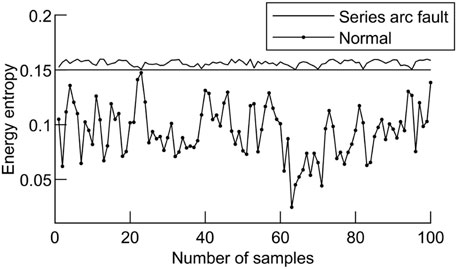
It can be seen from Tables 4, 5 that the IMF1 component has a center frequency of less than 1 kHz, which is due to the frequency band attenuation of the high-pass filter, but it is not needed for the high-frequency waveform analysis in this article. The frequency of the high-frequency current waveform in this article is set above 1 kHz, so only the IMF component larger than 1 kHz needs to be studied. When the center frequency of the IMF component is greater than 1KHZ, the IMF2 variance contribution rate of the normal operating current is the largest, and the energy entropy is 0.122. When a series of arc faults occur, the variance contribution ratio of IMF1 is the largest, and the energy entropy is 0.155, which increases obviously. The corresponding energy entropy of IMF with the largest variance contribution ratio was calculated for 100 groups of normal working and 100 groups of series arc fault samples, as shown in Figure 13.
As can be seen from Figure 11, the corresponding energy entropy of IMF with the largest variance contribution ratio in normal operation is less than 0.15, and the corresponding energy entropy of IMF with the largest variance contribution ratio in series arc fault is greater than 0.15. Therefore, the energy entropy corresponding to IMF with the largest variance contribution ratio can be taken as a characteristic value and denoted as X6.
4 Series Arc Fault Diagnosis
4.1 Construction of a Series Arc Fault Characteristic Vector
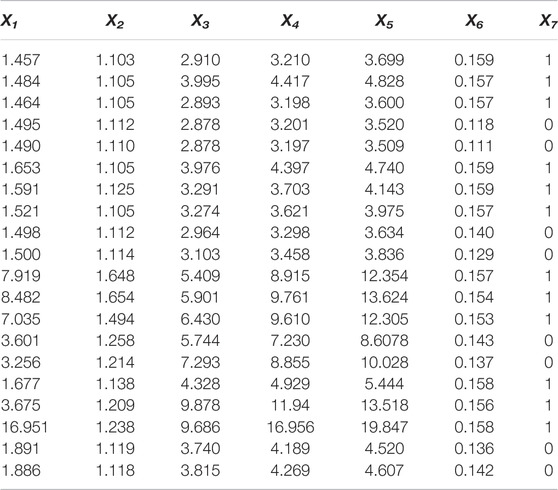
In order to improve the diagnosis ratio of series arc fault and realize the diagnosis under different load conditions, the load working state is marked as X7, “0” means normal operation, “1” means series arc fault, and the series arc fault characteristic vector is constructed with the six time–frequency characteristic quantities in this article. The characteristic vectors of some experimental samples are shown in Table 6.
4.2 Series Arc Fault Diagnosis Based on Random Forest
Random forest algorithm is an algorithm that integrates multiple decision trees through the idea of ensemble learning (Li et al., 2020). Its basic unit is the decision tree. In this article, the decision tree algorithm selects CART [Jiang et al. (2021), Ali et al. (2012)], and the Gini coefficient minimization criterion is used for characteristic selection in CART. The series arc fault diagnosis flow chart based on random forest algorithm is shown in Figure 14:
In this article, 1000 training samples were selected with 250 for each load, including 100 normal samples and 150 series of arc fault samples. Characteristic quantities n = 6. The number of decision trees is T = 100. The diagnosis model was trained, and the untrained load samples were tested. Figures 15A–F shows the diagnostic results of different types of loads based on the random forest algorithm. From Figures 15A–F, the information shown in Table 7 can be obtained. The random forest algorithm has ideal fault diagnosis effects and high diagnosis accuracy for electric kettles, hair dryers, electric drills, switching power supplies, and vacuum cleaners.
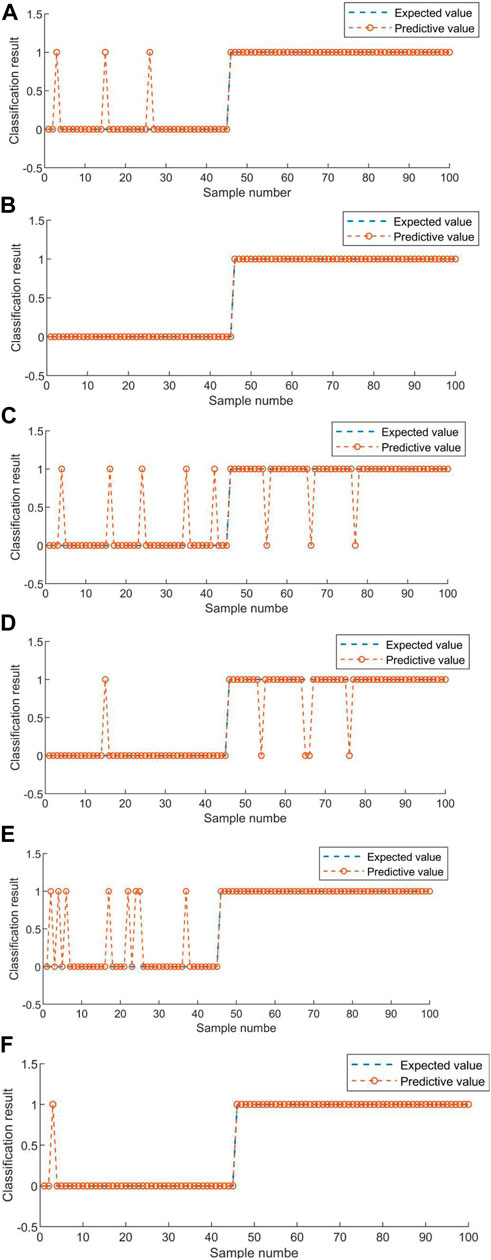
FIGURE 15. Diagnostic results of different types of loads based on random forest algorithm. (A) Effect of random forest algorithm on electric kettle arc fault diagnosis. (B) Effect of random forest algorithm on resistance arc fault diagnosis. (C) Effect of random forest algorithm on electric drill arc fault diagnosis. (D) Effect of random forest algorithm on switching power supply arc fault diagnosis. (E) Effect of random forest algorithm on vacuum cleaner arc fault diagnosis. (F) Effect of random forest algorithm on hair dryer arc fault diagnosis.
It can be seen from Table 7 that in the series arc fault detection model based on random forest, the accuracy ratio of load detection under a normal working state is higher than 96%. The fault detection accuracy of load in a series arc fault state is higher than 96%. The comprehensive detection ratio was above 97%. The detection effect is very good.
In the actual distribution lines, the loads are varied and mixed. In order to verify the validity of the aforementioned diagnostic model, series arc fault simulation experiments of switching power supply, hair dryer, and mixed load are added in this article. Switching power supply parameters: BSD-36 P-60 W, input 220 VAC 50 Hz, and output 36 VDC 60 W. Hair dryer parameters: 220 VAC 1600 W. According to the time domain and frequency domain characteristic extraction methods proposed in this article, the time–frequency characteristic values are extracted, the characteristic vector is constructed, and a new load training sample diagnosis model is added based on the random forest algorithm training, and then the fault diagnosis is carried out. The diagnosis results are shown in Table 8.
As can be seen from Table 8, in the diagnosis of the new loads and mixed load types, the accuracy of the original diagnosis model decreases to 94.91% and 91.13%, respectively, and the detection effect is lower than that of the original four loads. Therefore, new loads and mixed loads were added to the original training samples to optimize the diagnostic model. The results in Table 8 show that the recognition efficiency of the new diagnostic model has reached more than 97%, and the recognition effect is significant. For more load cases, new training samples can be added to improve the diagnosis model for diagnosis.
5 Conclusion
Aiming at the problem of low-voltage series arc faults that are difficult to identify and cause great harm, this article proposes a series of arc fault feature extraction method based on VMD and energy entropy. First, a series arc fault simulation experimental circuit is built, and the series of arc fault current waveform data under different loads are obtained, and the arc characteristic quantity is extracted by VMD decomposition and Fourier transform. Then, the random forest algorithm model for training is established, and the random forest algorithm is used to train the diagnostic model to identify arc faults. Finally, the feasibility of the method is verified by MATLAB simulation, and the conclusions of this article are as follows:
1) The energy entropy corresponding to the IMF component with the largest variance contribution rate extracted based on VMD decomposition can effectively characterize the arc fault feature quantity.
2) The random forest algorithm training diagnosis model based on five time-domain feature quantities and one IMF component corresponding to energy entropy as the frequency-domain feature quantity has good generalization performance for arc fault identification.
3) The training process of random forest uses a decision tree as the basic unit to perform simple two-class classification. The training results show that the recognition rate of series arc faults has reached more than 97%, and the recognition effect is remarkable, which can provide analytical ideas for the improvement of series arc fault diagnosis algorithms and the research on the safety of people’s livelihood.
Data Availability Statement
The raw data supporting the conclusion of this article will be made available by the authors, without undue reservation.
Author Contributions
LZ and CC contributed to the conception and design of the study. QZ and LZ organized case studies. CC was responsible for program compilation and writing–original draft. HM was responsible for laboratory and supervision. LZ completed the substantial revision. All authors contributed to manuscript revision and read, and approved the submitted version.
Conflict of Interest
Author HM is employed by Suzhou Future Electric Co., Ltd.
The remaining authors declare that the research was conducted in the absence of any commercial or financial relationships that could be construed as a potential conflict of interest.
Publisher’s Note
All claims expressed in this article are solely those of the authors and do not necessarily represent those of their affiliated organizations, or those of the publisher, the editors, and the reviewers. Any product that may be evaluated in this article, or claim that may be made by its manufacturer, is not guaranteed or endorsed by the publisher.
Acknowledgments
All authors are acknowledged for their contributions to the article and experiments.
Reference
Ali, J., Khan, R., Ahmad, N., and Maqsood, I. (2012). Random Forests and Decision Trees. Int. J. Comput. Sci. Issues (IJCSI). 9 (5), 272.
Chen, C. K., Guo, F., Liu, Y., Wang, Z., Chen, Y., and Liang, H. (2015). “Recognition of Series Arc Fault Based on the Hilbert Huang Transform,” in 2015 IEEE 61st Holm Conference on Electrical Contacts (Holm) (IEEE). doi:10.1109/holm.2015.7355116
Chen, S., Li, X., Meng, Y., and Xie, Z. (2019). Wavelet-based Protection Strategy for Series Arc Faults Interfered by Multicomponent Noise Signals in Grid-Connected Photovoltaic Systems. Sol. Energy 183, 327–336. doi:10.1016/j.solener.2019.03.008
Cui, R. H., Tong, D., and Li, Z. (2021). Aviation Arc Fault Detection Based on Generalized S Transform. Chin. J. Electr. Eng. 41 (23), 8241–8250. doi:10.13334/j.0258-8013.pcsee.201626
Cui, R., and Tong, D. (2021). Aeronautical AC Series Arc Fault Detection Based on Levene Test. Chin. J. Electrotech. Technol. 36 (14), 3034–3042.
Dragomiretskiy, K., and Zosso, D. (2014). Variational Mode Decomposition. IEEE Trans. Signal Process. 62 (3), 531–544. doi:10.1109/tsp.2013.2288675
Gao, H., Wang, Z., and Tang, A. (2021). Research on Series Arc Fault Detection and Phase Selection Feature Extraction Method. IEEE Trans. Instrum. Meas. 70, 1–8. doi:10.1109/tim.2021.3080376
General Administration of Quality Supervision (2014). Inspection and Quarantine of the People's Republic of China GB/T31143-2014. General Requirements of Series Arc Fault Detection Device (AFDD). Beijing: Standards Press of China.
Jiang, J., Li, W., Wen, Z., Bie, Y., Schwarz, H., and Zhang, C. (2021). Series Arc Fault Detection Based on Random Forest and Deep Neural Network. IEEE Sensors J. 21 (15), 17171–17179. doi:10.1109/jsen.2021.3082294
Jin, J. T., Xu, Z., Li, C., Miu, W., and Li, G. (2021). Bearing Fault Diagnosis Based on VMD Energy Entropy and Optimized Support Vector Machine. J. Metrology 42 (7), 898–905.
Jingjing, S. U., and Zhihong, X. U. (2019). Diagnosis Method of Multi-Variable Criterion Based on EMD and PNN for Arc Fault Diagnosis. Electr. Power Autom. Equip. 39 (4), 106–113.
Karakose, E., Gencoglu, M. T., and Karakose, M. (2018). A New Arc Detection Method Based on Fuzzy Logic Using S-Transform for Pantograph–Catenary Systems. J. Intell. Manuf. 29, 839–856. doi:10.1007/s10845-015-1136-3
Khafidli, M. K. (2018). “Implementation AC Series Arc Fault Recognition Using Mikrokontroller Based on Fast Fourier Transform,” in 2018 International Electronics Symposium on Engineering Technology and Applications (IES-ETA) (IEEE). doi:10.1109/elecsym.2018.8615529
Lala, H., and Subrata, K. (2020). Detection and Experimental Validation of High Impedance Arc Fault in Distribution System Using Empirical Mode Decomposition. IEEE Syst. J. 14 (3), 3494–3505. doi:10.1109/jsyst.2020.2969966
Li, S., Bai, X., Dong, H., Lu, H., and Guo, C. (2020). Early Fault Identification Method of Cable Based on Stationary Wavelet Transform and Random Forest. New Technol. Electr. Power Eng. 39 (3), 40–48.
Lin, J., Wang, Y., Li, K., and Tian, M. (2020). Series Arc Fault Detection Method Based on Self-Organizing Feature Mapping Network. Electr. Power Autom. Equip. 40 (08), 210–219.
Lin, J., Luan, W., and Liu, B. (2021). “A Novel Non-intrusive Arc Fault Detection Method for Low-Voltage Customers,” in 2021 6th Asia Conference on Power and Electrical Engineering (ACPEE), 84–88. doi:10.1109/ACPEE51499.2021.9437035
Liu, G., Du, S., Su, J., and Han, X. (2017). Research and Development Trend of Low Voltage Arc Fault Protection Technology. Power grid Technol. 1, 321–329.
Liu, G. G., Du, H. S., Su, J., and Han, X. H. (2017). Research and Development Trend of Low Voltage Arc Fault Protection Technology. Power Syst. Technol. 41 (01), 305–313. doi:10.13335/j.1000-3673.pst.2016.0804
Liu, J., Zhou, K., and Hu, Y. (2018). “EMD-WVD Method Based High-Frequency Current Analysis of Low Voltage Arc,” in 2018 Condition Monitoring and Diagnosis (CMD) (IEEE). doi:10.1109/cmd.2018.8535969
Liu, S., Liu, Z., Liu, Y., Cao, Y., and Li, J. (2021). “Arc Fault Recognition Based on VMD and ELM,” in The Proceedings of the 9th Frontier Academic Forum of Electrical Engineering (Singapore: Springer). doi:10.1007/978-981-33-6609-1_47
Ma, T., Tian, E., Liu, Z., Liu, S., Guo, T., Wang, T., et al. (2020). Detection of DC Series Arc Fault Based on VMD and ELM. J. Phys. Conf. Ser., 1486 (6), doi:10.1088/1742-6596/1486/6/062037
Ma, Y., Maqsood, A., Oslebo, D., and Corzine, K. (2022). Wavelet Transform Data-Driven Machine Learning-Based Real-Time Fault Detection for Naval DC Pulsating Loads. IEEE Trans. Transp. Electrific. 8 (2), 1956–1965. doi:10.1109/TTE.2021.3130044
Miao, W., Xu, Q., and Lam, K. H. (2020). DC Arc-Fault Detection Based on Empirical Mode Decomposition of Arc Signatures and Support Vector Machine. IEEE Sensors J. 21 (5), 7024–7033.
Qi, P., Jovanovic, S., and Lezama, J. (2017). Discrete Wavelet Transform Optimal Parameters Estimation for Arc Fault Detection in Low-Voltage Residential Power Networks. Electr. Power Syst. Res. 143, 130–139. doi:10.1016/j.epsr.2016.10.008
Shao, X. L. (2020). Analysis of the Importance of Fire Prevention to the Safety of High-Rise Residential Buildings. China Fire Prot. 41 (05), 53–54.
Syafi’i, M. H. R. A., Prasetyono, E., Khafidli, M. K., Anggriawan, D. O., and Tjahjono, A. (2018). “Real Time Series DC Arc Fault Detection Based on Fast Fourier Transform,” in 2018 International Electronics Symposium on Engineering Technology and Applications (IES-ETA) (IEEE).
Wang, Y., Li, Y., and Ge, L. (2017). Fault Identification of Series DC Arc Based on Sliding Discrete Fourier Transform. J. Electrotech. 32 (19), 118–124.
Wang, Y., Zhang, Y. F., and Niu, F. (2019). Characterization and Measurement Method of DC Arc Electromagnetic Radiation for Photovoltaic Systems. Trans. China Electrotech. Soc. 34 (14), 2913–2921.
Xiong, Q., Chen, W. J., Ji, C. C., and Zhu, L. Y. (2016). Review of Research Progress on Arc Fault Characteristics Detection and Location Methods in Low-Voltage DC Systems. Proc. CSEE 36 (19), 5236–5244.
Xiong, Q., Ji, S. C., and Lu, W. F. (2017). Amplitude and Frequency Characteristics of Electromagnetic Radiation of Series DC Arc Faults under Low Pressure. Proc. CSEE 37 (4), 1071–1079.
Yu, Q., Hu, Q., and Yang, Y. (2020). Arc Fault Detection Based on Wavelet Features and Deep Learning. J. Electron. Meas. Instrum. 34 (03), 100–108.
Zhang, G. Y., Zhang, X. L., Liu, H., and Zhang, Y. H. (2016). On-line Detection Method of Series Arc Fault in Low Voltage System. J. Electrotech. Technol. 31 (08), 109–115.
Zhang, Z., Nie, Y., and Lee, W. J. (2018). Approach of Voltage Characteristics Modeling for Medium-Low-Voltage Arc Fault in Short Gaps[J]. IEEE Trans. Industry Appl. 55 (3), 2281–2289.
Nomenclature
X1 kurtosis
X2 waveform factor
X3 crest factor
X4 pulse factor
X5 margin factor
X6 energy entropy
X7 arc fault status
xi current sampling sample
E expectation
σ standard deviation
λ(t) Langrange multiplier
α penalty factor
δ(t) Dirac delta function
ωk IMF component center frequency
uk(t) modal components
K the number of modal decompositions
HEm energy entropy
Sm variance contribution rate
varm variance of IMF components
varr variance of remainder
Abbreviations
EMD empirical mode decomposition
IMF intrinsic modal function
CART classification and regression tree
VMD variational mode decomposition
Keywords: series arc fault, IMF component, variational modal decomposition, energy entropy, random forest algorithm
Citation: Zhao L, Chi C, Zhao Q and Mao H (2022) Series Arc Fault Diagnosis Based on Variational Mode Decomposition and Random Forest. Front. Energy Res. 10:889273. doi: 10.3389/fenrg.2022.889273
Received: 04 March 2022; Accepted: 02 May 2022;
Published: 17 June 2022.
Edited by:
Yahui Zhang, Yanshan University, ChinaReviewed by:
Srete Nikolovski, Josip Juraj Strossmayer University of Osijek, CroatiaAhmad Farid Abidin, Faculty of Electrical Engineering UiTM, Malaysia
Copyright © 2022 Zhao, Chi, Zhao and Mao. This is an open-access article distributed under the terms of the Creative Commons Attribution License (CC BY). The use, distribution or reproduction in other forums is permitted, provided the original author(s) and the copyright owner(s) are credited and that the original publication in this journal is cited, in accordance with accepted academic practice. No use, distribution or reproduction is permitted which does not comply with these terms.
*Correspondence: Changchun Chi, Y2hhbmdjaHVuX2NoaUAxMjYuY29t
 Luyao Zhao1
 Changchun Chi