- Shanghai Jiao Tong University, Shanghai, China
Unmanned aerial vehicle-based transmission line inspections produce a large number of photos; significant manpower and time are required to inspect the abnormalities and faults in such photos. As such, there has been increasing interest in the use of computer vision algorithms to automate the detection of defects in these photos. One of the most challenging problems in this field is the identification of defects in small pin bolts. In this paper, we propose a pin state identification framework cascaded by two object detectors. First, the bolts are located in the transmission line photos by an initial object detector. These bolts are expanded in the original picture and cropped. These processed bolts are then passed to a second object detector that identifies three states of the pins: normal, pin missing, and pin falling off. The proposed framework can attain 54.3 mAP and 63.4 mAR in our test dataset.
Introduction
Traditional transmission line inspection methods rely on binoculars and other equipment to visually inspect the pylons’ key components in person. The inspection methods are inefficient in finding defects in small components and vision dead zones. In recent years, the development and application of unmanned aerial vehicle (UAV)-based inspection has primarily replaced the traditional inspection methods, significantly improving the efficiency of transmission line inspections, as shown in Figure 1.
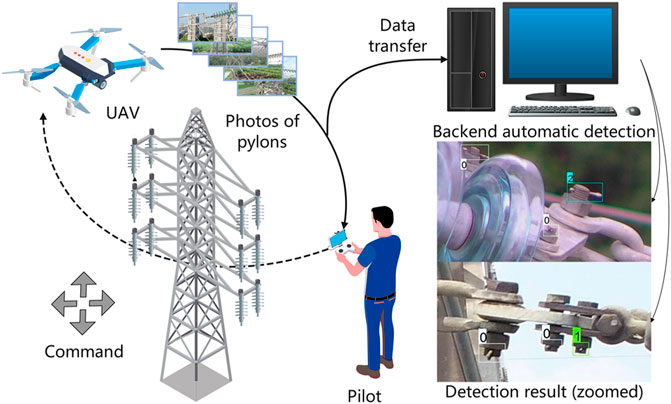
FIGURE 1. Schema of UAV-based inspection in our project. Here, UAV-captured photos are transferred to a backend computer for automatic defect detection.
The UAV-based inspection method requires people to inspect many photos manually, which could be labor-intensive if not assisted by object detection algorithm. As a result, power grid companies globally have invested in the research and development of the automation of transmission line inspection methods. One of the most critical tasks of the transmission line inspection is to detect faults and defects in power equipment, such as Stockbridge dampers, insulators, bird nest, and pin bolts (Jin et al., 2012; Fu et al., 2017; Hao et al., 2019; Ju and Yoo, 2019; Ling, 2019; Wang et al., 2019; Shi et al., 2020; Zhao et al., 2020).
The automatic detection of relatively large objects like bird nest and self-blast glass insulator fault has been established enough for practical applications. Studies concerning the above objects usually use object detectors such as Faster RCNN (Ren et al., 2017), RetinaNet (Lin et al., 2020), Single Shot MultiBox Detector (SSD) (Liu et al., 2016), and You Only Look Once (YOLO) (Redmon et al., 2016).
However, the automatic detection of pin defects in the context of UAV-captured photos is still far from being practical. As stated in Nguyen et al. (2018), small object detection is one of the challenges of deep learning-based UAV powerline photo inspection. The detection and state identification of pins are particularly difficult because, as calculated from our UAV captured dataset, pins cover, on average, 0.01%–0.03% of the area of UAV photos.
To solve the problem of extremely small target localization and pin defect detection, scientific and industrial communities have used various object detectors on the pin state identification task. Fu et al. (2017) utilized And-Or graph with hierarchical AdaBoost classifier using the Haar feature to detect pins missing under a bolt nut size background, which are cropped manually from UAV photos. In this study, the pin bolts need to be cropped manually from UAV photos before they are input to their proposed algorithm, making it impractical, and its robustness vis-à-vis real application scenarios where bolts vary in angles and in illumination is questionable.
Wang et al. (2019) utilized RetinaNet with ResNet-50 to detect normal pin, pin missing, and pin falling off. The detector was trained on close-distance UAV photos with auxiliary data (insulators with bolt shackles on oil ground) and achieved good detection results. In our case, due to the much smaller pin area coverage, even the ResNet-101-based detector cannot perform the task of directly detecting pin missing and pin falling off in our dataset (proof in the Results and Discussion section). In this way, to use RetinaNet with ResNet-50, a larger pin area coverage is required. In this article, we propose to add another object detector to enlarge the pin area coverage before the use of RetinaNet to identify pin states.
Zhao et al. (2020) proposed a cascade object detection structure combining Vgg-16 and Faster RCNN with ResNet-101 named AVSCNet for the detection of normal pins and missing pins and achieved satisfactory results. However, there are other pin states that need to be recognized in UAV photos, such as improper pin installation and pin falling off, which were not studied in their work. In our work, the identification of normal pin, missing pin, and pin falling off is studied. Before the identification of pin states, bolts containing pins are first detected and bounded by a rectangle box. Nevertheless, pins may be truncated in this step, which may mislead the object detectors, as shown in Figure 6. To compensate for the negative effect of incomplete coverage of pins, expansive cropping (EC) on bolt bounding boxes is proposed and studied.
In the context of railway catenary, to maintain stable power supply for trains, state identification of fasteners at cantilever joints is an important problem, which is a similar scenario to pin state identification. To automatically identify the states of fasteners, a cascaded detection method of three neural networks is proposed in Chen et al. (2018). Firstly, SSD is employed to locate cantilever joints in catenary, then YOLO is utilized to locate their fasteners, and finally the authors use deep convolutional neural network (CNN) to classify the state of fasteners. Still, the cascade of three networks is redundant as YOLO has the classification ability.
From the above literature and our preliminary studies, we propose a pin state identification framework involving a cascade of two object detection networks. This will be referred to as cascade framework hereinafter. The cascade framework should be installed at a backend computer as shown in Figure 1 and processes photos that conform to the tentative instruction manual for UAV Inspection Photo Capture of Overhead Transmission Lines (the tentative UAV photo instruction) given by State Grid Corporation of China (SGCC), in which the components of fasteners (bolt, pin, and nut) are required to be clearly visible.
To briefly justify why a single detector was not utilized and a cascade framework is needed instead, we have tested two state-of-the-art detectors for pin state identification, the performances of which are far from being ideal, as shown in Supplementary Table S5. An intuitive insight into why a single detector cannot work is that pins are too small in UAV inspection photos for CNNs to effectively extract their features. In other words, their features vanished during the convolution and downsampling process of CNNs on UAV inspection photos (Pang et al., 2019), but in the case of close-distance photos where pins cover a significant part of photos, as in the case of Figure 9 in the Pin State Identification Dataset section, CNNs are able to correctly extract the features of pins.
The main contributions of this article are as follows:
- A cascade framework is proposed for pin state identification in the context of UAV-captured transmission line photos.
- A compensation for incomplete pin coverage named expansive cropping is proposed and its effects on the overall detection performances is studied.
- The performances of multiple state-of-the-art object detectors are studied in the context of UAV inspection photos.
The paper is organized as follows: the Method section elaborates the proposed framework. The Datasets and Experiments section presents the datasets, experimental configurations, and evaluation metrics. The Results and Discussion section justifies why single detectors are not used, provides the results of experiments, and presents the discussion on the cascade framework. The Conclusion section concludes this article, and gives limitations and future perspectives of pin state identification.
Methods
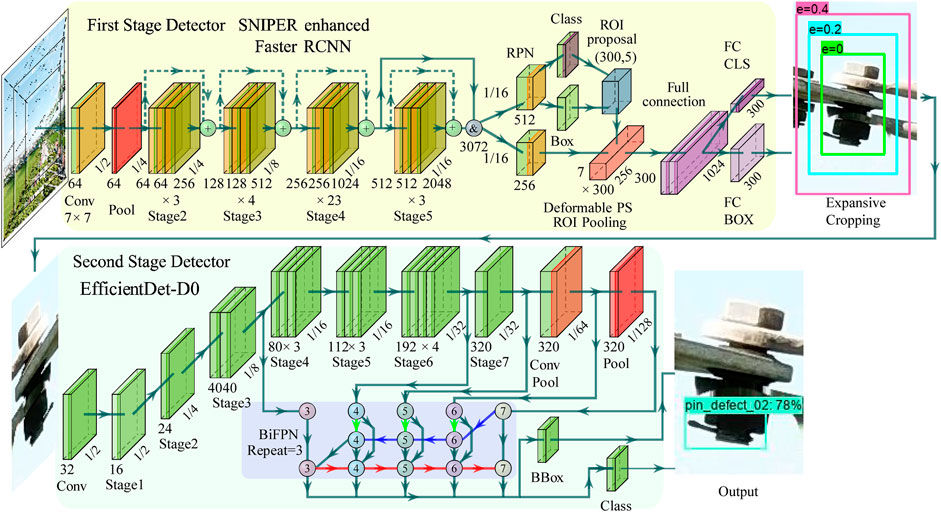
The overall inference scheme of the proposed cascade framework is shown in Figure 2. The cascade framework takes UAV photos as the input, and gives located pins with their states as the output. Firstly, the bolts are located in the transmission line photos by the first-stage object detector. Then, these located bolts are expanded in the original pictures and cropped. Finally, a second-stage object detector is utilized to identify three states (normal, pin missing, and pin falling off) of pins in the aforementioned bolt crops.
The first-stage detector is exemplified by the Scale Normalization for Image Pyramids with Efficient Resampling (SNIPER) strategy enhanced Faster RCNN in a pale-yellow background in Figure 2. A detailed description of SNIPER will be provided in the next subsection. For simplicity, in this article, SNIPER will refer to the network architecture: SNIPER enhanced Faster RCNN. The mission of first-stage detectors is to locate bolts in UAV-captured transmission line photos in the form of bounding boxes. At the input of the first-stage detector, it is important to note that only SNIPER resizes UAV photos to three scales to form image pyramids; the other detector utilized in this study, EfficientDet-D7, resizes photos to only one scale. After the photo input, we illustrate ResNet-101 backbone, which features the input image, and the region proposal network (RPN) detection head of Faster RCNN, which gives the regions of interest. The output of the first-stage detector is depicted in the expansive cropping part at the end of the pale-yellow background (a bounding box of
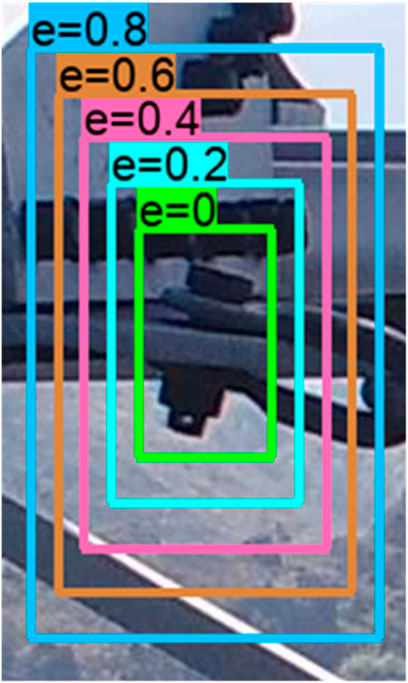
Next, the coordinates of localized bolts are expanded in terms of a given expansive ratio, as the various concentric bounding boxes shown at the expansive ratio part in Figure 2. These bolts are cropped according to expanded coordinates and saved for inference on second-stage detectors. These cropped bolt images vary in size and are all resized by bicubic interpolation to a predefined size. The predefined size is determined by the configuration of each second-stage detector. The second-stage detector is exemplified by EfficientDet-D0 (D0) in a pale-lime background. The second-stage detector takes these expanded bolt crops as the input, locates pins, and identifies their states. The backbone of a second-stage detector D0 is illustrated after the input image. Below the backbone, the BiFPN (Bidirectional Feature Pyramid) structure is illustrated in a pale-blue background. BiFPN fuses semantic information of high, intermediate, and low feature levels. The BiFPN layers are repeated three times in the case of D0. Finally, the locations and states of pins are given, as shown in the output part of Figure 2.
The first-stage detectors are trained on the bolt localization dataset (Bolt Localization Dataset section), and the second-stage detectors are trained on the pin state identification dataset (Pin State Identification Dataset section).
First-Stage Detector: Bolt Localization Network
The task of the first-stage detector is to locate as many bolts as possible in the transmission line inspection photos taken by UAV. These photos are of high resolution and the bolts occupy solely about 0.06% of the area in the photos, calculated from our bolt localization dataset in the Bolt Localization Dataset section. This task requires the use of an object detection network with a strong ability to find small targets. For this reason, we select SNIPER enhanced Faster RCNN and EfficientDet-D7, both with a strong performance on small object detection in the COCO object detection challenge (Lin, 2015), as the research objects of the first-stage detector.
Scale Normalization for Image Pyramids with Efficient Resampling SNIPER
Singh et al. (2018) proposed a strategy on multi-scale training and detection, entitled Scale Normalization for Image Pyramids with Efficient Resampling. Scale Normalization for Image Pyramids (SNIP) is utilized on image inference and efficient resampling is used in the training process of CNN.
The efficient resampling process, as shown in Figure 2, generates a series of image resamples
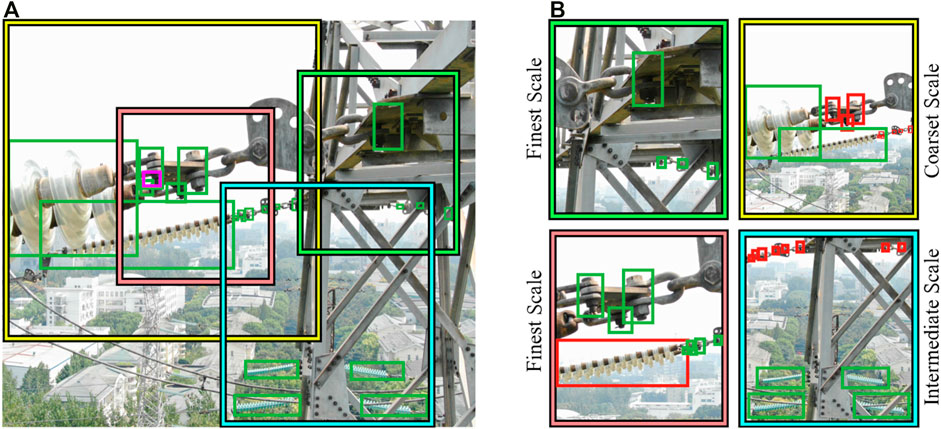
FIGURE 3. Efficient resampling. In (A), four chips of three scales are illustrated by squares, the green bounding boxes are labels, and the magenta bounding box annotates a defect pin. In (B), for each chip, green grounding boxes are labels in valid range and are saved for training; red ones are labels out of valid range, and are discarded when training.
To obtain chips
When training, each chip
As Figure 2 demonstrates, when Faster RCNN performs image inference, the input photo is scaled to the following three resolutions: [2000, 1400], [1280, 800], and [512, 480] to form the image pyramid. Similar to the mechanism of valid range in label assignment above, for the largest resolution, small objects in the detection result are kept and large objects are discarded; in contrast, for the finest resolution, large objects are kept and small objects are invalidated. Finally, detection result of all different scales is aggregated for non-maximum suppression to get the final result.
In this work, SNIPER strategy is employed on Faster RCNN. The backbone of Faster RCNN is ResNet-101 (He et al., 20162016) with the following modifications: Stage 5 does not perform downsampling on the output of Stage 4, and the outputs of Stage 4 and 5 are concatenated for the subsequent process, as illustrated in Figure 2. Downsampling may damage semantic information of small objects (Pang et al., 2019), whereas the bolts are small objects in UAV photos. Concatenation here fuses semantic information of higher and lower levels; usually, lower-level features preserve small object information better.
EfficientDet
A family of object detectors, named EfficientDet-D0, D1, …, D7, are proposed in Tan et al. (2020). These detectors use EfficientNet (Tan and Le, 2019) as the backbone. As illustrated in Figure 2, features of different semantic levels are sent to the Bidirectional Feature Pyramid Network (BiFPN) for feature fusion. The output of BiFPN layers is utilized to perform object classification and bounding box regression.
Experiments in Figure 4 prove that EfficientDet-D7 (D7), with the largest input image resolution of [1536, 1536] pixels in the detector family, has the best average precision of 0.58, and an average recall of 0.74 in our bolt localization dataset, which will be introduced in the Bolt Localization Dataset section.
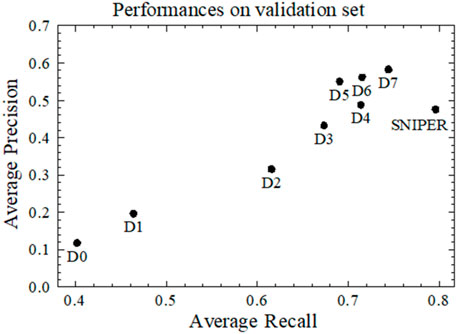
FIGURE 4. Performances of EfficientDet and SNIPER at IoU = 0.5 on the validation set of our bolt localization dataset, see the Bolt Localization Dataset section.
The structure of D0 is given in Figure 2. All EfficientDet detectors share the same structure; the differences among these detectors are depth and width of convolutional blocks, BiFPN layer repetition times, and the size of input image.
Expansive Cropping
Once the bolt localization network gives the coordinates of a detected bolt, in the form of
where w and h
Detected bolts are expanded and cropped according to new coordinates and saved for pin state identification.
The motivation of adding EC in the proposed framework is to compensate for the negative effects brought by incomplete coverage of the pins in detected bolts. The authors believe that the semantic information given by full coverage of pins is necessary for credible pin state identification for both human and CNNs. In the context of pin state identification, human inspectors need full coverage of pins in bolt crops to deduce whether the pin states are normal or abnormal, and object detectors have the same need. EC can complete the coverage of pins and provides the second-stage detectors with complete semantic information of pins, whereas incomplete coverage weakens the credibility of inference results. In most cases, the coordinates of a bolt given by the bolt localization network can completely cover its pin. Nevertheless, there are cases where original coordinates do not entirely cover the pin, as shown in Figures 6A,B. Incomplete coverage will cause the detector to misjudge: EfficientDet-D1 (D1) misidentified the pin falling off state in Figure 6A, whereas D1 identified correctly its normal state with EC in Figure 6C, similar to Figure 6B (undetected) and Figure 6D (correctly detected).
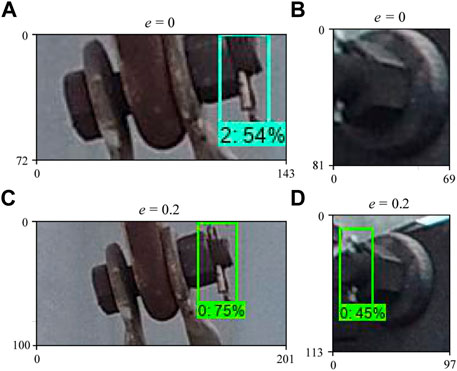
FIGURE 6. Detection results without EC (A,B) and with EC (C,D), bounding boxes provided by EfficientDet-D1; 0 for normal pin, 2 for pin falling off.
Second-Stage Detector: Pin State Identification Network
The task of the second-stage detector is to locate the pins in cropped bolt images and identify the three pin states: normal, missing, and falling off.
Normal, missing, and falling-off pins cover respectively 20%, 11.7%, and 18.2% of area in a cropped photo, on average (Supplementary Table S1), calculated from our pin state identification dataset (Pin State Identification Dataset section). Experiments prove that the object detector with relatively fewer parameters can accomplish this task. This study uses the following detection models as the research object: D0, D1, D2, D3, and RetinaNet.
EfficientDet (For Pin State Identification)
We have trained and tested D0–D7 as second-stage detectors. Figure 7 shows the mean Average Precision of EfficientDet-D0–D7 and RetinaNet (ResNet-50) with respect to their numbers of parameters, and it can be observed that the detection results of larger models—D4, D5, D6, and D7—were not better than those of smaller detectors like D2 in the context of cascade framework. It is uneconomical to deploy larger and more resource-consuming models while getting worse or equivalent results compared to smaller models like D2 or D3. Thus, only D0, D1, D2, and D3 are later studied in detail.
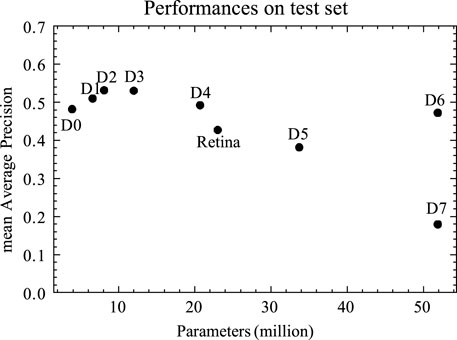
FIGURE 7. Detection result of EfficientDet and RetinaNet at IoU = 0.5 on the test set, see the Test Set section. First-stage detector: D7, expansive ratio = 0.
RetinaNet
In this study, another object detector, RetinaNet (Lin et al., 2020), is also utilized for pin state identification. The structure of RetinaNet is similar to EfficientDet: convolutional feature extraction backbone is followed directly by bounding box and class regression. In this study, the backbone of RetinaNet is ResNet-50 with Feature Pyramid Network (FPN).
Object detectors can be divided into two-stage or one-stage according to whether there is RPN or not. RPN can filter out simple negative samples (backgrounds), reducing their negative effect during detector training. To compensate for the absence of RPN, Lin et al. (2020) proposed a concept of Focal Loss, which dynamically assigns more weight to gradients of difficult samples during training, so as to strengthen the learning direction and make the training process more efficient.
Datasets and Experiments
In this section, we introduce Bolt Localization Dataset and Pin State Identification Dataset, and how detectors are trained using them. All datasets are annotated with LabelImg (darrenl, 2020). The proposed framework with different settings is evaluated on our test set. Training details, evaluation metrics, and hardware configurations are hereby presented.
The UAV inspection photos in this work are collected following the tentative UAV photo instruction.
Bolt Localization Dataset
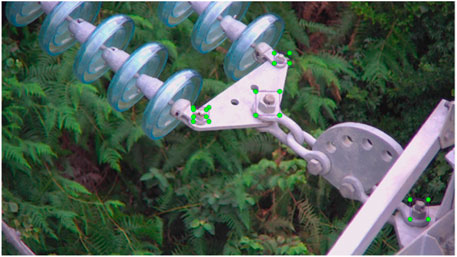
The bolt localization dataset of this study contains 482 UAV-taken transmission line photos, containing 2,392 labeled bolts. A total of 385 photos are selected randomly as the training set and 97 photos are taken as the validation set. Figure 8 shows an example of a photo in this dataset and its labels. The purpose of the training set and validation set is to allow the first-stage detector to learn the features of bolts in transmission line photos. The trained model that performs best on the validation set is selected for evaluation on the test set.
Pin State Identification Dataset
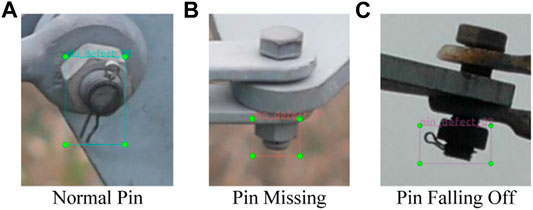
The pin state identification dataset of this study contains bolt cropped from UAV-captured transmission line photos. Examples of three labeled states—normal pin, pin missing, and pin falling off—are shown in Figure 9. This dataset includes the bolts of the bolt localization dataset, and bolts from other sources are added, which are usually bolts with pin missing or pin falling off. In these sources, only defective bolts are labeled; labeling normal pins in these sources would incur high temporal and financial cost. Therefore, these additional photos were not included in the bolt localization dataset.
A total of 11,963 cropped bolt photos are randomly selected as the training set, and 1,330 bolts are chosen as the validation set.
Test Set
The test set contains 155 UAV-captured transmission line photos. Only pins are labeled in this dataset, and the labeling method is the same as in the pin state identification dataset. The proposed framework is evaluated on this dataset.
Training Details
All models in this study are trained with mini-batch stochastic gradient descent (mini-batch SGD), which can be expressed as follows (Goyal, 2018):
where
Scale Normalization for Image Pyramids with Efficient Resampling
The ResNet-101 model of SNIPER was pretrained on ImageNet (Deng et al., 2009). The pretrained model was fine-tuned on the training set of bolt localization dataset with hardware configurations in the Hardware Configurations section. The learning rate was set to 0.015, the batch size was 4, and the training algorithm was mini-batch SGD with a momentum of 0.9. More details can be found in Najibi (2021).
The loss function for classification is cross entropy:
where
The loss function for localization is smooth L1:
where
Fine-tuned models were tested on the validation set of the bolt localization dataset, and the model with the best detection result on the validation set was saved for the experiment of the cascade framework on the test set.
RetinaNet
The ResNet-50 backbone of RetinaNet was pretrained on ImageNet. The pretrained model was fine-tuned on the training set of the pin state identification dataset with hardware configurations in the Hardware Configurations section. The learning rate was 0.0005, batch size was 1, and the training algorithm was mini-batch SGD with a momentum of 0.9. More details can be found in Github (2021).
The loss function for RetinaNet is focal loss:
where
Fine-tuned models were tested on the validation set of the pin state identification dataset, and the model with the best detection result on the validation set was saved for the experiment of the cascade framework on the test set.
EfficientDet
The EfficientDet models were pretrained on ImageNet. The pretrained models fine-tuned on the training set of the bolt localization dataset were first-stage detectors, and those fine-tuned on the training set of the pin state identification dataset were second-stage detectors. The training process utilized Cloud TPU v3-8 (Google Cloud, 2021) with 128 GB memory. The learning rate was initially 0.08, and the learning rate decay method was cosine [this method decays learning rate along a cosine curve during the training process and shortens the time to converge (Bello et al., 2017)]. The training algorithm was mini-batch SGD with a momentum of 0.9. More details can be found in Google (2021). The loss function of EfficientDet is focal loss as shown in
Evaluation
Common Metrics of Object Detection
The proposed pin state identification framework has three variable components: the first-stage detector, the expansive ratio, and the second-stage detector. To evaluate the performances of different configurations of the framework, we compare their detection results on the test set with the ground truths of the test set. Several metrics commonly used in object detection are utilized in the following evaluation:
A true or false positive is determined by whether the intersection over union (IoU) between a detected bounding box and a ground truth bounding box surpasses 50% (Everingham et al., 2015).
AP (Average Precision) represents the area under the curve of the Precision–Recall curve.
AR (Average Recall) is the maximum recall at a given IoU threshold.
Mean Average Precision (mAP) and mean Average Recall (mAR) are respectively the mean value of the AP and AR summation across all classes.
Frames per second (FPS) is calculated for each detector to measure how many images a detector can process per second.
Framework Configurations
Selected variables for experiments are listed in Supplementary Table S4. These variables are combined, resulting in a total of
Hardware Configurations
The experiments on test set were conducted on a computer with the following hardware: CPU: one Intel® Core™ i9-9920X at 3.50 GHz, GPU: one NVIDIA® RTX2080Ti with 11 GB memory, 64 GB of RAM.
Results and Discussion
It is beneficial to note that, before the proposition of cascade framework, the authors have experimented on the capabilities of state-of-the-art object detectors D7 and SNIPER without cascade to directly detect pin missing and pin falling off. The results in Supplementary Table S5 prove that these detectors are currently not utilizable in directly detecting pin missing and pin falling off in the context of UAV inspection photos. Small objects as pins are very difficult to detect even with human eyes because of their tiny scales. It is also difficult for CNNs to detect pins given the scale of pins in UAV photos, and the downsampling process of CNNs may vanish the features of small objects like pins in a UAV photo (Pang et al., 2019).
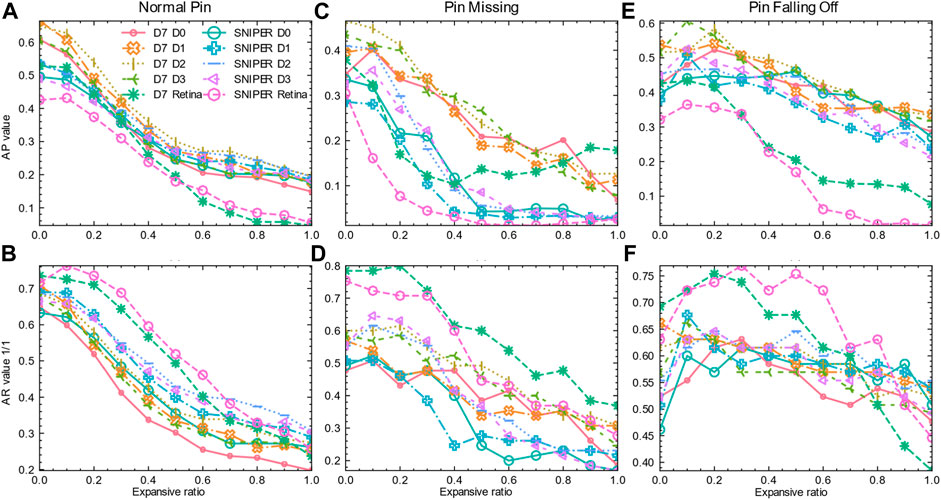
Figure 10 shows the test results of the 110 aforementioned configurations of the proposed framework. Horizontal axes of each subfigure of Figure 10 are expansive ratio [0, 0.1, 0.2, …, 0.9, 1]. Vertical axes of Figures 10A,C,E are AP values at IoU 50%, whereas vertical axes of Figures 10B,D,F are AR values at IoU 50%. In Figure 10, there are 10 combinations of detectors, 3 classes to be identified, and 2 metrics for each class; thus, there are
Effects of Expansive Cropping
Table 1 shows the distribution of the maximum value of each curve with the change of expansive ratio
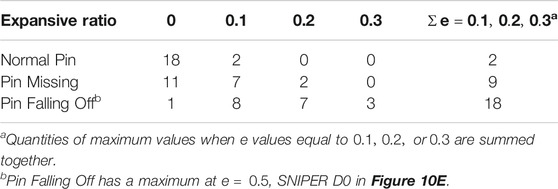
TABLE 1. Distribution of the maximum value of curves in Figure 10.
For normal pins, when the expansive ratio is 0, there are 18 curves out of 20 in Figure 10 to attain the maximum value. For pin missing, when the expansive ratio is 0, there are 11 curves out of 20 in Figure 10 to attain the maximum value. For pin falling off, when the expansive ratio is 0.1, 0.2, or 0.3, there are 18 curves out of 20 in Figure 10 that attain the maximum value. Cascaded pin identification with EC can ameliorate the detection of pin falling off defects.
In addition, Figure 10 also shows that, generally, with the increase of expansive ratio over 0.3, as pins cover less area in the cropped images, the detection effect for all categories almost inevitably declines.
Although the benefits of EC are less significant for pin missing and normal pin, in the application, it is beneficial to ameliorate the performance for solely one defect category, pin falling off, since power utilities want to locate as many faults as possible to maintain stable power supply.
Comparison of Bolt Localization Networks
Comparisons are made on 660 data points to evaluate the performances of different bolt localization networks. There are 5 second stage detectors, 11 expansive ratios, 2 metrics (AP and AR), 3 classes, and 2 bolt localization networks, for a total of 5 × 11 × 2 × 3 × 2 = 660 data points to be used for 330 comparisons. The one with the higher value gets one point, and no points when equal. The result of this comparison is listed in Table 2. According to Table 3, configurations with expansive ratio
As shown in Table 2, in terms of AP, EfficientDet-D7 as the bolt localization network is significantly better than SNIPER. SNIPER has located many small bolts in the distanced background, which EfficientDet-D7 did not detect, proving the benefit of SNIPER in finding as many bolts as possible. In addition, as shown in Table 3, SNIPER improves the recall rate of detection with EC to a small extent and thus reduces cases where pin abnormalities remain undetected.
Comparison of Pin State Identification Networks
From Figure 10, it can be observed that the cascade frameworks using RetinaNet as the pin state identification network have the highest mAR in all three types of pin states. However, RetinaNet is less robust to changes in expansive ratio, as in Figures 10A,C,E, than other second-stage networks, with the exception of EfficientDet-D7 as the bolt localization network in Figure 10C. The following tables will allow us to quantitatively analyze these three detectors.
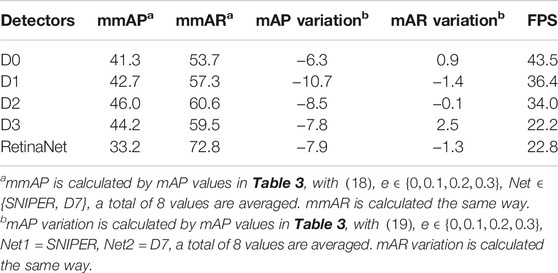
Due to the changes in expansive ratio and detectors, the mean values (mmAP, mmAR) of several mAP or mAR are employed to compare contributions of a single factor.
Table 3 shows detailed performances of the cascade framework with different configurations. Table 4 calculates several metrics to facilitate the comparison among different pin state identification networks.
When SNIPER serves as the bolt localization network, compared to D7, the performance of the cascade framework almost declines as Table 4 shows, while the mAR of D2 and D3 with EC can benefit from the larger quantity of detected bolts by SNIPER. In terms of mAP, D2 is the best-performing detector.
Metric Analysis
It can be known from the above discussion that the most suitable cascade framework configuration for each type of pin state is different. Pin failure is an extremely important failure for power utility companies, which may eventually lead to serious consequences such as powerline drop. Therefore, transmission line operators hope to find all faulty pins. From this perspective, when evaluating the performance of the cascade framework, a higher weight for recall rate should be given.
In Table 4, best configurations by pin state according to various metrics are listed. F2 score,
Comparative Analysis
YOLOX and HTC are selected as state-of-the-art detectors as baselines for comparison with detectors studied in this work.
YOLOX (Ge et al., 2021) is designed to improve the performance of YOLO-series detectors. The YOLOX-X for YOLOX-series is chosen for comparison.
HTC (hybrid task cascade) (Chen et al., 2019) uses a fully convolutional branch to transmit information flow along three detection heads, helping to distinguish hard foreground from cluttered background. HTC with ResNet 101 is chosen for comparison.
In Supplementary Table S6, it is shown that both SNIPER and D7 perform better than YOLOX and HTC.
Several recommendable configurations of the framework are given in Supplementary Table S7, with expansive ratio being 0.1. Besides, with the sacrifice in AP by deploying RetinaNet as the second-stage detector, AR can usually exceed 70%.
Conclusion
This paper proposed a pin state identification framework to identify the states of pins in bolts in the context of UAV-captured transmission line photos. Different configurations of the proposed framework are used to identify the three types of pin states: normal, missing, and falling pins.
1) Bolt Localization Network: SNIPER’s enhanced Faster RCNN can not only locate large pin bolts in transmission line photos, but also locate small pin bolts in the distanced background. However, in the test of cascade framework, these distanced bolts are usually not labeled, resulting in the decrease in AP of SNIPER. EfficientDet-D7 as the bolt localization network contributes more on precision and recall than SNIPER at a low expansive ratio.
2) Expansive Cropping: EC is proposed to compensate for the incomplete coverage of pins in bolts brought by the bolt localization network. Incomplete coverage of pins undermines the credibility of inference. The pin state identification is performed on the expanded bolt crops. For normal pin and pin missing, the cascaded framework can usually achieve better detection results when the EC is not performed, whereas for pin falling off, the cascade detection can achieve a better identification effect after the EC is performed.
3) Pin State Identification Network: The pin state identification network detects pins in cropped bolt images and identifies their states. In this work, EfficientDet-D0, D1, D2, D3, and RetinaNet are studied. D3 is more robust against changes of quantity input and D2 has the most precise performance. RetinaNet performs well in terms of recall, but its precision is not as good as D0–D3.
Limitations and Future Expectations
The dilemma between better detecting pin falling off and better detecting normal pin or pin missing is a limitation of our proposed framework. It is desirable to combine the advantages of utilizing EC on pin falling off detection and detection results without EC on normal pin and pin missing. Otherwise, an algorithm that provides second-stage detectors with bounding boxes that exactly match the boundaries of bolts may be more meaningful.
The cascaded object detection network is far from being able to independently perform the task of pin defect detection, and there are many other pin abnormalities and bolt abnormalities, such as improper pin installation and missing nuts, which are not included in this study.
The bolts on the soft mechanical connection of pylons need pins, and bolts elsewhere do not need pins, but this is difficult to distinguish for the object detection algorithms. It is necessary to know which are the bolts that require pins through prior knowledge of transmission lines when detecting the bolts.
Data Availability Statement
The original contributions presented in the study are included in the article/Supplementary Material, further inquiries can be directed to the corresponding author.
Author Contributions
YoL: experimental implementations, data analysis, and manuscript writing. ZL: inspiration of algorithm. YdL: data source provider. GS: manuscript revision and correction. XJ: financial support and manuscript inspiration.
Funding
This work was supported in part by Weihai Power Supply Company of State grid Corporation of China.
Conflict of Interest
The authors declare that the research was conducted in the absence of any commercial or financial relationships that could be construed as a potential conflict of interest.
Publisher’s Note
All claims expressed in this article are solely those of the authors and do not necessarily represent those of their affiliated organizations, or those of the publisher, the editors, and the reviewers. Any product that may be evaluated in this article, or claim that may be made by its manufacturer, is not guaranteed or endorsed by the publisher.
Supplementary Material
The Supplementary Material for this article can be found online at: https://www.frontiersin.org/articles/10.3389/fenrg.2022.813945/full#supplementary-material
References
Bello, I., Zoph, B., Vasudevan, V., and Le, Q. V. (2017). “Neural Optimizer Search with Reinforcement Learning,” in International Conference on Machine Learning, Sydney NSW Australia, July 2017, 459–468.
Chang, W., Yang, G., Yu, J., and Liang, Z. (2018). Real‐time Segmentation of Various Insulators Using Generative Adversarial Networks. IET Comput. Vis. 12 (5), 596–602. doi:10.1049/iet-cvi.2017.0591
Chen, J., Liu, Z., Wang, H., Nunez, A., and Han, Z. (2018). Automatic Defect Detection of Fasteners on the Catenary Support Device Using Deep Convolutional Neural Network. IEEE Trans. Instrum. Meas. 67 (2), 257–269. doi:10.1109/TIM.2017.2775345
Chen, K., Ouyang, W., Loy, C. C., Lin, D., Pang, J., Wang, J., et al. (2019). “Hybrid Task Cascade for Instance Segmentation,” in IEEE/CVF Conference on Computer Vision and Pattern Recognition (CVPR), Long Beach, CA, USA, June 2019. 4969–4978. doi:10.1109/CVPR.2019.00511
darrenl (2020). Tzutalin/labelImg. Available: https://github.com/tzutalin/labelImg (Accessed Nov 26, 2020).
Deng, J., Dong, W., Socher, R., Li, L.-J., Kai Li, Kai., and Li Fei-Fei, Li. (2009). “ImageNet: A Large-Scale Hierarchical Image Database,” in IEEE Conference on Computer Vision and Pattern Recognition, Miami, FL, USA, 20-25 June 2009 (Piscataway, New Jersey, United States: IEEE), 248–255. doi:10.1109/CVPR.2009.5206848
Everingham, M., Eslami, S. M. A., Van Gool, L., Williams, C. K. I., Winn, J., and Zisserman, A. (2015). The Pascal Visual Object Classes Challenge: A Retrospective. Int. J. Comput. Vis. 111 (1), 98–136. doi:10.1007/s11263-014-0733-5
Fu, J., Shao, G., Wu, L., Liu, L., and Ji, Z. (2017). Defect Detection of Line Facility Using Hierarchical Model with Learning Algorithm. High Volt. Eng. 43 (01), 266–275. doi:10.13336/j.1003-6520.hve.20161227035
Ge, Z., Liu, S., Wang, F., Li, Z., and Sun, J. (2021). YOLOX: Exceeding YOLO Series in 2021. Available at: https://arxiv.org/abs/2107.08430v2 (Accessed Jan 30, 2022).
Github (2021). DetectionTeamUCAS/RetinaNet_Tensorflow_Rotation. UCAS-Det. Available at: https://github.com/DetectionTeamUCAS/RetinaNet_Tensorflow_Rotation (Accessed Apr 13. 2021).
Google Cloud (2021). Cloud Tensor Processing Units (TPUs). Available at: https://cloud.google.com/tpu/docs/tpus (Accessed Apr 13, 2021).
Google (2021). Google/Automl. Available at: https://github.com/google/automl (Accessed Apr 13, 2021).
Goyal, P. (2018). “Accurate, Large Minibatch SGD: Training ImageNet in 1 hour. arXiv. ArXiv170602677 Cs. Available at: http://arxiv.org/abs/1706.02677 (Accessed Apr 16, 2021).
Hao, J., Wulin, H., Jing, C., Xinyu, L., Xiren, M., and Shengbin, Z. (2019). “Detection of Bird Nests on Power Line Patrol Using Single Shot Detector,” in Proceedings of the 2019 Chinese Automation Congress (CAC), Hangzhou, China, November 2019, 3409–3414. doi:10.1109/CAC48633.2019.8997204
He, K., Zhang, X., Ren, S., and Sun, J. (20162016). “Deep Residual Learning for Image Recognition,” in Proceedings of the IEEE Conference on Computer Vision and Pattern Recognition (CVPR), Salt Lake City, UT, USA, 18-22 June 2018 (Piscataway, New Jersey, United States: IEEE), 770–778. doi:10.1109/CVPR.2016.90
Hosseini, M. M., Umunnakwe, A., Parvania, M., and Tasdizen, T. (2020). Intelligent Damage Classification and Estimation in Power Distribution Poles Using Unmanned Aerial Vehicles and Convolutional Neural Networks. IEEE Trans. Smart Grid 11 (4), 3325–3333. doi:10.1109/TSG.2020.2970156
Jin, L., Yan, S., and Liu, Y. (2012). Vibration Damper Recognition Based on Haar-like Features and Cascade AdaBoost Classifier. J. Syst. Simul. 24 (09), 1806–1809. doi:10.16182/j.cnki.joss.2012.09.022
Ju, M., and Yoo, C. D. (2019). “Detection of Bird's Nest in Real Time Based on Relation with Electric Pole Using Deep Neural Network,” in Proceedings of the 34th International Technical Conference on Circuits/Systems, Computers and Communications ITC-CSCC, JeJu, Korea (South), 23-26 June 2019. 1–4. doi:10.1109/ITC-CSCC.2019.8793301
Lin, T.-Y., Goyal, P., Girshick, R., He, K., and Dollar, P. (2020). Focal Loss for Dense Object Detection. IEEE Trans. Pattern Anal. Mach. Intell. 42 (2), 318–327. doi:10.1109/TPAMI.2018.2858826
Lin, T.-Y. (2015). Microsoft COCO: Common Objects in Context. arXiv, ArXiv14050312 Cs. Available at: http://arxiv.org/abs/1405.0312 (Accessed Sep 29, 2020).
Ling, Z. (2019). An Accurate and Real-Time Self-Blast Glass Insulator Location Method Based on Faster R-CNN and U-Net with Aerial Images. Csee Jpes 5 (4), 474–482. doi:10.17775/CSEEJPES.2019.00460
Liu, W., Anguelov, D., Erhan, D., Szegedy, C., Reed, S., Fu, C.-Y., et al. (99052016). SSD: Single Shot MultiBox Detector. arXiv. 21–37. ArXiv151202325 Cs. doi:10.1007/978-3-319-46448-0_2
Lu, S., Liu, Z., and Shen, Y. (2018). Automatic Fault Detection of Multiple Targets in Railway Maintenance Based on Time-Scale Normalization. IEEE Trans. Instrum. Meas. 67 (4), 849–865. doi:10.1109/TIM.2018.2790498
Najibi, M. (2021). mahyarnajibi/SNIPER. Available at: https://github.com/mahyarnajibi/SNIPER (Accessed Apr 12, 2021).
Nguyen, V. N., Jenssen, R., and Roverso, D. (2018). Automatic Autonomous Vision-Based Power Line Inspection: A Review of Current Status and the Potential Role of Deep Learning. Int. J. Electr. Power Energ. Syst. 99, 107–120. doi:10.1016/j.ijepes.2017.12.016
Nguyen, V. N., Jenssen, R., and Roverso, D. (2019). Intelligent Monitoring and Inspection of Power Line Components Powered by UAVs and Deep Learning. IEEE Power Energ. Technol. Syst. J. 6 (1), 11–21. doi:10.1109/JPETS.2018.2881429
Pang, J., Li, C., Shi, J., Xu, Z., and Feng, H. (2019). $\Mathcal{R}^2$ -CNN: Fast Tiny Object Detection in Large-Scale Remote Sensing Images. IEEE Trans. Geosci. Remote Sensing 57 (8), 5512–5524. doi:10.1109/TGRS.2019.2899955
Redmon, J., Divvala, S., Girshick, R., and Farhadi, A., “You Only Look once: Unified, Real-Time Object Detection,” in Proceedings of the 2016 IEEE Conference on Computer Vision and Pattern Recognition (CVPR), Las Vegas, NV, USA, 27-30 June 2016 (Piscataway, New Jersey, United States: IEEE), 779–788. doi:10.1109/CVPR.2016.91
Ren, S., He, K., Girshick, R., Sun, J., and Faster, R-C. N. N. (2017). Faster R-CNN: Towards Real-Time Object Detection with Region Proposal Networks. IEEE Trans. Pattern Anal. Mach. Intell. 39 (6), 1137–1149. doi:10.1109/TPAMI.2016.2577031
Sampedro, C., Rodriguez-Vazquez, J., Rodriguez-Ramos, A., Carrio, A., and Campoy, P. (2019). Deep Learning-Based System for Automatic Recognition and Diagnosis of Electrical Insulator Strings. IEEE Access 7, 101283–101308. doi:10.1109/ACCESS.2019.2931144
Shi, J., Li, Z., Gu, C., Sheng, G., and Jiang, X. (2020). Research on Foreign Matter Monitoring of Power Grid with Faster R-CNN Based on Sample Expansion. Power Syst. Technol. 44 (1). doi:10.13335/j.1000-3673.pst.2019.0433
Singh, B., Najibi, M., and Davis, L. S. (2018). SNIPER: Efficient Multi-Scale Training. arXiv. ArXiv180509300 Cs. Available at: http://arxiv.org/abs/1805.09300 (Accessed Mar 29, 2020).
Tan, M., and Le, Q. V. (2019). EfficientNet: Rethinking Model Scaling for Convolutional Neural Networks. Available at: https://arxiv.org/abs/1905.11946v5 (Accessed Sep 30, 2020).
Tan, M., Pang, R., and Le, Q. V. (2020). “EfficientDet: Scalable and Efficient Object Detection,” in IEEE/CVF Conference on Computer Vision and Pattern Recognition (CVPR), Seattle, WA, USA, 13-19 June 2020 (Piscataway, New Jersey, United States: IEEE), 10778–10787. doi:10.1109/CVPR42600.2020.01079
Wang, K., Wang, J., Liu, G., Zhou, W., and He, Z. (2019). RetinaNet Algorithm Based on Auxiliary Data for Intelligent Identification on Pin Defects. Guangdong Electr. Power 32 (9), 41–48. doi:10.3969/j.issn.1007-290X.2019.009.005
Keywords: object detection, pin bolt, pin falling off, transmission line inspection, convolutional neural network (CNN)
Citation: Li Y, Li Z, Liu Y, Sheng G and Jiang X (2022) Pin Bolt State Identification Using Cascaded Object Detection Networks. Front. Energy Res. 10:813945. doi: 10.3389/fenrg.2022.813945
Received: 12 November 2021; Accepted: 10 February 2022;
Published: 23 March 2022.
Edited by:
Zaibin Jiao, Xi’an Jiaotong University, ChinaReviewed by:
Neeraj Dhanraj Bokde, Aarhus University, DenmarkHui Cao, Xi’an Jiaotong University, China
Copyright © 2022 Li, Li, Liu, Sheng and Jiang. This is an open-access article distributed under the terms of the Creative Commons Attribution License (CC BY). The use, distribution or reproduction in other forums is permitted, provided the original author(s) and the copyright owner(s) are credited and that the original publication in this journal is cited, in accordance with accepted academic practice. No use, distribution or reproduction is permitted which does not comply with these terms.
*Correspondence: Zhe Li, emhlX2xpQHNqdHUuZWR1LmNu
 Yaocheng Li
 Zhe Li*
 Yadong Liu