- 1State Grid Shanghai Electric Power Research Institute, Shanghai, China
- 2College of Electronic and Information Engineering, Shanghai University of Electric Power, Shanghai, China
- 3College of Electric Power Engineering, Shanghai University of Electric Power, Shanghai, China
In recent years, large-scale renewable energy access to substations has brought overload, harmonic, short circuit and other problems, which has led to an increase in the failure rate and shortening the service life of important power equipment such as transformers. Transformer is one of the key equipment in power system, and its operation status has an important impact on the safe and stable operation of power grid. In order to realize the real-time state evaluation of transformer, a real-time vibration signal detection method based on video is proposed in this paper. Firstly, YOLOv4 is used to detect the transformer object, and then the pyramid Lucas-Kanade optical flow method and Otsu method are used to calculate the transformer vibration vector. Experimental results show that the transformer vibration vector can be calculated in real time and accurately by using the proposed algorithm, so as to realize the real-time reliable analysis of the transformer state.
Introduction
In response to the call of the state to vigorously develop new energy power generation, more and more photovoltaic power stations and wind farms are connected to the power grid, which alleviates energy shortage and environmental pollution, but also brings many threats to the power grid. In particular, in order to save costs, some new energy power stations require direct access to the low-voltage side of the substation and transmit electric energy to a higher voltage level through the substation. In this way, the adverse impact of new energy on the power grid will be directly applied to the power transformer in the substation. As the upstream key equipment of the power system, the transformer is not only expensive, but also undertakes tasks such as voltage conversion, power distribution and transmission, and its operational reliability affects the operational safety of the power grid. Once the transformer fails, it may cause a large-scale blackout, which will cause huge direct and indirect economic losses (Munir and Smit, 2011). Therefore, the research on early fault detection and health status evaluation of power transformer is of great significance to improve the reliability of power transformer and ensure the safe and stable operation of power grid.
With the advancement of intelligent technology (Zhao et al., 2020; Zhao et al., 2017), for transformer maintenance, condition based maintenance is gradually adopted to replace the traditional regular maintenance and post-accident maintenance. The condition based maintenance method mainly determines the maintenance strategy based on the monitoring results of transformer operation status, so as to reduce the cost of equipment maintenance, reduce shutdown loss and effectively prevent the occurrence of failures (Berler et al., 2000). Currently, transformer condition assessment methods are mainly divided into two categories: online monitoring and offline detection. On-line monitoring can make the transformer need not be out of operation, can save manpower and material resources, and has its own obvious advantages. Commonly used online monitoring methods of power transformers mainly include low-voltage pulse method, frequency response analysis method, gas chromatography analysis method of dissolved gas in transformer oil, online monitoring method of transformer partial discharge and vibration analysis method of power transformer (Judd et al., 2002). A major advantage of the vibration analysis method is that the detection system does not have any form of electrical connection with the transformer under test, which will not affect the normal operation of the power grid, fully guarantee the safety of online monitoring and overcome the method of frequency response analysis, the method of short-circuit reactance, etc. can only monitor the insufficiency of transformer mechanical failure offline.
Research Status of Transformer Vibration Analysis
The vibration analysis method uses the vibration sensor to measure the vibration signal on the surface of the transformer oil tank, and then extracts the time-frequency domain characteristics contained to realize the on-line condition monitoring of the transformer, which belongs to the external detection and analysis method. In the mid to late 1990s, the idea of online monitoring of transformer operating status based on the vibration method was proposed. Although only Russia has used this method in the field, the results have proved that the vibration method can be used for any type of transformer, and the accuracy rate is relatively high. Due to the lack of in-depth research on the vibration characteristics of windings and iron cores and lack of experience, there are still great limitations in monitoring winding and iron core faults (Borucki, 2012; Cao et al., 2013).
With the advancing of time, the research on the transformer vibration method is also intensified. Berler et al. (2000) conducted a no-load and load control test on the transformer, and obtained the transformer box vibration when the iron core and the winding acted separately, and the experiment Laboratory research has taken a big step forward. Garcia et al. (2006a) and Garcia et al. (2006b) studied the relationship between vibration amplitude and phase and operating voltage, load current and temperature, established a mathematical model of fundamental frequency amplitude and operating voltage, load current and temperature, and obtained the fundamental frequency of winding and core vibration. The amplitude is proportional to the square of the load current and the operating voltage. This conclusion has played an important guiding role in subsequent transformer research.
Research Status of Vibration Signal Detection
The detection of transformer vibration signal is an important premise for analyzing and evaluating transformer operation state and fault diagnosis. At present, vibration signal detection is widely used in various engineering applications such as machinery, vehicles, construction, aerospace, etc., and has become an important research direction in the field of engineering measurement (Wadhwa et al., 2016). The detection methods of vibration signals can be roughly divided into two categories: contact vibration measurement and non-contact vibration measurement. The traditional contact vibration measurement mainly adopts the method of installing sensors on site, which has many defects. Since the contact sensor needs to be arranged point by point, the measurement range is limited. In addition, it is necessary to find a fixed reference object or reference point when performing displacement monitoring. At present, the commonly used non-contact vibration measurement is mainly divided into two categories: laser vibration measurement and visual vibration measurement methods based on video images. The laser vibration measurement method is mainly based on the principle of light interference, which has the advantages of extremely high accuracy and sensitivity, long measurement distance, and high measurement frequency. The current prices of laser vibration measurement related equipment are very expensive and the requirements for the professionalism of the operators are also high, which greatly restricts its large-scale promotion and application, and is currently often used in the fields of aerospace and machinery manufacturing.
As an emerging vibration measurement method, vision-based vibration detection has received extensive attention from scholars at home and abroad (Hati and Nelson, 2019; Feng et al., 2017; Chen et al., 2015; Wadhwa et al., 2017; Sarrafi et al., 2018; Choi and Han, 2018; Peng et al., 2020; Aoyama et al., 2018; Moya-Albor et al., 2020; Zhang et al., 2019). Visual vibration detection techniques can be divided into two categories according to whether optical targets are needed. Digital image correlation (DIC), marker tracking, and point tracking are typical technologies that need to manually set markers on test objects as optical targets for computer vision processing. Different from traditional measurement techniques based on contact sensor, DIC has been successfully applied to two-dimensional and three-dimensional vibration measurement, so as to provide full-field synchronous vibration information (Yu and Pan, 2017; Helfrick et al., 2011). Mark tracking uses computer vision methods to determine the coordinates of marks printed, projected or mounted on test objects, and also provides good results for vibration measurement (Feng et al., 2015; Long and Pan, 2016).
The target-less method unifies the internal features of test objects for computer vision processing without manually setting optical objects on test objects. Therefore, the target-less method is suitable for objects that are difficult to access or on which optical targets cannot be installed or printed (Long and Pan, 2016). Poudel et al. (2005) extracted time-history signals of displacement by using subpixel edge detection method to analyze the dynamic characteristics of test objects. However, the process of sub-pixel edge detection is complex, and the extraction of vibration time history needs a lot of pre-processing. Son et al. (2015) used non-contact target-free visual method to measure the vibration frequency and other characteristics of cylindrical objects in dangerous areas that are inaccessible to humans. However, this method is susceptible to the interference of brightness change. Huang et al. (2018) proposed a vibration measurement method named VVM based on computer vision, which is used to measure dynamic characteristics such as wind-induced dynamic displacement and acceleration responses. However, VVM uses template matching to obtain the motion information of all pixels in the whole ROI, which increases the running time of the algorithm. Yang et al. (2020) proposed a video-output-only method to extract the full-field motion of a structure and separate or reconstruct micro deformation mode and large object motion. However, this method is also difficult to adapt to harsh environment (different light intensity) and camera measurement angle. Optical flow method has been the focus of computer vision research since its beginning. This technology determines the instantaneous velocity of specific pixels in an image sequence and is widely used in motion tracking and estimation (Horn and Schunck, 1981). However, the accuracy assessment work shows that the relatively new optical flow technology still faces a major obstacle in practical vibration measurement applications, that is, the optimal selection of active feature points (Diamond et al., 2017). Overall, video image monitoring is a non-contact monitoring method that can not only perform static measurements such as displacement and strain, but also suitable for dynamic characteristics measurement. It has the advantages of simple operation, non-contact, non-destructive, no additional quality, and can realize long-distance, large-scale multi-point monitoring, etc., but there are also shortcomings such as the need to set objects, the optimal selection of active feature points, and high requirements for ambient light and background.
Main Contributions
To solve the above problems, this paper proposes a novel vision-based vibration detection method to realize the real-time state evaluation of transformer in the case of high proportion renewable energy access. Specifically, our main contributions are summarized as follows.
1) Based on the video signal of the transformer, this paper first uses transfer learning and YOLOv4 algorithm to detect the transformer as the region of interest, so as to avoid setting the target manually.
2) In this paper, Shi-Tomasi method is used to extract the feature points in the region of interest to calculate the transformer vibration vector, so as to avoid the interference of ambient light and background factors.
3) In this paper, Otsu algorithm is used to select the optimal active feature points, so as to improve the calculation accuracy of transformer vibration vector. Firstly, the vibration vectors of all feature points in the region of interest are calculated by the pyramid Lucas-Kanade (LK) sparse optical flow method. Then Otsu method is used to find the threshold of vibration vectors to filter out the vibration vector with small modulus. Finally, the remaining vibration vectors are summed and averaged, and the obtained mean is the transformer vibration vector.
The remainder of the paper is organized as follows. Background Section reviews the YOLOv4 model and the pyramid LK optical flow method. In Proposed Method Section, the proposed vision-based vibration detection method is introduced in detail. The performance of the proposed vibration detection method is examined in Experimental Results and Analysis Section and the conclusion is given in Conclusion Section.
Background
YOLOv4 Model
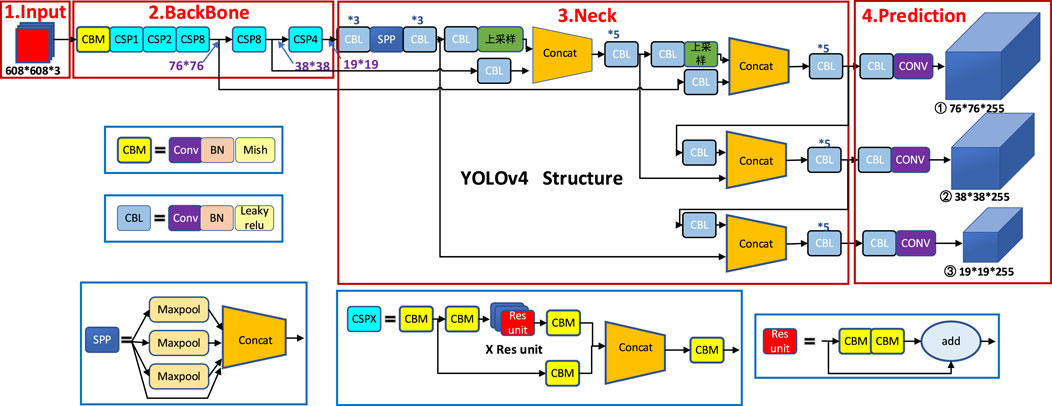
YOLOv4 is an efficient and powerful object detection algorithm which combines a large number of existing technologies and makes innovation to achieve a perfect balance between detection speed and accuracy. The YOLOv4 model includes four parts: input, the feature extraction network BackBone, the feature enhancement network Neck and Prediction network, and its structure is shown in Figure 1.
The BackBone of YOLOv4 is CSPDarknet53, which combines Darknet53 with CSPNet (Cross Stage Partial Network). CSPNet integrates gradient changes into feature maps in order to solve the problem of gradient information repetition and reduce the number of model parameters. Neck collects feature maps from the BackBone and enhance their expression ability. The Neck of YOLOv4 uses SPP (Spatial Pyramid Pooling) structure to increase the receptive field. PAN (Path Aggregation Network) is used for parameter aggregation instead of FPN (Feature Pyramid Network) to adapt to different levels of object detection. Finally, three feature layers are extracted and predicted by Prediction network. In addition, Mosaic data augmentation, Label Smoothing, DropBlock regularization, CIoU loss, cosine annealing learning rate and so on are used to improve the model performance.
Pyramid LK Optical Flow
Basic Assumptions
The optical flow method studies the displacement of an object in continuous images, for which a link between two frames is required. The implementation of the optical flow method requires two basic assumptions as prerequisites. First, the image intensity does not change. In this paper, the image is converted to grayscale processing, so it can be understood as that the grayscale value of a pixel at a point on the object does not change when it is displaced on the image. Second, the object motion is small. That is, the object position does not change dramatically on the image between two adjacent frames. Based on these two assumptions the same object between two frames can be linked.
Constraint Equation
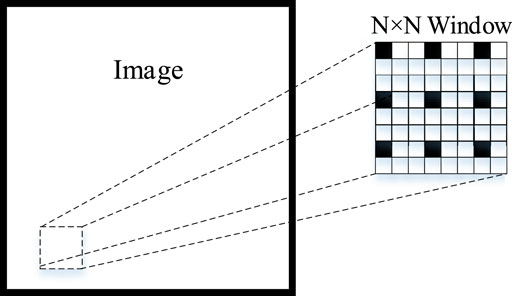
The basic problems studied by optical flow method can be represented by Figure 2 as follows.
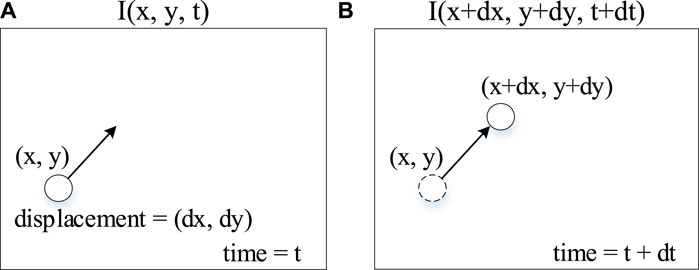
FIGURE 2. (A)
Based on the first assumption that the intensity of the pixel remains unchanged after the displacement occurs, the following equation can be established.
where
Dividing Eq. 2 by
where
LK Optical Flow Method
The mainstream optical flow algorithms can be broadly classified into dense optical flow method and sparse optical flow method. The dense optical flow method will match each point pixel on the image and calculate its offset, which has a higher accuracy for matching moving objects, but is more computationally intensive. The Lucas-Kanade (LK) optical flow method used in this paper is a typical algorithm in the sparse optical flow method. Compared with the dense optical flow method, this algorithm does not compute all pixel points point by point, but tracks a relatively small number of feature points, which are usually given by some specific corner detection algorithms (e.g., Shi-Tomasi algorithm), and uses them to represent the overall object motion.
The LK optical flow method adds the assumption of “spatial consistency” to the two basic assumptions of the original optical flow method, i.e., neighboring pixels in a certain area have similar variations. Based on this assumption, a small window of
The above method can be described by the following equations:
where
The system of Eq. 4 can be expressed in the form of the following matrices:
For the basic optical flow method, two unknown variables cannot be solved because there is only one optical flow equation. In contrast, there are
Pyramid LK Optical Flow Method
The LK optical flow method is based on the assumption that the magnitude of object motion is small, so only the first-order term is retained when the Taylor expansion is performed during the calculation of the constraint equations above, and large errors may occur when the magnitude of object motion is large. To solve this problem, the LK optical flow method can be improved by using the pyramid method.
As demonstrated in Figure 4, by downsampling the image, the pyramid LK optical flow method can reduce the larger displacements in the higher-level pyramid image to obtain a more accurate optical flow vector at that scale, and then scale up the higher-level vector as an initial guide for the next layer when solving layer by layer from the top down. At this time, the object position guided by the optical flow vector from the upper level zoomed in and the actual object position of the current layer will have errors, but the error is usually consistent with the scale of small movements, so it can be calculated on this basis to obtain the optical flow vector of the current layer, and repeated downward in turn to the original map of the bottom layer to obtain a more accurate optical flow vector under large movements.
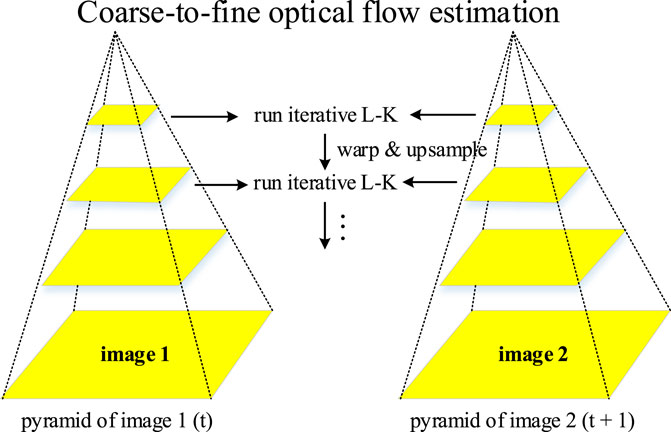
FIGURE 4. Lucas Kanade method: estimate the optical flow of black pixels. The pyramid method starts from the highest level of the pyramid (with the least details) to the lowest level of the pyramid (with rich details).
Proposed Method
Transformer Detection
Firstly, the transformer vibration video is read, and the specific position of the transformer is obtained in the first frame image, so as to detect the vibration in the region of interest. This paper combines transfer learning and YOLOv4 object detection model for transformer detection. Due to the limited number of transformer images, if YOLOv4 model is trained directly, the performance of the model on the test set is poor due to over fitting. In this paper, we use the idea of transfer learning for reference, use large data sets to pre-train the model, transfer the weights of the trained model, and establish YOLOv4 transformer learning model. The model is used to detect the transformer in the first image and get the transformer location area.
Feature Points Detection
In this paper, the Shi-Tomasi method is used to calculate the feature points. Because the characteristic points of the edge and peripheral area of the transformer have nothing to do with the vibration of the transformer, the introduction of these characteristic points is easy to cause interference, so it is necessary to set ROI (region of interest) as the feature point detection range. The first frame is converted to gray image, and the transformer position and its center point are obtained according to the prediction results of YOLOv4 model. In this paper, a region in the center of the transformer is set as the feature point detection range according to the proportion, and the transformer feature points in the first frame are calculated as the initial feature points. In addition, the number and quality of the generated feature points can be controlled by setting those maximum number, those quality level, the minimum distance between adjacent feature points, the size of those operation area and other parameters.
Transformer Vibration Detection
Using pyramid LK sparse optical flow method, the displacement vector of the feature points between the first frame and the next frame is calculated. Due to the inevitable error in the calculation process, it is not easy to take the displacement vector of one of the feature points to represent the overall displacement vector of the transformer. Usually, several feature points are calculated on a certain object, and the transformer can be regarded as a rigid object, that is, each feature point on the transformer will have an approximate displacement.
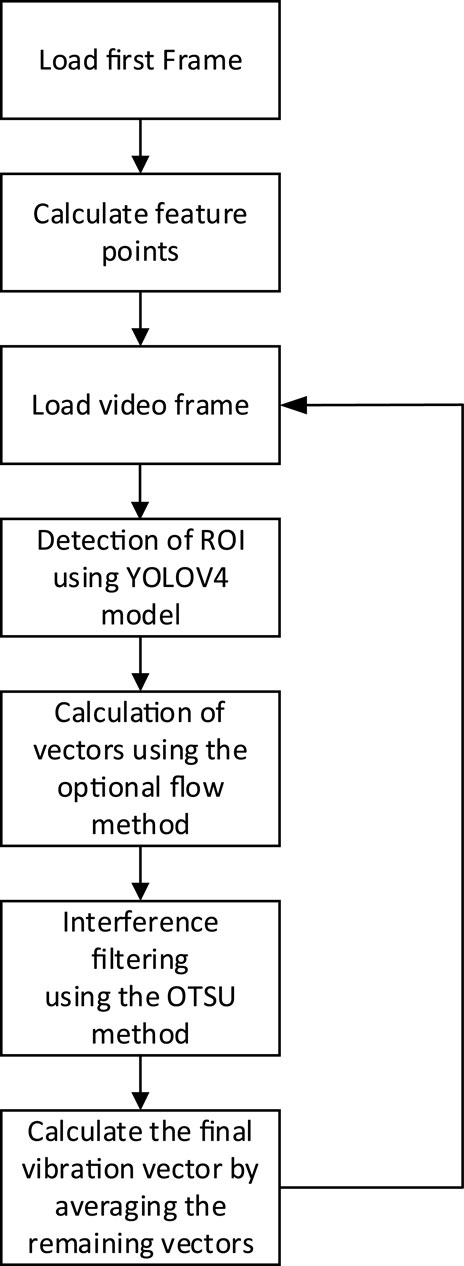
In this paper, firstly, the displacement vectors of all the feature points in the specific region of the transformer are calculated by the LK sparse optical flow method. Then the modulus of all vectors is calculated, and Otsu method is used to get the threshold value of vector modulus to remove the displacement vector with smaller modulus value. Finally, sum and average the remaining displacement vectors, and the average value is the displacement vector of the transformer in the image. By combining the transformer displacement and time interval between every two frames, the vibration velocity of the transformer can be calculated. Furthermore, the vibration data of transformer in three-dimensional space can be calculated by binocular vision. Figure 5 shows the flow chart of the proposed method.
Experimental Results and Analysis
Transformer Detection Experiments
Experimental Environment
The experimental environment for building YOLOv4 object detection model is windows 10 64 bit operating system, the CPU is 32-core Intel Xeon e5-2695 V3, the memory capacity is 32GB, the GPU is NVIDIA grid p40-24q, the NVIDIA driver version is 441.66, and the video memory size is 24 g. The deep learning framework used is tensorflow GPU 2.2, CUDA version is 10.1, cudnn version is 7.6.5.32.
Data Set Construction
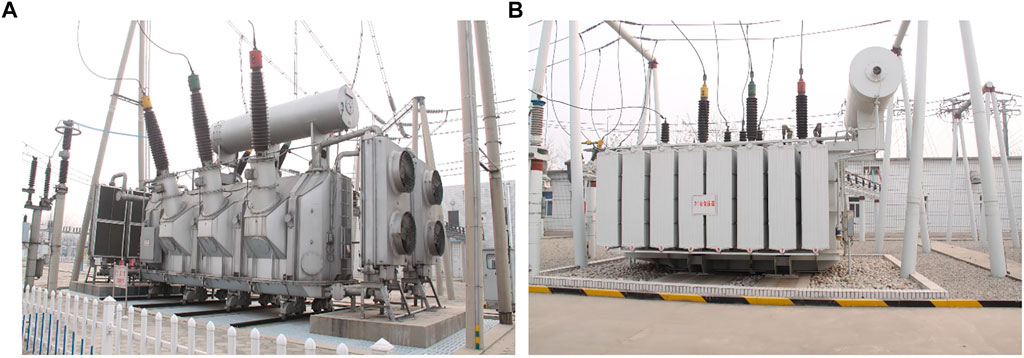
Transformer images are screened and sorted, and labels are made to construct transformer detection data set. The data set contains 489 transformer images of different types, different angles and different environments, as shown in Figure 6. The data set is randomly divided into training, validation and test set, with 396 images in the training set, 44 pictures in the validation set and 49 pictures in the test set. In the process of model training, random data enhancement is carried out on the training set data, including scaling, length-width distortion, flipping, gamut distortion and other operations.
YOLOv4 Model Performance and Transformer Detection Results
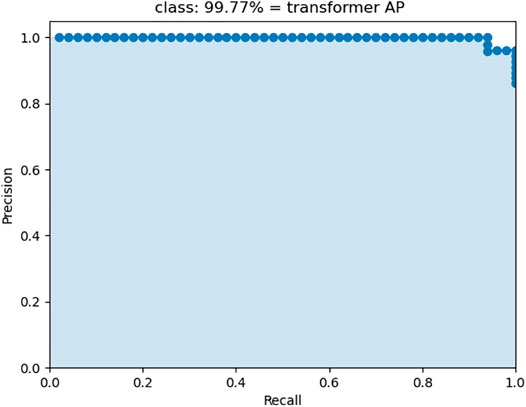
The concept of transfer learning is introduced into the model training process and YOLOv4 pre-trained model is used to help training. The model is iterated for 100 times, which is divided into freeze training and thaw training two stages. In the first 50 iterations, the weights of the first 249 layers are frozen, the batch size is set to 2, and the initial learning rate is set to 0.001. If the validation loss dose not decrease for three epochs, the learning rate would be automatically reduced by half. If the validation loss dose not decrease for 10 epochs, the training process would be stopped in advance. In the second 50 iterations, the weights of the first 249 layers are thawed and the batch size is set to 2. The initial learning rate is 0.0001, and the methods of learning rate decline and early stop are the same as those of the first stage. The AP curve of transformer test set is shown in Figure 7 as follows.
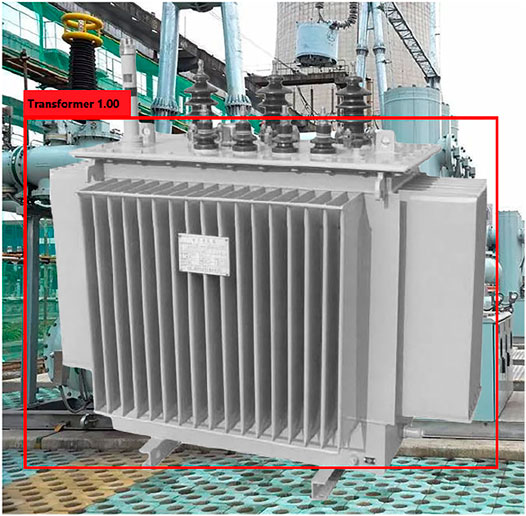
The AP of the transformer is 99.77%, indicating that YOLOv4 model can accurately detect the transformer. The detection result of a single transformer image is shown in Figure 8, where the area in the red box is the detected transformer area of interest.
Transformer Vibration Detection Experiments
In this paper, the synthetic transformer vibration video is used as the test data, and the transformer image is embedded into the background image as the foreground. The displacement vector of the transformer in each frame is manually set, which is compared with the vibration vector detection results of the proposed algorithm to evaluate the algorithm performance. The running environment of vibration vector detection algorithm is windows 10 64 bit operating system, the CPU is g4600, the GPU is gtx1050, the memory size is 8G, and the image size of the input video is
1) Vibration Vector Measurement Results and Analysis
In order to reduce interference, this paper does not calculate the feature points in the whole image area (as shown in Figure 9), but detects the transformer position through the YOLOv4 model, and selects a region in the center of the transformer as the feature point region of interest (as shown in Figure 10). In comparison, the feature points calculated in this region are more representative of the transformer itself, and it is more accurate to use these feature points to calculate the vibration vector of the transformer. Next, the pyramid LK sparse optical flow method is used to calculate the vibration displacement vector of these feature points between two adjacent frames. Then, we use Otsu algorithm to obtain a threshold of the modulus of these vibration vectors, and remove the vibration vectors whose modulus are less than the threshold to reduce the computational interference. Finally, the average value of all remaining vibration vectors is calculated as the vibration vector of the transformer.
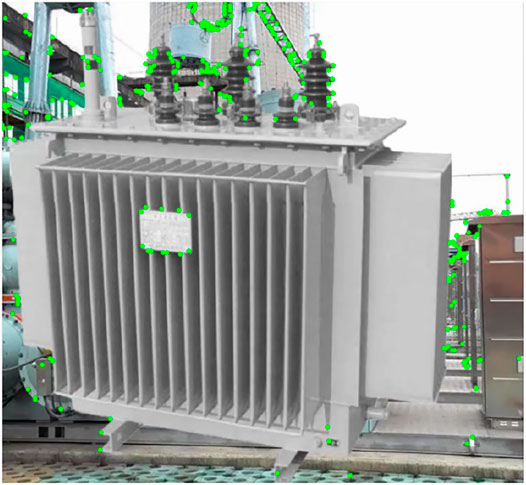
FIGURE 9. The feature points in the whole image area are represented by green dots. The peripheral feature points of the transformer will interfere with the calculation of the transformer vibration vector.
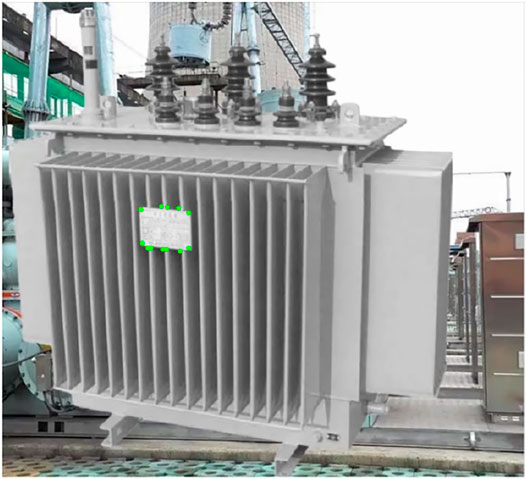
FIGURE 10. The feature points in the region of interest are represented by green dots, which can more accurately calculate the transformer vibration vector compared with the feature points in Figure 9.
The video synthesized in this paper restores the vibration pattern of the transformer in reality as much as possible, and the transformer image is manipulated by swinging back and forth, and also tested under different motion amplitudes, and some of the test data are recorded in Table 1.

TABLE 1. Comparison between the transformer vibration vectors calculated by the proposed algorithm and the vibration vectors which are assigned artificially.
It can be seen from the data in Table 1 that the error between the transformer displacement vector calculated by the proposed method and the artificially set data is small, and the accuracy is high, with significant advantages over methods without object detection. No matter in the state of low displacement or high displacement, the accurate results are obtained. In the real environment, the vibration data of transformer can also be obtained according to the proposed method, so as to analyze the vibration of transformer reliably. Except for the first frame, the processing time of single frame is about 11 m, which fully ensures the real-time performance of the algorithm.
To ensure the practicality of the method in this paper, experiments are conducted on other synthetic videos and the error rate is calculated to evaluate the performance of the algorithm in different scenarios.
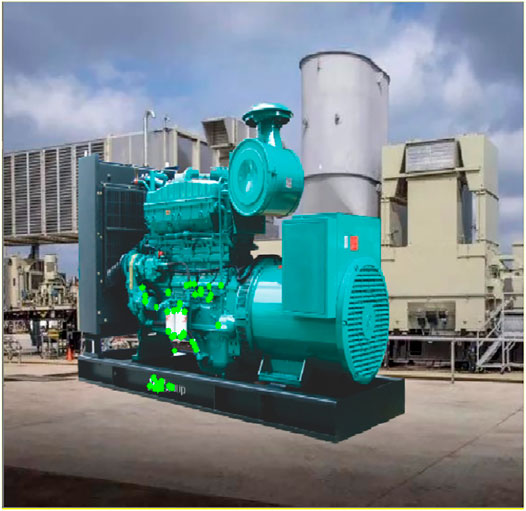
The vibration vector is measured from the generator synthesis video shows in Figure 11, and the comparison of the calculated results with the set amount is presented in the following Table 2. It can be seen that the proposed method still maintains excellent performance on different synthesis videos.

TABLE 2. Comparison between the generator vibration vectors calculated by the proposed algorithm and the vibration vectors which are assigned artificially.
Normalized root-mean-square error (NRMSE), root mean square error (RMSE), mean absolute error (MAE), mean absolute percentage error (MAPE), percentage change in variance (PCV) were introduced to calculate the error rate (Zhang et al., 2016; Bokde et al., 2020). The error metrics are defined as follows:
where
The vibration vectors of individual feature points in the two synthesized videos are calculated separately for each frame, and the calculation results are evaluated in comparison with the set standard value calculation errors using Eqs 7–11, and the results are shown in Table 3. It can be seen that the proposed method can maintain its accuracy on different synthesized videos and has some practicality.
2) Vibration Frequency Test Results and Analysis
The vibration vector calculated by the method in this paper is used to predict the pixel coordinates of the feature points in each frame, and the spectrogram of the feature point motion can be obtained by collecting these coordinates into a series and then performing FFT calculation, and the accuracy performance of the method can be analyzed according to the spectrogram. As shown in Figure 12, the blue curve is the theoretical spectrum calculated based on the predefined values of the synthesized video, and the red curve is the spectrum calculated by the method of this paper. It can be seen that the proposed method maintains a good stability and accuracy.
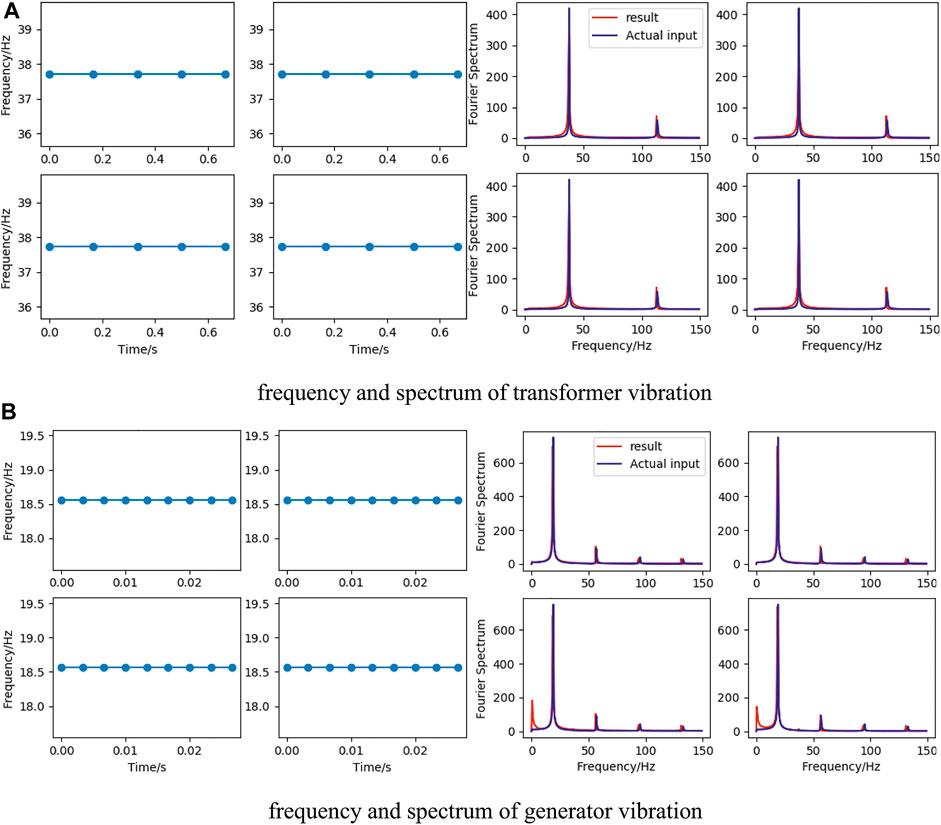
FIGURE 12. The vibration frequencies of four feature points, and comparison of four feature points spectra calculated by the artificially set vibration vectors and the proposed method. (A) frequency and spectrum of transformer vibration. (B) frequency and spectrum of generator vibration.
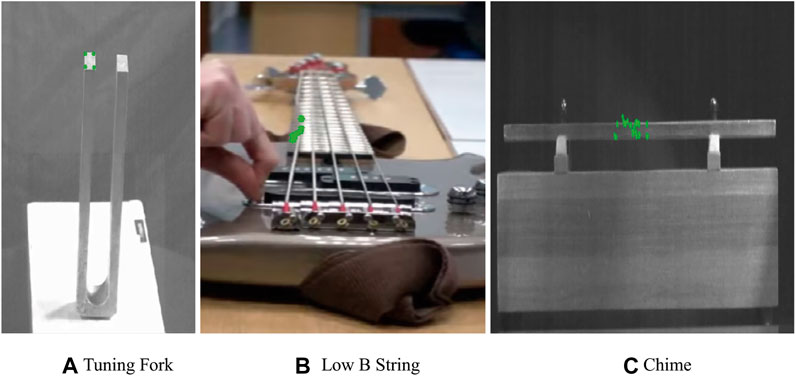
The following real videos as shown in Figure 13 are introduced to evaluate the methodology of this paper.
As can be seen in Figure 14, the motion spectrum of the four feature points in the same video is more consistent, which proves the anti-interference property of the method in this paper.
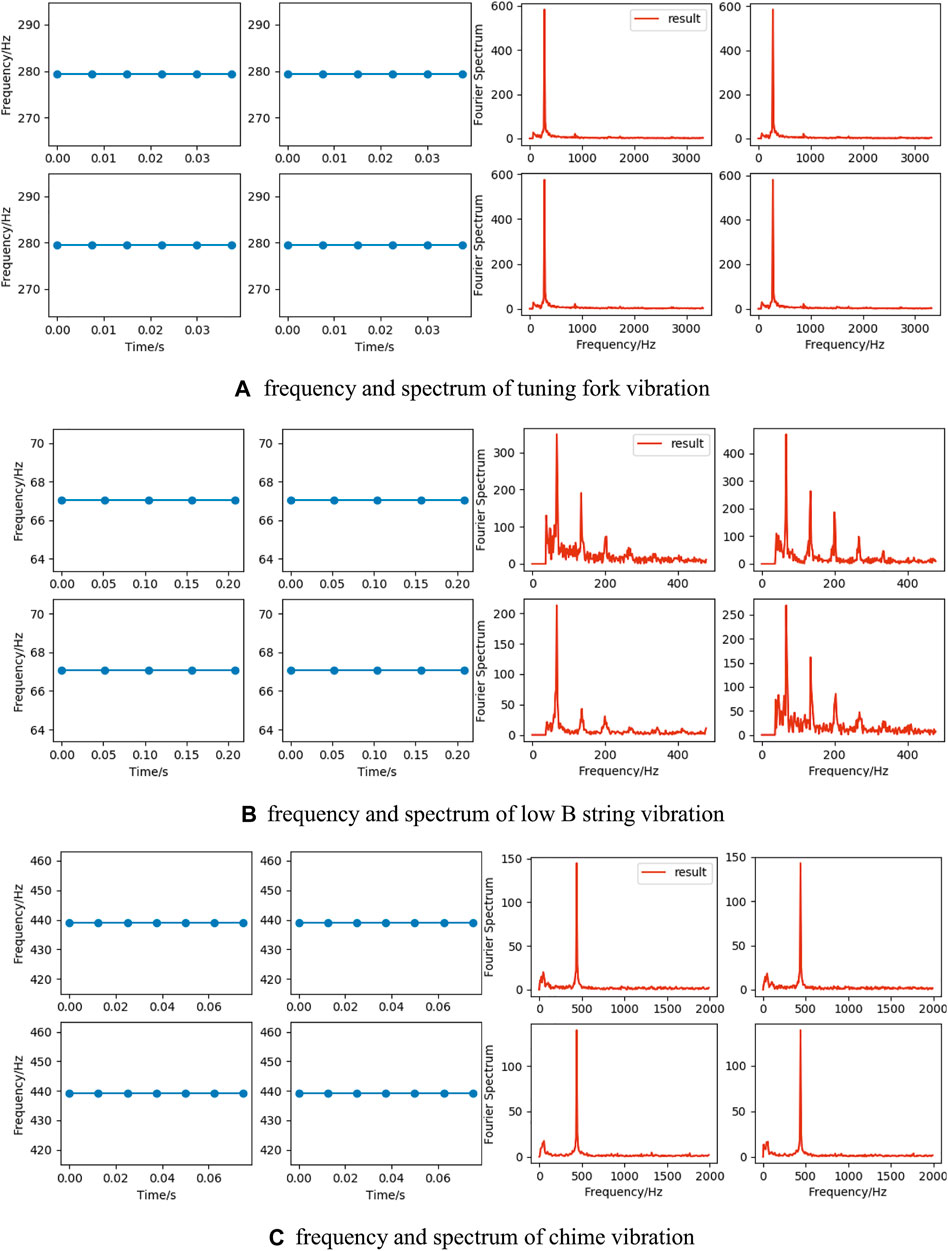
FIGURE 14. (A–C) are frequencies and spectra calculated by taking the motion coordinate sequences of four feature points in Tuning Fork, Low B String, and Chime videos, respectively. (A) frequency and spectrum of tuning fork vibration. (B) frequency and spectrum of low B string vibration. (C) frequency and spectrum of chime vibration.
The object vibration frequencies are obtained based on the motion spectra of the feature points calculated under the synthetic video and various real videos, and compared with the real frequency calculation errors using Eqs 9–11 to evaluate the algorithm performance. As can be seen from Table 4, the error of the calculation results of the vibration frequencies of objects in different videos by the method in this paper is very small, all within an acceptable range, which ensures its practicality.
Conclusion
This paper presents a real-time transformer vibration signal detection method based on video. Firstly, the precise positioning of power transformer is realized by YOLOv4 model. Secondly, the displacement vector of feature points is calculated by pyramid LK optical flow method within the range of interested transformer. Then, the interference term of displacement vector is filtered by Otsu algorithm. Finally, the vibration vector of transformer is calculated by vector average. Experimental results show that the proposed algorithm can accurately calculate the vibration vector and frequency, which provides an important basis for the real-time state evaluation of the power equipment.
Data Availability Statement
The original contributions presented in the study are included in the article/Supplementary material, further inquiries can be directed to the corresponding author.
Author Contributions
LS and HH contributed to conception and design of the study. LQ and WZ collected 489 images of different types of transformers. LQ and WZ synthesized the transformer and generator vibration video. LQ and WZ implemented the programming of the proposed vibration detection algorithm. LS wrote the first draft of the manuscript. All authors wrote sections of the manuscript. All authors contributed to manuscript revision, read, and approved the submitted version.
Conflict of Interest
LS and HH were employed by the company State Grid Shanghai Electric Power Research Institute.
The remaining authors declare that the research was conducted in the absence of any commercial or financial relationships that could be construed as a potential conflict of interest.
Publisher’s Note
All claims expressed in this article are solely those of the authors and do not necessarily represent those of their affiliated organizations, or those of the publisher, the editors and the reviewers. Any product that may be evaluated in this article, or claim that may be made by its manufacturer, is not guaranteed or endorsed by the publisher.
Acknowledgments
This work was supported by the science and technology project of State Grid Corporation of China (Project No.: B3094020000B).
References
Aoyama, T., Chikaraishi, M., Fujiwara, A., Li, L., Jiang, M., Inoue, K., et al. (2018). Vibration Sensing of a Bridge Model Using a Multithread Active Vision System. IEEE/ASME Trans. Mechatron. 23, 179–189. doi:10.1109/tmech.2017.2764504
Berler, Z., Golubev, A., Rusov, V., Tsvetkov, V., and Patterson, C. (2000). “Vibro-acoustic Method of Transformer Clamping Pressure Monitoring,” in IEEE International Symposium on Electrical Insulation, Anaheim, CA, USA, 5-5 April 2000, 263–266. doi:10.1109/ELINSL.2000.845503
Bokde, N. D., Yaseen, Z. M., and Andersen, G. B. (2020). ForecastTB-An R Package as a Test-Bench for Time Series Forecasting-Application of Wind Speed and Solar Radiation Modeling. Energies 13, 2578. doi:10.3390/en13102578
Borucki, S. (2012). Diagnosis of Technical Condition of Power Transformers Based on the Analysis of Vibroacoustic Signals Measured in Transient Operating Conditions. IEEE Trans. Power Deliv. 27, 670–676. doi:10.1109/TPWRD.2012.2185955
Cao, H., Lei, Y., and He, Z. (2013). Chatter Identification in End Milling Process Using Wavelet Packets and Hilbert-Huang Transform. Int. J. Machine Tools Manufacture 69, 11–19. doi:10.1016/j.ijmachtools.2013.02.007
Chen, J. G., Wadhwa, N., Cha, Y.-J., Durand, F., Freeman, W. T., and Buyukozturk, O. (2015). Modal Identification of Simple Structures with High-Speed Video Using Motion Magnification. J. Sound Vibration 345, 58–71. doi:10.1016/j.jsv.2015.01.024
Choi, A. J., and Han, J.-H. (2018). Frequency-based Damage Detection in Cantilever Beam Using Vision-Based Monitoring System with Motion Magnification Technique. J. Intell. Mater. Syst. Structures 29, 3923–3936. doi:10.1177/1045389X18799961
Diamond, D. H., Heyns, P. S., and Oberholster, A. J. (2017). Accuracy Evaluation of Sub-pixel Structural Vibration Measurements through Optical Flow Analysis of a Video Sequence. Measurement 95, 166–172. doi:10.1016/j.measurement.2016.10.021
Feng, D., Feng, M., Ozer, E., and Fukuda, Y. (2015). A Vision-Based Sensor for Noncontact Structural Displacement Measurement. Sensors 15, 16557–16575. doi:10.3390/s150716557
Feng, D., Scarangello, T., Feng, M. Q., and Ye, Q. (2017). Cable Tension Force Estimate Using Novel Noncontact Vision-Based Sensor. Measurement 99, 44–52. doi:10.1016/j.measurement.2016.12.020
Garcia, B., Burgos, J. C., and Alonso, A. M. (2006b). Transformer Tank Vibration Modeling as a Method of Detecting Winding Deformations-Part II: Experimental Verification. IEEE Trans. Power Deliv. 21, 164–169. doi:10.1109/TPWRD.2005.852275
Garcia, B., Burgos, J. C., and Alonso, A. (2006a). Transformer Tank Vibration Modeling as a Method of Detecting Winding Deformations-Part I: Theoretical Foundation. IEEE Trans. Power Deliv. 21, 157–163. doi:10.1109/TPWRD.2005.852280
Hati, A., and Nelson, C. W. (2019). $W$ -Band Vibrometer for Noncontact Thermoacoustic Imaging. IEEE Trans. Ultrason. Ferroelect., Freq. Contr. 66, 1536–1539. doi:10.1109/TUFFC.2019.2923909
Helfrick, M. N., Niezrecki, C., Avitabile, P., and Schmidt, T. (2011). 3D Digital Image Correlation Methods for Full-Field Vibration Measurement. Mech. Syst. Signal Process. 25, 917–927. doi:10.1016/j.ymssp.2010.08.013
Horn, B. K. P., and Schunck, B. G. (1981). Determining Optical Flow. Artif. Intelligence 17, 185–203. doi:10.1016/0004-3702(81)90024-2
Huang, M., Zhang, B., and Lou, W. (2018). A Computer Vision-Based Vibration Measurement Method for Wind Tunnel Tests of High-Rise Buildings. J. Wind Eng. Ind. Aerodynamics 182, 222–234. doi:10.1016/j.jweia.2018.09.022
Judd, M. D., Cleary, G. P., Bennoch, C. J., Pearson, J. S., and Breckenridge, T. (2002). “Power Transformer Monitoring Using UHF Sensors: Site Trials,” in IEEE International Symposium on Electrical Insulation, Boston, MA, USA, 7-10 April 2002, 145–149. doi:10.1109/ELINSL.2002.995899
Moya-Albor, E., Brieva, J., Ponce, H., and Martinez-Villasenor, L. (2020). A Non-contact Heart Rate Estimation Method Using Video Magnification and Neural Networks. IEEE Instrum. Meas. Mag. 23, 56–62. doi:10.1109/MIM.2020.9126072
Munir, B. S., and Smit, J. J. (2011). “Evaluation of Various Transformations to Extract Characteristic Parameters from Vibration Signal Monitoring of Power Transformer,” in Electrical Insulation Conference (EIC), Annapolis, MD, USA, 5-8 June 2011, 289–293. doi:10.1109/EIC.2011.5996164
Peng, C., Zeng, C., and Wang, Y. (2020). Camera-based Micro-vibration Measurement for Lightweight Structure Using an Improved Phase-Based Motion Extraction. IEEE Sensors J. 20, 2590–2599. doi:10.1109/JSEN.2019.2951128
Poudel, U. P., Fu, G., and Ye, J. (2005). Structural Damage Detection Using Digital Video Imaging Technique and Wavelet Transformation. J. Sound Vibration 286, 869–895. doi:10.1016/j.jsv.2004.10.043
Sarrafi, A., Mao, Z., Niezrecki, C., and Poozesh, P. (2018). Vibration-based Damage Detection in Wind Turbine Blades Using Phase-Based Motion Estimation and Motion Magnification. J. Sound Vibration 421, 300–318. doi:10.1016/j.jsv.2018.01.050
Son, K.-S., Jeon, H.-S., Park, J.-H., and Park, J. W. (2015). Vibration Displacement Measurement Technology for Cylindrical Structures Using Camera Images. Nucl. Eng. Tech. 47, 488–499. doi:10.1016/j.net.2015.01.011
Tian, L., and Pan, B. (2016). Remote Bridge Deflection Measurement Using an Advanced Video Deflectometer and Actively Illuminated LED Targets. Sensors 16, 1344. doi:10.3390/s16091344
Wadhwa, N., Chen, J. G., Sellon, J. B., Wei, D., Rubinstein, M., Ghaffari, R., et al. (2017). Motion Microscopy for Visualizing and Quantifying Small Motions. Proc. Natl. Acad. Sci. USA 114, 11639–11644. doi:10.1073/pnas.1703715114
Wadhwa, N., Wu, H.-Y., Davis, A., Rubinstein, M., Shih, E., Mysore, G. J., et al. (2016). Eulerian Video Magnification and Analysis. Commun. ACM 60, 87–95. doi:10.1145/3015573
Yang, Y., Dorn, C., Farrar, C., and Mascareñas, D. (2020). Blind, Simultaneous Identification of Full-Field Vibration Modes and Large Rigid-Body Motion of Output-Only Structures from Digital Video Measurements. Eng. Structures 207, 110183. doi:10.1016/j.engstruct.2020.110183
Yu, L., and Pan, B. (2017). Single-camera High-Speed Stereo-Digital Image Correlation for Full-Field Vibration Measurement. Mech. Syst. Signal Process. 94, 374–383. doi:10.1016/j.ymssp.2017.03.008
Zhang, D., Guo, J., Lei, X., and Zhu, C. (2016). A High-Speed Vision-Based Sensor for Dynamic Vibration Analysis Using Fast Motion Extraction Algorithms. Sensors 16, 572. doi:10.3390/s16040572
Zhang, D., Tian, B., Wei, Y., Hou, W., and Guo, J. (2019). Structural Dynamic Response Analysis Using Deviations from Idealized Edge Profiles in High-Speed Video. Opt. Eng. 58, 1–9. doi:10.1117/1.OE.58.1.014106
Zhao, J., Li, L., Xu, Z., Wang, X., Wang, H., and Shao, X. (2020). Full-scale Distribution System Topology Identification Using Markov Random Field. IEEE Trans. Smart Grid 11, 4714–4726. doi:10.1109/tsg.2020.2995164
Keywords: high proportion of renewable energy access, energy infrastructure, power transformer, vibration detection, YOLOv4 model, pyramid lucas-kanade optical flow, otsu algorithm
Citation: Su L, Huang H, Qin L and Zhao W (2022) Transformer Vibration Detection Based on YOLOv4 and Optical Flow in Background of High Proportion of Renewable Energy Access. Front. Energy Res. 10:764903. doi: 10.3389/fenrg.2022.764903
Received: 26 August 2021; Accepted: 18 January 2022;
Published: 14 February 2022.
Edited by:
Muhammad Wakil Shahzad, Northumbria University, United KingdomReviewed by:
Muhammad Ahmad Jamil, Northumbria University, United KingdomNeeraj Dhanraj Bokde, Aarhus University, Denmark
Copyright © 2022 Su, Huang, Qin and Zhao. This is an open-access article distributed under the terms of the Creative Commons Attribution License (CC BY). The use, distribution or reproduction in other forums is permitted, provided the original author(s) and the copyright owner(s) are credited and that the original publication in this journal is cited, in accordance with accepted academic practice. No use, distribution or reproduction is permitted which does not comply with these terms.
*Correspondence: Lunming Qin, bHVubWluZy5xaW5AU2hpZXAuZWR1LmNu
 Lei Su1
 Lunming Qin