 Facai Xing1
 Haiwen Fan
 Changgang Li
94% of researchers rate our articles as excellent or good
Learn more about the work of our research integrity team to safeguard the quality of each article we publish.
Find out more
ORIGINAL RESEARCH article
Front. Energy Res. , 05 January 2023
Sec. Process and Energy Systems Engineering
Volume 10 - 2022 | https://doi.org/10.3389/fenrg.2022.1119174
With the grid connection of a large number of distributed photovoltaics (PVs), the structure and operation mode of the distribution network are changed. Detailed modeling of the distribution network can accurately analyze the impact of these changes on the power system but leads to high model complexity and large amounts of calculation. Equivalent of the distribution network effectively reduces the model scale, where the static equivalent is the basis for the other equivalents. Most of the existing static equivalent methods target a few typical operation modes. However, they are unsuitable for multiple variable scenarios caused by PV power fluctuation. This paper proposes a static equivalent method of the distribution network with distributed PVs to adapt to complex and changeable operation modes. Firstly, a scenario generation method of PV and load power based on kernel density estimation and a copula function is proposed considering fluctuation and correlation of PV and load. Secondly, a parameter optimization method based on particle swarm optimization (PSO) is proposed to optimize the parameters in the static equivalent model of the distribution network under a single operation mode. Thirdly, an equivalent parameter estimation model based on convolutional neural network (CNN) is proposed to improve the efficiency of model parameter calculation under multiple operation modes. The effectiveness of the proposed method is verified under an example of an actual distribution network in Shandong, China. This method has efficiency and is suitable for multiple operating modes.
With the development of photovoltaic (PV) technology and the increasing demand for reducing transmission power losses on the generation side, the proportion of distributed PV power generation in the distribution network has increased. According to statistics (IEA, 2022), the new installed capacity of distributed PVs worldwide significantly exceeded that of centralized PVs in 2021. The installation of massive distributed PV changes the distribution network from a simple passive network to a complex active one. The direction of power flow in the distribution network is reversed in light load conditions. The influence of the distribution network on the bulk power system is becoming more and more complex (Gusnanda and Putranto, 2019; Li et al., 2021; Liu et al., 2021). Therefore, the impact of distributed PVs must be considered for large-scale power system analysis.
Detailed modeling of the complete distribution networks is a direct way to analyze large-scale power systems accurately. However, the quantity of distributed PVs is large due to their small capacity. It is inefficient to model the distribution network with all of its components. Hence it is necessary to find an equivalent method for the distribution network that can provide reasonable precision and retain the essential characteristics of the distribution network, PVs, and load. In this way, the system analysis model scale can be greatly reduced.
Static equivalent of the distribution network is the basis of other equivalent studies such as dynamic equivalent. It includes model structure design and parameter optimization. For the model structure, the most basic model equivalents the distribution network with distributed generators to a single load at the step-down transformer (Milanovic et al., 2013). This model has a simple structure but cannot distinguish distributed generators and load. Jeong et al. (2017) and Dai et al. (2018) adopted the generation-load model, which overcomes the above shortcomings. This model can directly simulate the characteristics of distributed generators and is widely used. The above studies generally apply the models to static equivalent of the distribution network at a specific operation mode. However, the operation state of the distribution network is time-varying due to the fluctuation of distributed PV and load. It is necessary to consider a variety of operation modes for the equivalent of the distribution network.
Regarding parameter optimization of equivalent models, Sadeghi and Sarvi (2009), Wang et al. (2014), and Zhao et al. (2018) used the least square method to identify model parameters with a single boundary node. However, the static equivalent of the distribution network is a strongly non-linear problem, and that is, the voltage, power, and other characteristics of the step-down transformer have non-linear relationships with distributed generation and load. The least square method is inefficient in solving these non-linear static equivalent problems. Zaker and Farjah (2021) used the genetic algorithm based on simulating biological evolution to calculate the model parameters. Genetic algorithm is one of the evolutionary algorithms that can solve non-linear problems. Nevertheless, it is complicated to implement because of mutation and crossover operations.
To solve the above problems, this paper proposes a static equivalent method of distribution network with distributed PV under multiple operation modes. Firstly, a joint distribution probability model of PV and load power is constructed considering the correlation between fluctuation of PV and load. Secondly, a static equivalent method of the distribution network with distributed PV based on particle swarm optimization (PSO) is proposed to provide equivalent samples. Thirdly, the parameter estimation model of the equivalent distribution network using convolutional neural network (CNN) is constructed to improve the parameter identification efficiency.
The remainder of this paper is organized as follows. Section 2 gives a power scenario generation method based on kernel density estimation, Frank copula, and Monte Carlo sampling. Section 3 proposes a static equivalent model of the distribution network with distributed PV and improves the PSO algorithm to identify the model parameters. Section 4 introduces the construction process of the proposed equivalent parameter estimation model based on CNN. Section 5 uses a practical distribution network to verify the proposed method.
The operation mode of the distribution network in this paper refers to the operation state of ensuring a safe and reliable power supply under the corresponding PV and load power scenario. This section generates the operation modes considering the correlation between fluctuation of PV and load power. Firstly, the probability density functions of PV and load power are generated based on kernel density estimation. Secondly, the joint probability distribution function of PV and load power is established based on the copula theory. Thirdly, PV and load power scenarios are generated using Monte Carlo sampling. Finally, some strategies are proposed to improve the convergence of power flow calculation when simulation software is used to analyze information such as power loss.
The fluctuation of PV and load power are generally fitted by the parametric and non-parametric estimation methods (Li et al., 2019). Parameter estimation methods use sample data to infer the probability distribution of statistics, which needs to specify the distribution of PV and load power in advance. But it is challenging to accurately depict the random characteristics of PV and load. Therefore, this paper uses a non-parametric estimation method, which does not rely on data following any particular probability distribution.
Kernel density estimation is a non-parametric method to estimate the probability density function of a random variable based on kernels as weights. Probability distribution characteristics of PV and load power can be mined based on known data (Xu et al., 2017). The non-parametric kernel density estimation function is expressed by Eq. 1. X1, X2, … , Xn are independent and identically distributed samples drawn from the historical power data with an unknown density
where n is the number of PV and load power samples; h is bandwidth; K (·)is the kernel function.
The bandwidth h determines the smoothness of the kernel density estimation function. To balance the effects of estimation bias and variance, the bandwidth is defined by Eq. 2.
where σ is the standard deviation of PV and load power samples.
The Gaussian kernel function is selected in this paper, which is described as
The distribution characteristics contained in the PV and load power sample can be revealed by kernel density estimation using all locations of the power sample point and choosing an appropriate bandwidth.
Due to the correlation between the PV and load power of each node in the distribution network, the joint probability distribution method should be applied to connect their marginal distribution functions. The copula function, which can construct two-dimensional distribution family, is used in this paper, as shown in Eq. 5.
where m is the number of power variables;
There are two common copulas, including Archimedean copulas and elliptical copulas. Archimedean copulas are widely used in practice because they allow correlation modeling in arbitrarily high dimensions with only one parameter. In the Archimedean copula functions, the frequently used Gumbel and Clayton copulas can only describe the positive relationship between variables, while Frank copulas consider both the positive and negative correlation of variables (Zhu et al., 2019). The relationship between PV and load power is often negative and complementary, so the Frank copula is selected in this paper (Zhu et al., 2019). The equation of the Frank copula is defined as
where CFr (·) is the Frank copula function; xi and yi are PV and load power at a certain time, i = 1, 2, … , 24; ui and vi are the marginal distribution functions of xi and yi; θ is the correlation coefficient of Frank copula.
The θ is estimated by the maximum likelihood estimation method. Maximum likelihood estimation is a method of estimating the parameters of an assumed probability distribution, given some observed data. It can be achieved by maximizing a likelihood function so that the observed data is most probable under the assumed statistical model.
After connecting the marginal distribution functions of PV and load power, the copula function should be sampled based on Monte Carlo sampling to generate power scenarios. The steps are as follows:
1) Generate random numbers a1, a2, … , aj in the interval [0,1].
2) Sample the copula function of the PV and load power. The marginal distribution of PV power in the ith hour is
3) Perform the above steps k times. The marginal distribution of PV and load power of k groups in the ith hour can be obtained by sampling k times.
4) Use the inverse function to convert
The power scenarios generated by sampling the copula function and inversing the marginal distribution consider the correlation between PV and load power.
In scenario generation, the PV and load power are variable. A power flow calculation program should be used in analyzing each scenario to get critical information, such as power loss of the distribution network. This paper uses the open-source Simulation Toolkit for Electrical Power Systems (STEPS) (Li et al., 2021) to calculate the power flow of the distribution network.
STEPS supports commonly used models of power system equipment, including bus, line, transformer, reactive power compensation, load, synchronous generator, wind power, PV, and DC. Newton-Raphson and PQ decoupling methods are supported to solve power flow. Moreover, STEPS provides the application programming interface named stepspy in Python. Some functions in this interface can automatically modify the load and PV power and obtain the power loss on the distribution network to facilitate the automatic simulation analysis.
Newton-Raphson method is used in this paper for power flow calculation. To improve the convergence, the calculation adopts a non-flat starting. That is, the power flow is solved based on the result of the last iteration. Moreover, the non-divergent optimal multiplier algorithm is adopted to introduce the optimal step size in each iteration of power flow calculation.
Considering the influence of PV and load power, the static equivalent of the distribution network under each operation mode should be performed respectively. This section provides the static equivalent model and parameter optimization method under a single operation mode. The equivalent results provide training samples for the CNN-based equivalent parameter estimation model in Section 4.
The static equivalent model of the distribution network with distributed PVs is shown in Figure 1. The model combines the power characteristics of the distributed PV and load. The power at the load side is taken from both the distributed PV and the transmission network. Equivalent PV and load power are calculated by Eqs 11, 12, respectively.
where SGi and SLi represent the power of each PV and load in the original distribution network, respectively; SGeq and SLeq represent the power of the equivalent PV and the equivalent load, respectively.
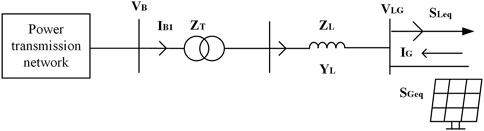
FIGURE 1. Static equivalent model of the distribution network.
The power loss of the transmission and distribution networks in the actual power systems accounts for about 6%–10% of the total power generation. Moreover, the transformer loss of the distribution network accounts for half of the total power loss. Therefore, the power loss cannot be neglected in the static equivalent of the distribution network because it affects the model accuracy. To make the difference of the network power loss as small as possible, this paper uses PSO to optimize model parameters.
PSO is a bionic algorithm that imitates the foraging behavior of birds and belongs to one of the evolutionary algorithms. It starts from the random interval, finds the optimal solution by iteration, and evaluates the quality of the solution by fitness. Figure 2 is the flow chart of PSO. The procedure for optimizing the equivalent model parameters based on PSO is as follows:
1) Initialize the parameters of the PSO algorithm, including particle search dimension, particle swarm size, inertia weight, individual learning factor, group learning factor, velocity, and location limit.
2) Randomly initialize the velocity and location of each particle. The particles in the PSO algorithm are equivalent model parameters, including transformer reactance, line impedance, and line susceptance.
3) Update the velocity and location of model parameters. The velocity update equation for each particle is
where vnew is the particle velocity in this iteration; ω is the inertia weight; v is the particle velocity in the last iteration; b1 is the individual learning factor; b2 is the group learning factor; r1 and r2 are the random numbers in the interval [0,1]; l is the particle location in the last iteration; lb is the optimal historical location of the particle; lg is the optimal global location of the population.
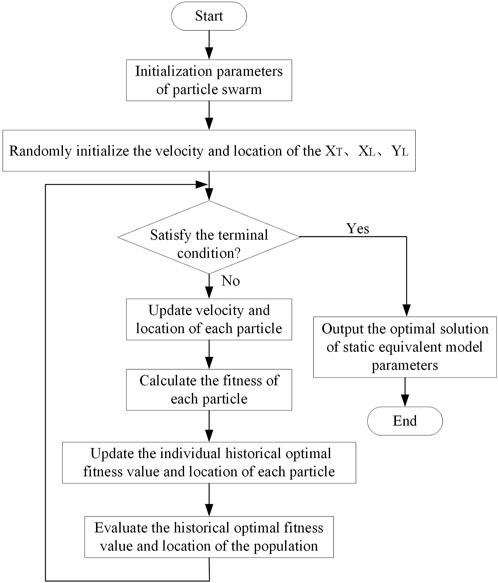
FIGURE 2. Flow chart of PSO.
The location update equation for each particle is
where lnew represents the particle location in this iteration.
4) Calculate the fitness. The fitness is defined as the root mean square error (RMSE) of network power loss. It can be obtained by Eq. 15.
where RMSEi is the fitness of the ith particle; PL and QL are the active power loss and reactive power loss of the initial network, respectively;
5) Update the optimal historical fitness and location of each particle and population. If the fitness calculated in Step 4) is less than the optimal historical fitness of each particle and population, RMSEi is taken as the optimal fitness, and lnew is taken as the optimal location.
6) Check for convergence. The convergence condition is that fitness is less than the threshold or the number of iterations reaches the maximum. If the convergence condition is met, the optimization progress is terminated, and the optimal global locations of particles are outputted as the result of transformer reactance, line impedance, and susceptance. Otherwise, return to Step 3) to continue to cycle.
The basic PSO algorithm has strong global optimization ability and generality. However, due to the random initial values of equivalent model parameters and fixed inertia weight, the convergence speed of the algorithm is slow. In this paper, the process of optimizing model parameters based on PSO is improved to solve the problem.
1) Selection of initial values
In general, the parameters of the initial equivalent model generated by random sampling are scattered and difficult to converge to the optimal global solution. Therefore, this paper takes the optimal results obtained by the previous optimization as the initial values of the optimization in the current operation mode to improve the search speed of the algorithm.
2) Improvement of inertia weights
Fixed inertia weights in PSO cannot balance global and local optimization capabilities well. In the parameter identification process, a robust global optimization ability is needed to escape local minima in early iterations, and a stronger local optimization ability for the whole population is needed in later iterations. Therefore, this paper uses a ω dynamic adaptive inertia weight algorithm (Vasudevan and Sinha., 2018) to improve the PSO, as shown in Eqs 16, 17.
where ωmax and ωmin are the maximum and minimum inertia weights, respectively; itmax is the maximum iteration number; c is a fixed constant, and the larger it is, the faster the inertia weight increases.
It is inefficient to repeat the static equivalent for each operation mode of the distribution network. Therefore, CNN is used to build a static equivalent parameter estimation model, which has a feature extraction function and good generalization ability. In this case, the efficiency of static parameter optimization in the distribution network can be improved in practical applications.
CNN is a non-probabilistic deep network with convolution calculation (Mitiche et al., 2020), which can effectively extract features. It usually consists of convolutional, pooling, and fully connected layers. Convolutional layers convolve the input features and pass the result to the next layer. Pooling layers reduce the feature dimension and training parameters while ensuring that critical information is not lost (Rai et al., 2021). After several convolutional and pooling layers, the final regression analysis is done via fully connected layers. This paper uses one-dimensional CNN for equivalent parameter estimation because it extracts one-dimensional sequence features without arranging and reconstructing them. The structure of CNN is shown in Figure 3. It contains two convolutional layers and two pooling layers.
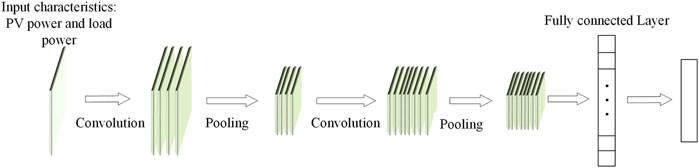
FIGURE 3. Structure of CNN.
The original input features of CNN should contain the key factors that affect the equivalent parameters. The static equivalent parameters of the distribution network change with the PV and load power. In this paper, considering the influence of operation mode, PV and load power are taken as input characteristics; while transformer and line parameters in the static equivalent model are taken as output. Due to the fast calculation of CNN, this method can realize real-time estimation of the distribution network equivalent parameters considering the PV and load fluctuation. Figure 4 shows the construction process of the static equivalent parameter estimation model based on CNN.
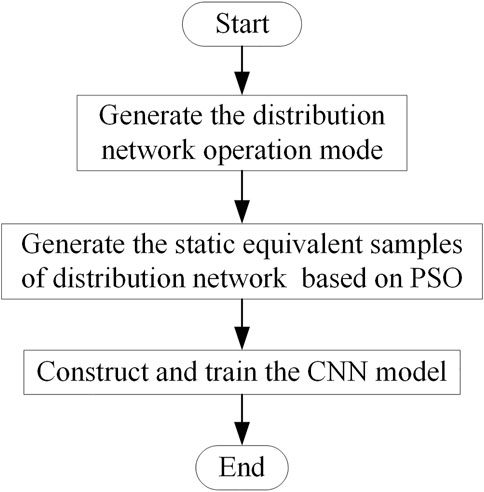
FIGURE 4. Modeling of static equivalent parameter estimation.
Firstly, the PV and load power scenarios are generated using kernel density estimation and the copula function based on historical measured data. These power scenarios are selected to calculate the power flow and generate operation mode of the distribution network. Secondly, generate the static equivalent samples of the distribution network with distributed PVs under each operation mode. The equivalent parameters are optimized by PSO. Thirdly, a static equivalent parameter estimation model is constructed based on CNN, which is trained by the equivalent samples generated in the previous step.
The activation function plays a vital role in CNN model learning and understanding non-linear features. Since the static equivalent of the distribution network belongs to a multiple regression problem, the activation function of the fully connected layer is Linear function. The activation functions of other layers are set as ReLU function. ReLU is commonly used because it trains the neural network several times faster without a significant penalty to generalization accuracy.
The following strategies are used in this paper to train the equivalent parameter estimation model based on CNN. The convolutional layer is constructed using Conv1D from Keras module. The pooling layer uses maximum pooling to realize downsampling and reduce the complexity of CNN computation. The mini-batch optimization strategy and Adam algorithm are adopted in the training process. The weights of neurons in each layer are updated through the Adam optimization algorithm and loss minimization function. The mean square error is defined as the loss function.
The equivalent samples are divided into training, validation, and test sets. The standard score method is selected to normalize the input power features. This method can avoid the phenomenon that part of the data is ignored due to the significant difference in the sample. For PV and load power, the standardized way is
where z is the standardized PV or load power; p is PV power or load power;
Figure 5 shows an example system to verify the effectiveness of the proposed static equivalent method for the distribution network. It uses a distribution network with distributed PVs in Shandong, China. There are thirty-five nodes in the distribution network, including five PV nodes and fourteen load nodes. The bus voltage level of the distributed PVs connected to the network is 380 V. The transmission network is represented by the generator at node 1 (balance node).
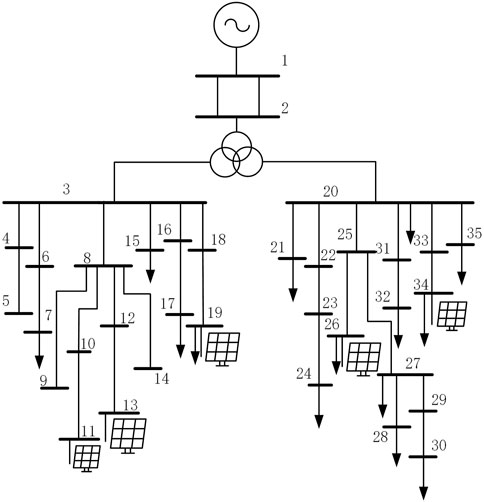
FIGURE 5. A 35-node distribution network.
In the actual operation of the distribution network with distributed PV, the fluctuation of PV and load power affects the accuracy of the static equivalent model. Therefore, the actual operation scenarios of distributed PV and load power are generated based on kernel density estimation and copula.
The PV and load power of the above region in 2021 are taken as the example. The sampling interval of power is 1 hour, and the non-parametric kernel density estimation is used to fit the PV and load power of each hour. The fitting result at 9:00 a.m. is shown in Figure 6.
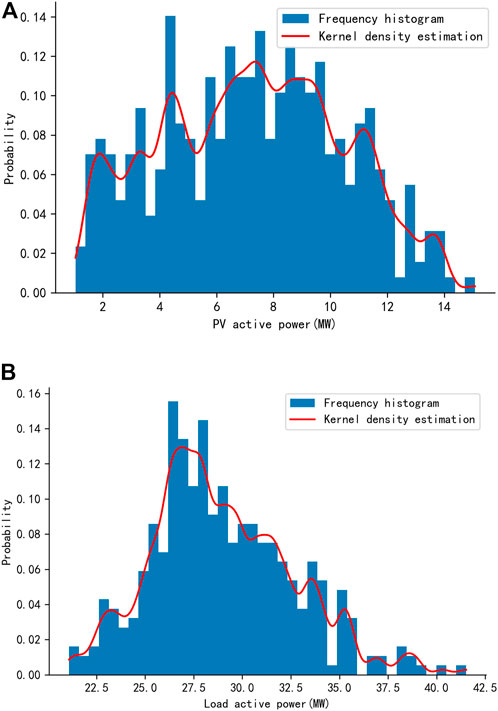
FIGURE 6. Frequency distribution histogram of (A) PV active power, and (B) load active power at 9 a.m. and their fitting results.
Then, the joint distribution of PV and load active power in this region is established based on the Frank copula function, as shown in Figure 7. The parameter θ in Frank copula is estimated by the maximum likelihood estimation method. It has different values for different operation modes. θ is estimated to be 6.59 at 9:00 a.m.
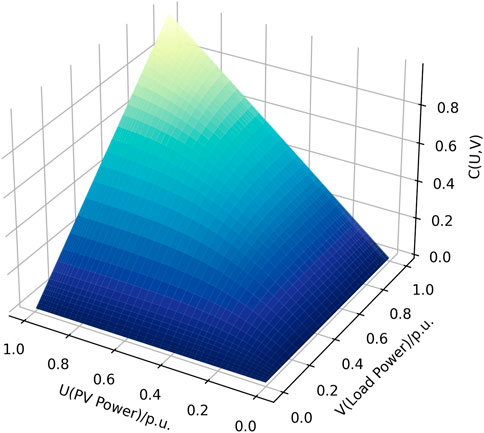
FIGURE 7. Joint distribution function based on Frank copula.
Based on the scenario generation method in Section 2, a total of three hundred and fifty PV-load power scenarios are generated through sampling, as shown in Figures 8, 9.
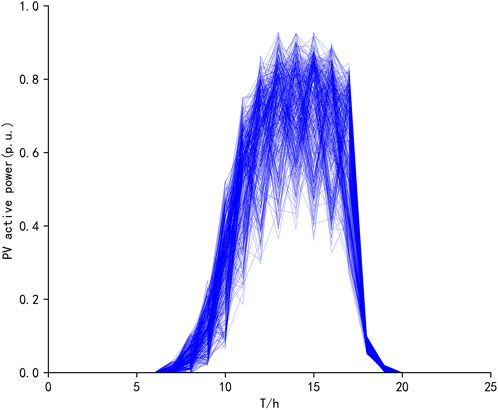
FIGURE 8. Scenarios of distributed PV power.
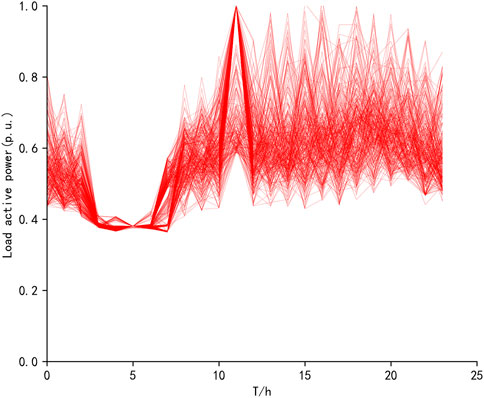
FIGURE 9. Scenarios of load power.
From the perspective of the correlation of generated scenarios, the PV and load power in each scenario have the same or opposite change trend in some periods, which shows a particular correlation. The power difference among the scenarios is significant and has seasonal characteristics. The scenario generation results can effectively simulate the fluctuation and correlation between PV and load power in this region.
Static equivalent of the distribution network is performed separately for the different operation modes. The transformer reactance, line impedance, and susceptance of the model are optimized by PSO. Table 1 shows the parameter optimization results of the equivalent model and RMSE of power loss under ten typical operation modes. The active power and model parameters in the table are all per unit value.
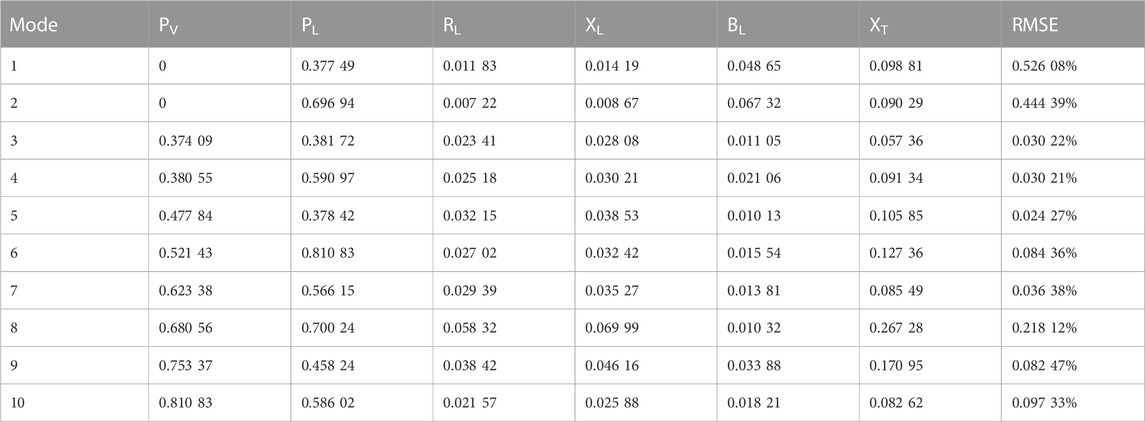
TABLE 1. The equivalent parameters under different operation modes and RMSE of network loss.
It can be seen that each RMSE is relatively small, indicating that the power loss of the equivalent network is close to the original power loss. It is proved that the equivalent method is accurate in a single operation mode.
The equivalent transformer and line parameters are compared with their averages for each operation mode, as shown in Figures 10, 11. The parameters calculated following distinct operation modes are different. Moreover, the transformer parameters have the largest differences from their average value.
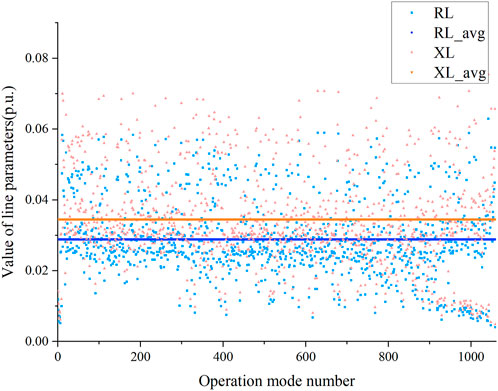
FIGURE 10. Comparison of equivalent line parameters and their averages.
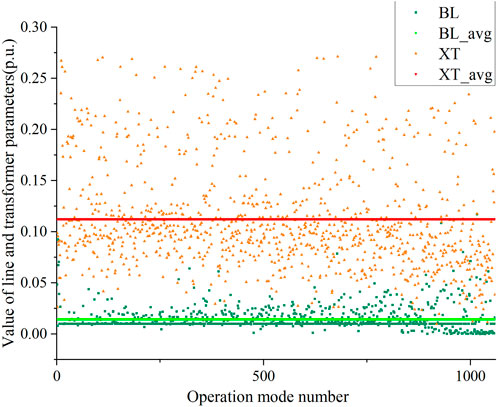
FIGURE 11. Comparison of equivalent line and transformer parameters and their averages.
The average of each parameter is substituted into the static equivalent model for each operation mode. Figure 12 shows the RMSE of power loss in the distribution network. The average of RMSE is 9.9896%, which is greater than the allowable error in the engineering. As a result, static equivalent of the distribution network in different operation modes cannot be achieved by a single set of parameters.
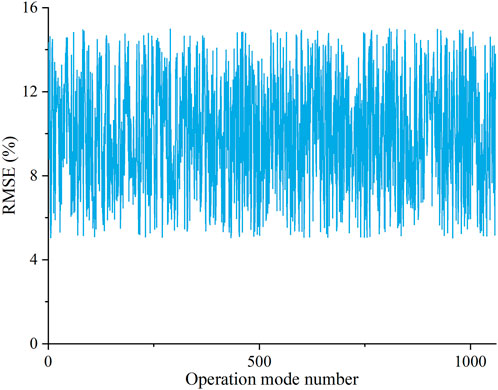
FIGURE 12. The RMSE calculated by substituting the parameter averages into the equivalent model.
One thousand and sixty samples are generated by the proposed static equivalent method, each representing a different operation mode. The training, validation, and test sets are all randomly selected from the samples in the proportion of 60%, 20%, and 20%, respectively.
One-dimensional CNN in this paper comprises two convolutional layers, two pooling layers, and one fully connected layer. The PV and load power on each bus are input features of the CNN model. The training times are set to three hundred times. Table 2 displays the training results of the CNN model. It can be seen that the parameter estimation of the static equivalent model based on CNN has high accuracy.

TABLE 2. Training results of CNN.
The equivalent parameters estimated by CNN are substituted into the static equivalent model of the distribution network. The RMSE of network power loss for each operation mode is displayed in Figure 13. The maximum value of RMSE is 1.6998%, and the average is 1.1968%. Thus, the static equivalent parameter estimation model based on CNN for the distribution network with distributed PVs is verified.
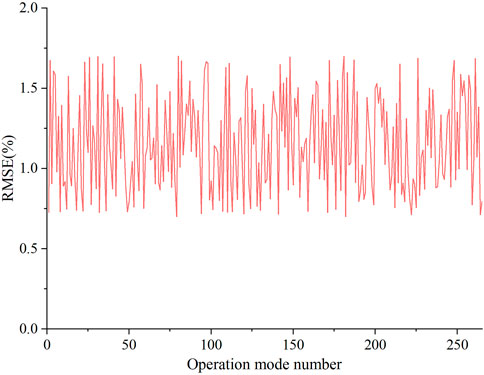
FIGURE 13. RMSE of the equivalent parameter estimation model based on CNN.
This paper proposes a power scenario generation strategy based on kernel density estimation and copula function, which considers the correlation between fluctuation of PV and load. A static equivalent method for the distribution network with distributed PVs is proposed to analyze the influence of PVs on the simplified distribution network. The essential characteristics of the PVs, transmission lines, and loads are retained in this equivalent model. PSO with improved inertia weights is used to determine line and transformer parameters and has a quick convergence rate. To improve the efficiency of parameter identification, CNN is used to estimate static equivalent parameters of the distribution network with multiple operation modes. The example demonstrates the high accuracy of the proposed method.
In addition to the network power loss, the sensitivity of the distribution network also has an impact on the accuracy of the static equivalent model. More study is required to analyze the sensitivity of distribution networks with distributed PVs in static equivalent.
The raw data supporting the conclusion of this article will be made available by the authors, without undue reservation.
FX and XL contributed to the conception and design of the equivalent method. HF wrote the core code of the equivalent program and completed the first draft of the manuscript. KZ and SL collected and organized the original data. KZ, SL, and CL contributed to the manuscript revision and proofread and approved the submitted version.
This research is supported by Project “Refined Modelling and Simulation Technology for Large-Scale Power Systems Considering Dynamic Characteristics of Renewable Power Generation” funded by State Grid Shandong Electric Power Company under Grant No. 520626210043. Key Development Project of Department of Science and Technology (2015C03Bd051).
Thanks for the support of State Grid Shandong Electric Power Company, China.
FX and SL were employed by Electric Power Research Institute, State Grid Shandong Electric Power Company. XL and KZ were employed by Shandong Electric Power Company, State Grid Corporation of China.
The remaining authors declare that the research was conducted in the absence of any commercial or financial relationships that could be construed as a potential conflict of interest.
All claims expressed in this article are solely those of the authors and do not necessarily represent those of their affiliated organizations, or those of the publisher, the editors and the reviewers. Any product that may be evaluated in this article, or claim that may be made by its manufacturer, is not guaranteed or endorsed by the publisher.
Dai, W., Yu, J., Liu, X., and Li, W. (2018). Two-tier static equivalent method of active distribution networks considering sensitivity, power loss and static load characteristics. International Journal of Electrical Power & Energy Systems. 100, 193–200. doi:10.1016/j.ijepes.2018.02.032
Gusnanda, A. F., and Putranto, L. M. (2019). “Effect of distributed photovoltaic generation installation on voltage profile: A case study of rural distribution system in yogyakarta Indonesia,” in International Conference on Information and Communications Technology (ICOIACT), Yogyakarta, Indonesia, October 2019 (IEEE), 750–755. doi:10.1109/icoiact46704.2019.8938534
International Energy Agency (Iea), (2022). Solar PV analysis. Available at: https://www.iea.org/reports/solar-pv.
Jeong, M., Kim, Y., Moon, S., and Hwang, P. (2017). Optimal voltage control using an equivalent model of a low-voltage network accommodating inverter-interfaced distributed generators. Energies (Basel) 10 (8), 1180. doi:10.3390/en10081180
Li, C., Wu, Y., Zhang, H., Ye, H., Liu, Y., and Liu, Y. (2021b). Steps: A portable dynamic simulation Toolkit for electrical power system studies. IEEE Transactions on Power Systems. 36 (4), 3216–3226. doi:10.1109/TPWRS.2020.3045102
Li, G., Lu, W., Bian, J., Qin, F., and Wu, J. (2019). Probabilistic optimal power flow calculation method based on adaptive diffusion kernel density estimation. Frontiers in Energy Research. 7, 128. doi:10.3389/fenrg.2019.00128
Li, P., Mi, Y., Liu, N., Zhou, Y., Yu, H., and Ji, H. (2021a). Editorial: Flexible and active distribution networks. Frontiers in Energy Research. 9, 288. doi:10.3389/fenrg.2021.687129
Liu, X., Fan, X., and Fang, W. (2021). Three-phase dynamic power flow algorithm for active distribution networks with multiple types of distributed power sources. Shandong Electron. Power 48 (06), 44–49. doi:10.3969/j.issn.1007-9904.2021.06.009
Milanovic, J. V., Yamashita, K., Martinez Villanueva, S., Djokic, S. Z., and Korunovic, L. M. (2013). International industry practice on power system load modeling. IEEE Transactions on Power Systems. 28 (3), 3038–3046. doi:10.1109/TPWRS.2012.2231969
Mitiche, I., Nesbitt, A., Conner, S., Boreham, P., and Morison, G. (2020). 1D-CNN based real-time fault detection system for power asset diagnostics. IET Generation, Transmission & Distribution. 14 (24), 5766–5773. doi:10.1049/iet-gtd.2020.0773
Rai, P., Londhe, N. D., and Raj, R. (2021). Fault classification in power system distribution network integrated with distributed generators using CNN. Electric Power Systems Research. 192, 106914. doi:10.1016/j.epsr.2020.106914
Sadeghi, M., and Sarvi, G. A. (2009). “Determination of ZIP parameters with least squares optimization method,” in IEEE Electrical Power & Energy Conference (EPEC), Montreal, Canada, October 2009 (IEEE).1. doi:10.1109/EPEC.2009.5420883
Vasudevan, B., and Sinha, A. K. (2018). Reliability improvement of reconfigurable distribution system using ga and PSO. Electrical Engineering. 100 (2), 1263–1275. doi:10.1007/s00202-017-0580-9
Wang, Z., and Wang, J. (2014). Time-varying stochastic assessment of conservation voltage reduction based on load modeling. IEEE Transactions on Power Systems. 29 (5), 2321–2328. doi:10.1109/TPWRS.2014.2304641
Xu, L., Wang, Z., and Liu, Y. (2017). The spatial and temporal variation features of wind-sun complementarity in China. Energy Conversion and Management. 154, 138–148. doi:10.1016/j.enconman.2017.10.031
Zaker, B., and Farjah, E. (2021). “Measurement-based equivalent model of distribution networks considering static and dynamic loads,” in 2021 11th Smart Grid Conference (SGC), Tabriz, Iran, December 2021 (IEEE), 1–5. doi:10.1109/SGC54087.2021.9664086
Zhao, J., Wang, Z., and Wang, J. (2018). Robust time-varying load modeling for conservation voltage reduction assessment. IEEE Transactions on Smart Grid. 9 (4), 3304–3312. doi:10.1109/TSG.2016.2630027
Zhu, Q., Wang, S., Chen, Z., He, Y., and Xu, Y. (2019). “A virtual sample generation method based on kernel density estimation and copula function for imbalanced classification,” in 8th Data Driven Control and Learning Systems Conference (DDCLS), Dali, ChinaMay 2019 (IEEE), 969–975. doi:10.1109/DDCLS.2019.8908870
Keywords: distributed photovoltaic, distribution network, static equivalent, kernel density estimation, copula function, particle swarm optimization, convolutional neural networks
Citation: Xing F, Li X, Fan H, Zhao K, Li S and Li C (2023) Static equivalent of distribution network with distributed PV considering correlation between fluctuation of PV and load. Front. Energy Res. 10:1119174. doi: 10.3389/fenrg.2022.1119174
Received: 08 December 2022; Accepted: 21 December 2022;
Published: 05 January 2023.
Edited by:
Liansong Xiong, Xi’an Jiaotong University, ChinaReviewed by:
Changcheng Li, Guangxi University, ChinaCopyright © 2023 Xing, Li, Fan, Zhao, Li and Li. This is an open-access article distributed under the terms of the Creative Commons Attribution License (CC BY). The use, distribution or reproduction in other forums is permitted, provided the original author(s) and the copyright owner(s) are credited and that the original publication in this journal is cited, in accordance with accepted academic practice. No use, distribution or reproduction is permitted which does not comply with these terms.
*Correspondence: Haiwen Fan, MTU2NTA1MTUyNTNAMTYzLmNvbQ==
Disclaimer: All claims expressed in this article are solely those of the authors and do not necessarily represent those of their affiliated organizations, or those of the publisher, the editors and the reviewers. Any product that may be evaluated in this article or claim that may be made by its manufacturer is not guaranteed or endorsed by the publisher.
Research integrity at Frontiers
Learn more about the work of our research integrity team to safeguard the quality of each article we publish.