 Bin Li
 Mingzhe Li
 Jilei Ye
95% of researchers rate our articles as excellent or good
Learn more about the work of our research integrity team to safeguard the quality of each article we publish.
Find out more
ORIGINAL RESEARCH article
Front. Energy Res. , 18 January 2023
Sec. Process and Energy Systems Engineering
Volume 10 - 2022 | https://doi.org/10.3389/fenrg.2022.1074916
This article is part of the Research Topic Advanced Technologies for Planning and Operation of Prosumer Energy Systems, volume II View all 30 articles
As a new type of flexible regulation resource, energy storage systems not only smooth out the fluctuation of new energy generation but also track the generation scheduling combined with new energy power to enhance the reliability of new energy system operations. In recent years, installing energy storage for new on-grid energy power stations has become a basic requirement in China, but there is still a lack of relevant assessment strategies and techno-economic evaluation of the size determination of energy storage systems from the perspective of new energy power stations. Therefore, this paper starts from summarizing the role and configuration method of energy storage in new energy power stations and then proposes multidimensional evaluation indicators, including the solar curtailment rate, forecasting accuracy, and economics, which are taken as the optimization targets for configuring energy storage systems in PV power stations. Lastly, taking the operational data of a 4000 MWPV plant in Belgium, for example, we develop six scenarios with different ratios of energy storage capacity and further explore the impact of energy storage size on the solar curtailment rate, PV curtailment power, and economics. The method proposed in this paper is effective for the performance evaluation of large PV power stations with annual operating data, realizes the automatic analysis on the optimal size determination of energy storage system for PV power stations, and verifies the rationality of the principle for configuring energy storage for PV power stations in some regions of China.
1) This paper starts by summarizing the role and configuration method of energy storage in new energy power station and then proposes a new evaluation index system, including the solar curtailment rate, forecasting accuracy, and economics, which are taken as the optimization targets for configuring energy storage system in PV power stations.
2) It calculates the forecasting accuracy of PV power and the penalty cost for each month in terms of penalty rules in a certain region, provides the specific algorithm process of energy storage sizing, and derives the simulation results.
3) The method proposed in this paper is applicable to the analysis of the operating characteristics of large PV power stations within the whole year and realizes the automatic analysis of the optimal scheme for the configuration with energy storage on PV power stations.
In recent years, solar energy has been widely regarded as one of the largest green energy and plays a major role in modern power system (Ndebele, 2020). Combined with the “carbon peak and carbon neutral” target proposed by China (Qian et al., 2022), it is expected that by 2030, the installed capacity of domestic PV power generation will exceed 1000 GW (Kut et al., 2021., Meanwhile, by the end of 2021, the cumulative installed solar power capacity in Germany reached 66.5 GW and is expected to exceed 100 GW by 2030. In addition, Australia’s installed capacity has also reached 25.3 GW (Ali et al., 2019; Apeh et al., 2022).
However, there remain two major issues when integrating it into the power grid due to the consequent intermittent and fluctuating features (Chao, 2011; Kim et al., 2020). In addition, the grid dispatching center uses the forecasting power of the PV power station as reference for scheduling plan, but there is still a large deviation between forecasting power and actual generation (Keeratimahat et al., 2021), which may not only cause the occurrence of PV curtailment (Bird et al., 2016; Zhang et al., 2022a) but also result in low system reliability and security due to inadequate backup resources. Furthermore, it is possible to face high penalty for PV power station (Azimov and Avezova, 2022).
Energy storage is one of the most effective solutions to smooth out new energy power fluctuations (Chen et al., 2021; Yang et al., 2022), promote high penetration of grid-connected green energy, and reduce the forecasting deviations of PV power, because of its flexible dual characteristics of charging and discharging (Lutsenko and Fetsov, 2020). Therefore, the development of energy storage system will promote energy conservation and emission reduction (Lu et al., 2022). However, the initial investment cost of energy storage is high (Du et al., 2022), which makes it necessary to figure out a reasonable configuring capacity. J. Li et al. (2020) propose a capacity optimization method for combined PV and storage systems, which considers the power allocation for PV and storage systems with the objective of economic optimality; P. D. Lund (2018) considered the PV self-consumption, as well as the sensitivity of the storage system size of weather, and finally obtained the economically optimal PV energy storage system configuration; R. Luthander et al. (2019) consider the matching of PV generation with demand and the transfer of solar energy through energy storage systems, which can achieve zero-energy buildings that meet the relevant requirements of EU regulations; and R. Domínguez et al. (2020) analyzed the operation and construction of the European power system in 2050 and proposed a stochastic model to study the future renewable energy construction planning. The results showed that new renewable energy generation capacity in Europe should reach 881 GW by 2050, taking into account the installation of energy storage system, and until then, CO2 emissions will be reduced by 77%. F. Zhang et al. (2020a) proposed a predictive control strategy of energy storage system to improve AGC regulation capacity for high PV penetration system; meanwhile, a protective charging and discharging method is developed to extend energy storage system life. O. Alrawi et al. (2022) utilized empirical evidence and an economic model to evaluate rooftop PV systems in Qatar with different economic tools and collected real data, and S. Ud-Din Khan et al. (2022) developed theoretical models to evaluate the economy of integrated PV systems. Various types of lithium-ion and liquid-flow batteries are then evaluated technically and economically to determine appropriate type of storage. E. Oh and Son (2020), based on the uncertainty of wind power forecast, proposed a method of determining the theoretical energy storage capacity considering the stochastic characteristics of uncertainty. Finally, the effectiveness of the model is verified by the actual wind power generation data and the forecast data; V. Jani and H. Abdi (Jani and Abdi, 2018) established three different and incompatible objective functions considering operation cost, voltage deviation, and air emission to determine the optimal configuration of energy storage capacity. Two multiobjective hybrid algorithms are used to solve the problem. Simulation results show the effectiveness of the proposed method; S. Garip and S. Ozdemir (Garip and Ozdemir, 2022) chose energy cost minimization as the objective function. The proposed algorithm can obtain the optimal PV and energy storage size with minimum cost using the new energy management method and the PSO algorithm.
In summary, there have been many studies on energy storage sizing in PV power systems, but there are few sizing models with consideration of assessment indicators in terms of local new energy policy and economic factors. From the side of new energy generation, installing energy storage systems not only can improve the operating characteristics of PV power station but can also indirectly improve the system reliability and environmental protection. Therefore, this paper builds a new energy storage sizing model for large PV power stations, with the aim to improve the solar curtailment rate and forecasting accuracy. First, with processing original data of PV power generation, the annual curtailment and forecasting accuracy of PV power are quantified. Then, we calculate the forecasting accuracy of PV power and the penalty cost for each month in terms of penalty rules in a certain region, provide the specific algorithm process of energy storage sizing, and derive the simulation results. A comprehensive energy storage system size determination strategy is obtained with the trade-off among the solar curtailment rate, the forecasting accuracy, and financial factors, which provides a practical reference to determine energy storage size for PV power station and further verifies the feasibility of energy storage system in the high PV penetration power system.
Chinese renewable energy enters a new stage of high-quality leap; in the first half of 2022, nonfossil energy power generation accounted for 83% of new power generation installed capacity, while renewable energy generation exceeded 1.1 billion kW (Pablo-Romero et al., 2021). The generating capacity of hydropower, wind power, and solar power has increased by 20.3%, 7.8%, and 13.5% from the last year, respectively. Large-scale wind power and PV on-grid has posed a huge challenge to the safety and reliability of power system (Lei et al., 2022; Liu et al., 2022). From the perspective of system operation, installing energy storage not only mitigates PV power fluctuation but also realizes real-time scheduling of tracking power and enhance the grid’s ability to consume new energy (Wang et al., 2019); in addition, the joint operation of PV power generation and energy storage can play the role of peak shaving and valley filling and also participate in auxiliary services (Motalleb et al., 2016). On the other side, from the perspective of new energy power plant, installing reasonably energy storage can improve the accuracy of PV forecasting (Liu et al., 2020), which may not only reduce the penalty cost but also further reduce the solar curtailment rate and improve net revenue of PV power station. In general, most optimization objectives of combing with PV power generation and energy storage focus on system operation, including meeting the technical requirements of grid power quality, minimizing power fluctuations, providing stable output power, and improving the utilization rate of new energy. With different optimization objectives, sizing procedures of energy storage system are developed, but the size determination strategy of energy storage systems from the perspective of renewable power plant is not enough. The sizing of energy storage systems in PV power plants is closely related to the operation mode, market rules, and financial factors. Installing energy storage system with reasonable capacity is necessary for power plant operation; therefore, an optimal sizing strategy of energy storage system in PV power plants is very important and meaningful.
So far in 2021, the deployment rules of energy storage for new energy plant have been put forward in 24 provinces of China, of which governments have made clear requirements for energy storage supporting distributed PV. In all configuring rules of energy storage, the highest proportion of energy storage capacity requirements in Shandong Zaozhuang is 15%–30% of the installed PV rated capacity, and the duration time can be 2–4 h, while in some regions of Henan and Shanxi province the capacity of energy storage reaches 20%. Mostly the duration time is 2 h, and 3 h is required for the market-based on-grid project in Hebei province. We investigate the relevant rules in Jiangsu province in terms of energy storage capacity requirements, the solar curtailment rate, and the minimum standards for forecasting assessment. Specifically, Jiangsu Development and Reform Commission issued the “Provincial Development and Reform Commission on the province’s 2021 photovoltaic power generation project market notice”, in which the energy storage system with 8% of PV rated power generation and 2 h duration is needed principally for projects located in south of the Yangtze River; for those projects located in north of the Yangtze River, 10% of PV rated power and 2 h duration are required. In terms of the solar curtailment rate, according to the “Clean Energy Consumption Action Plan (2018–2020)” developed by the National Development and Reform Commission and the National Energy Administration, the utilization rate of PV power generation must be higher than 95% and the solar curtailment rate must be less than 5% (Zhang et al., 2022b). For assessment indicators, according to the specific requirements of the “Jiangsu Province Electricity Grid Operation Management Rules”, the time interval is set at 15 min, and the PV forecasting qualification rate is also defined in the rules. The criteria for qualification assessment are calculated monthly, and the penalty expense for every month is also standardized.
Based on aforementioned regulations and standards, this paper will figure out the economics of PV power plants with different sizes of energy storage systems. In order to calculate the relevant evaluation indicators from the massive dataset, this paper uses statistics to carry out the economic analysis of energy storage configuration scheme.
Through the statistics and analysis on the sample dataset of PV plant, the PV curtailment power at each sample point is measured, as shown in Eq. 1.
where
where
where λ(m) denotes the dataset of solar curtailment rate in each month.
According to “Jiangsu Province Electricity Grid Operation Management Rules,” the short- and medium-term PV forecasting power are computed by 96 points, and we obtain the qualification rate from Eq. 4. The next day qualification rate is required not less than 90%. The qualification rate of PV forecasting power is determined by the ratio of qualified points to total points for every month. When the unqualified rate exceeds 2%, PV power station will be punished by ¥10 per 10,000 kW of rated capacity.
In Eq. 4,
In order to statistically calculate the number of unqualified PV forecasting points from a huge dataset and quantified the penalty cost for each month, this paper proposes a method to count the monthly unqualified PV forecasting points and specify the penalty cost; the process is shown in Figure 1.
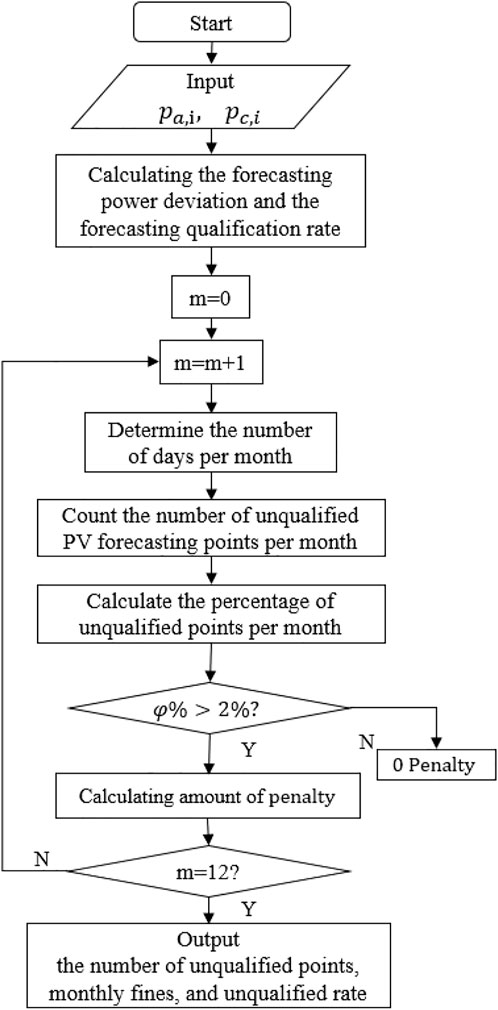
FIGURE 1. Statistical process of unqualified forecasting points for PV power station. The steps are as follows.
Step 1. Input data, calculate the forecasting power deviation and qualification rate for each point using Eq. 4.
Step 2. The number of sampling points for each month is calculated to determine the specific data range from each month’s dataset, as shown in Eq. 5.
where S(m) represents the specific data range corresponding to the data of month m in the annual dataset, and d(m) represents the number of days in month m. When and only when m = 1,
Step 3. Count the number of unqualified PV forecasting points in each month as shown in equation 6, and calculate the percentage of unqualified points in each month as shown in Eq. 7.
where N(m) is the number of unqualified points in month m, and α[S(m)] indicates the qualification rate in month m. In Eq. 7, φ(m) is the percentage of monthly unqualified points.
Step 4. Determine whether the percentage of unqualified points is greater than 2% per month. If it is greater than 2%, calculate the monthly penalty, as shown in Eq. 8, and if less than or equal to 2%, the penalty is zero in the month.Let
where
Step 5. Determine whether all of the monthly data have been analyzed, otherwise return to step 2.
Step 6. Output: calculation results including penalty and the number of unqualified points for each month.
The sizing process of energy storage capacity is programmed with MATLAB, as shown in Figure 2. By extracting and processing the raw dataset after performing multiple cycles, the feature indicators mentioned in section 2 are developed.
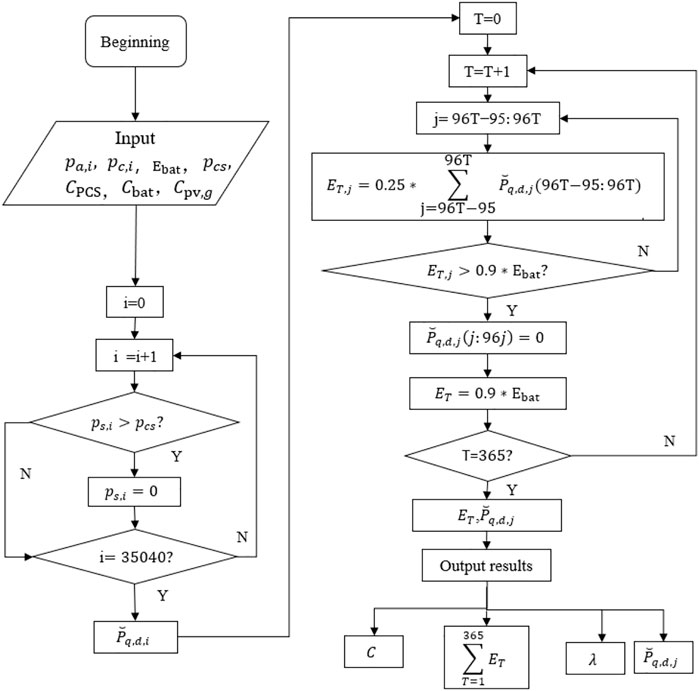
FIGURE 2. Implementation process of energy storage capacity size determination.
The steps are as follows:
Step 1Input basic dataset and initial parameters including energy storage capacity
Step 2Input power constraints, that is, when the first cycle is performed, the PV curtailment power of each sample point is calculated by Eq. 1 to form curtailment dataset that corresponds to each time point, and the curtailment power dataset is formed by Eq. 9 after filtering the adsorption by energy storage. If the curtailment power at a certain moment is greater than the rated power of energy storage, the power cannot be absorbed and set as zero; meanwhile, curtailment dataset is updated.
where
where
At this point, the energy storage battery has reached saturation after being completely charged during the day, and no longer absorbs the PV curtailment power; therefore, the real-time dataset of the solar curtailment power that can be absorbed by the battery is updated again.
Step 4When all data are cycled through for 365 days in a year, the net revenue of energy storage C is obtained as shown in Eq. 13. The results of the solar curtailment rate, C, and the loss cost are outputted.
In this paper, the original data of 35,040 sample points with an interval of 15 min for a 4000 MW PV plant in Belgium are used to study the size determination of energy storage. From the rules mentioned in section 2.2, the energy storage capacity ratio is set as shown in Table 1.

TABLE 1. Set value of energy storage power and capacity.
From Table 1, six scenarios with energy storage power ratios of 8%, 10%, 11%, 12%, 13%, and 15% are built. To discuss the techno-economic indicators proposed in section 2, the initial parameters are described in Table 2.
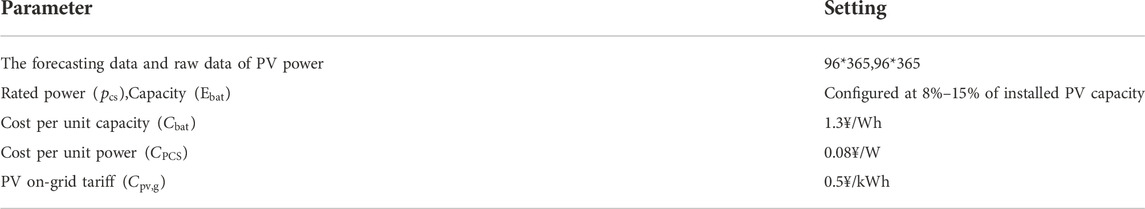
TABLE 2. Main parameter settings.
The PV curtailment power of each sample point can be obtained from dataset by Eq. 1, and then the actual power and curtailment power of PV plant for the whole year is shown in Figure 3.
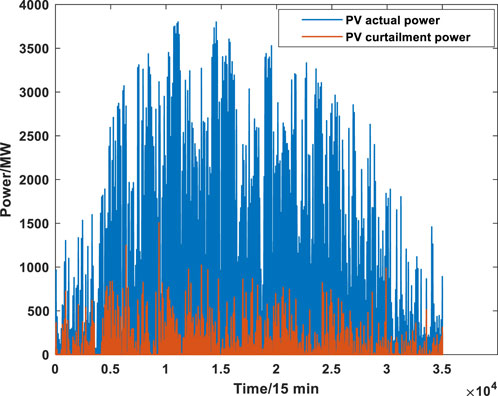
FIGURE 3. Actual power and curtailment power of PV plant in a whole year.
From Figure 3, it can be seen that the solar curtailment situation of the PV plant is quite serious. To further quantify the solar curtailment, the monthly solar curtailment power and solar curtailment rate are performed by Eqs 2, 3, respectively. Then, actual PV on-grid power for each month can be figured out, as shown in Figure 4.
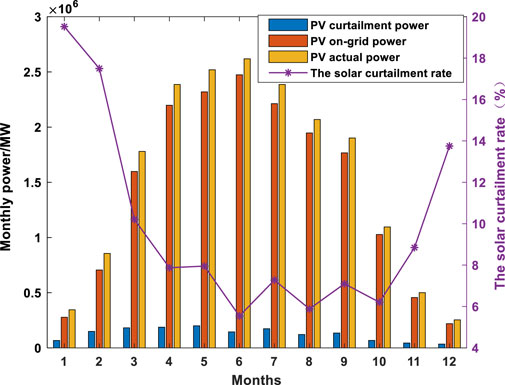
FIGURE 4. Monthly solar curtailment power and solar curtailment rate.
In Figure 4, it is clear that the solar curtailment rate in January is as high as 19.5%, the lowest in June is only 5.5%, and the average solar curtailment rate is as high as 8.07%. The solar curtailment occurred with low forecasting accuracy at some time points, which can be alleviated by installing storage devices for PV power plant. To further investigate the impact of PV forecasting accuracy on solar curtailment rate, the actual power generated at each point is compared with the forecasting power of the previous day, as shown in Figure 5.
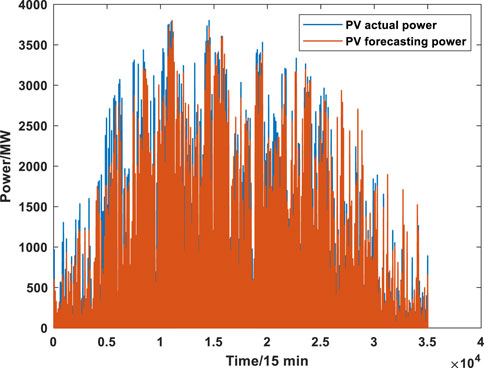
FIGURE 5. Actual power vs forecasting power of PV power station.
As can be seen in Figure 5, there are still many sample points with significant forecasting deviation. When dispatching power is too high, PV power cannot meet the load demand, and when dispatching power is too low, PV power generation is surplus. According to the regulation of “Jiangsu Province Electricity Grid Operation Management Rules,” the unqualified points of PV forecasting power, the forecasting deviation, and the qualification rate of each sample point can be provided. The results are shown in Figure 6.
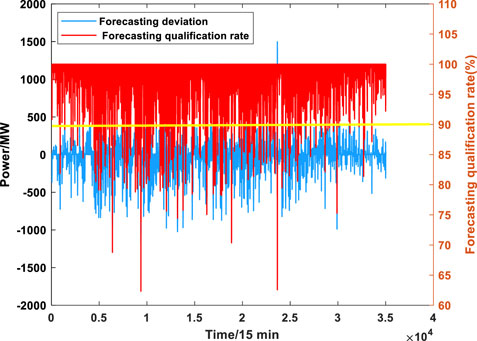
FIGURE 6. Forecasting deviation and qualification rate of PV power station.
From Figure 6, it can be seen that the deviation between the forecasting and the actual power of some points is large, and there also exist many unqualified forecasting points.
To get the total number of unqualified points for each month from the huge dataset and thus calculating penalty cost, the simulation results are outputted by completing steps one to six in section 3, as shown in Table 3.
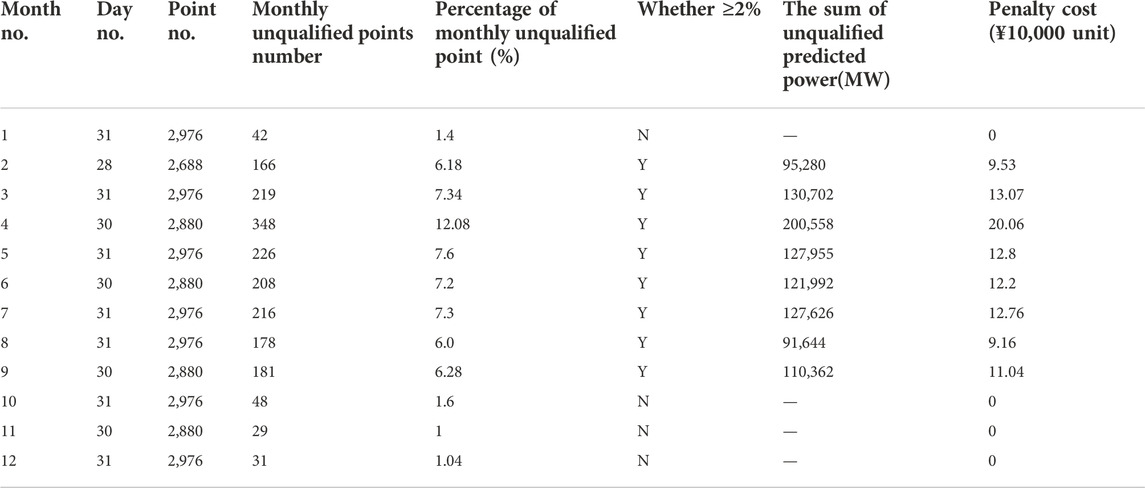
TABLE 3. Statistics and simulation results.
From the results in Table 3, months of the forecasting power assessment in 2021 is unqualified, and the total penalty to be paid is about ¥1,006,200, which seriously affects the efficiency of system dispatching and causes additional expenses for the PV power plant. To solve this problem, energy storage system should be installed for PV power stations. The simulation results for six scenarios with different energy storage sizes are shown in Table 4.
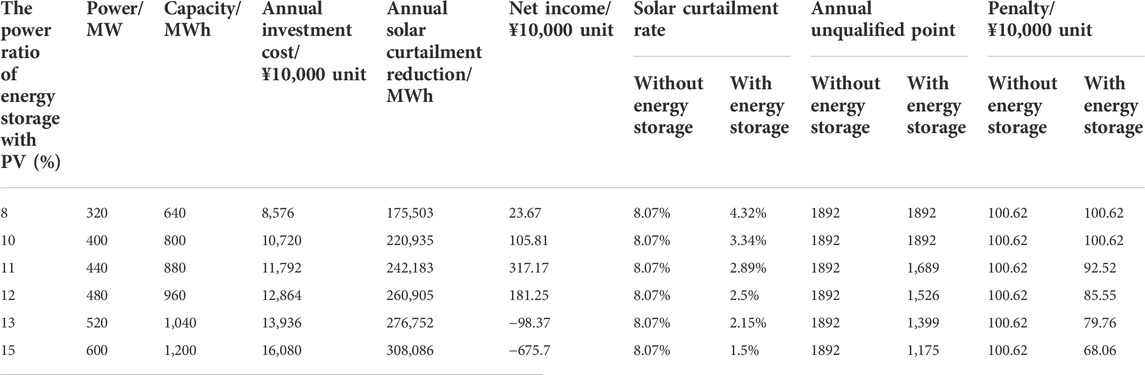
TABLE 4. Simulation results with different energy storage sizes.
To describe the effect of energy storage size on each assessment indicator, more discussions including the influence on the net income, the solar curtailment rate, and the forecasting qualification rate are developed.
From the perspective of the net income of energy storage, with the increase of the storage capacity, the net income of energy storage shows a trend of first increase and then decrease, as shown in Figure 7. As we know, energy storage is charged when the PV power is in surplus and discharged at night, an increasing income present with the increase of power ratio, and the maximum annual net income reaches 3.17 million. However, when the power ratio exceeds 11%, the income begins to decline, and when the ratio exceeds by 12%, the income is even negative. With the increase of the storage capacity, the investment cost of energy storage rises and the income obtained from the PV consumption cannot offset the annual investment cost of energy storage, as shown in Figure 8.
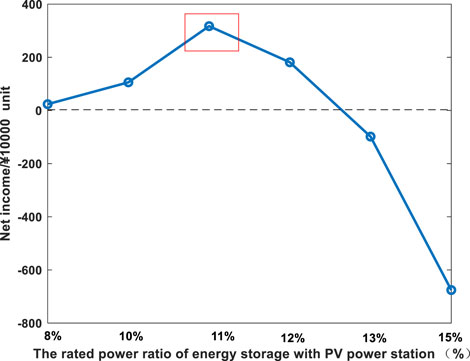
FIGURE 7. Net income of energy storage with different rated power ratios.
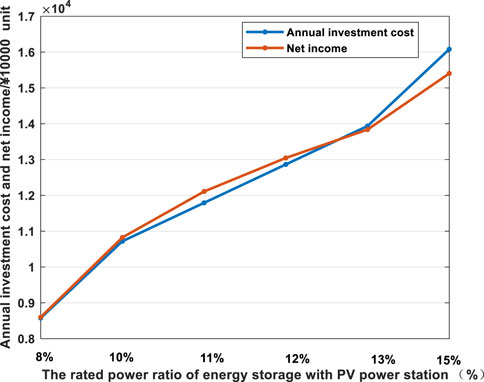
FIGURE 8. Net income and annual investment cost of energy storage.
When the power ratio is 8%, the annual solar curtailment rate is already lower than 5%. With the increase of the storage capacity, the solar curtailment rate decreased continuously from 4.32% to 1.5%, and the PV utilization rate is greatly improved, as shown in Figure 9. However, with the large size of energy storage, the net income of energy storage is negative when the power ratio exceeds 12% even the improvement of the PV consumption rate. Therefore, the size determination of energy storage should involve the solar curtailment rate and economics.
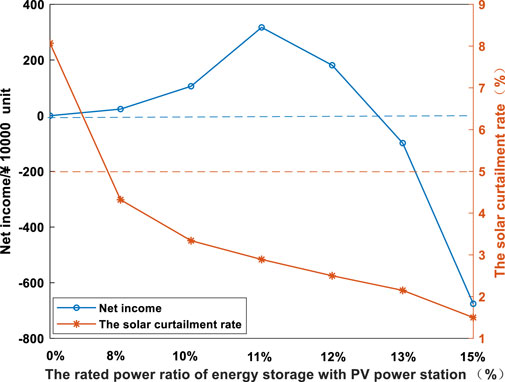
FIGURE 9. Solar curtailment rate and net income with different power ratios.
When the capacity ratio is 11% (440MW/880 MWh), the maximum net revenue of energy storage is obtained. Here, the solar curtailment rate is 2.89%, which is far below the specified value. The comparison of the solar curtailment power at each point without and with energy storage is shown in Figure 10. It is obvious for reducing the curtailment for PV power stations.
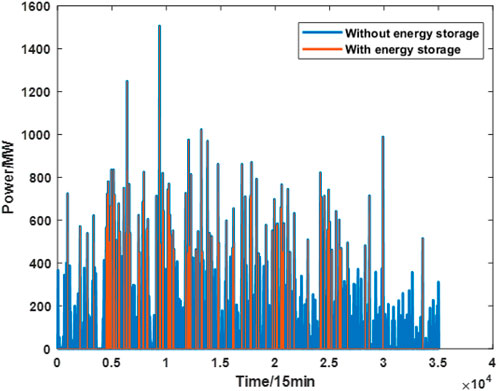
FIGURE 10. Solar curtailment power without and with energy storage.
As the rated power ratio increases, the penalty and annual unqualified forecasting points decreases, as shown in Figure 11. The penalty remains the same level from 8% to 10%, and the number of annual unqualified forecasting points does not change, which means that the energy storage size is not enough.
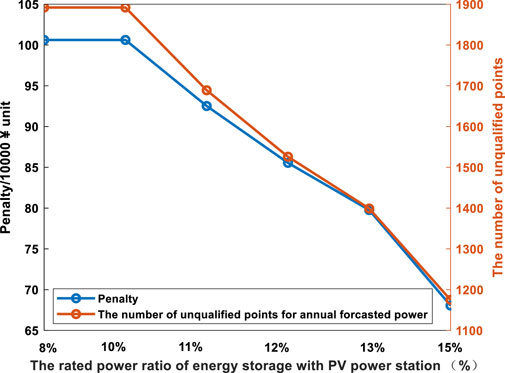
FIGURE 11. Annual unqualified forecasting power points and penalty with different rated power ratios.
The net income of energy storage does not increase continuously while improving the forecasting qualification rate and reducing the penalty, as seen in Figure 7. The net income is negative with the ratio of 13%. The highest income appears with the ratio of 11%; meanwhile, the penalty cost decreases by ¥81,000 and the unqualified forecasting point number drops by 203. When the ratio is 12%, the penalty cost and unqualified points reduction are ¥150,700and 330, respectively. However, the net income is 1.36 million lower than that of 11%. Therefore, the reasonable capacity will be confirmed as 440MW/880 MWh. The deviation of forecasting power and actual power is clearly improved, as shown in Figure 12.
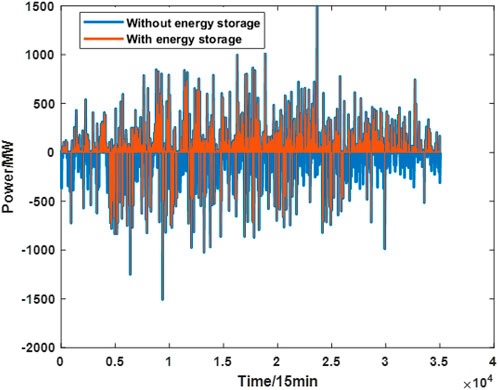
FIGURE 12. Deviation between forecasting and actual power.
The aforementioned results show that the maximum annual net income and lower solar curtailment rate of 2.89% can be realized with 440MW/880 MWh energy storage. Also, in this scenario, the deviation of forecasting and actual power improved largely and the forecasting qualification rate enhanced clearly.
In view of the lack of relevant policies and comprehensive techno-economic indicators when configuring energy storage at the PV power station side, an optimal size determination strategy of energy storage is proposed by considering assessment indicators and the economics from the perspective of PV plant according to the “Assessment Rules for New Energy Grid Connection in Jiangsu Province of China” in this paper. The feature indicators are automatically extracted from the annual operation data of PV plant, and different scenarios are established for evaluating the reduction of solar curtailment rate and the improvement of forecasting accuracy. The methods proposed in this paper are verified step by step based on the dataset of PV power station, and the following conclusions are summarized from the simulation results.
1) Taking a 4400 MW PV plant in Belgium, as example, the results show that when the rated power ratio is 11%, the highest annual net income of energy storage can be achieved. The solar curtailment rate is reduced to 2.89%, and total number of annual unqualified points of PV forecasting power is reduced by 203, which can effectively reduce the penalty cost of PV power plants.
2) The method proposed in this paper is applicable to the extraction of the operating characteristics of large PV power stations within the whole year and realizes the automatic analysis of the optimal sizing of energy storage from the side of PV power station.
3) For specific PV power plant, the size of energy storage should be determined by multidimensional optimization combined with the annual operating characteristics of PV power plants and local assessment rules, in favor of improving the techno-economic indicators of the joint operation of PV power stations and energy storage.
In summary, the method proposed in this paper is reasonable for the performance evaluation of large PV power stations with annual operating data and realizes the automatic analysis of the optimal size determination of energy storage systems for PV power stations, which will provide a generalized sizing method of energy storage for PV power stations in different regions.
The original contributions presented in the study are included in the article/supplementary material; further inquiries can be directed to the corresponding author.
BL: writing and editing, establishing the model, data collation and analysis, and first author. ML: data collation and reviewing. SY, YZ, and BS: survey. JY: writing and methodology, reviewing and editing, and corresponding author.
This work was supported by Technical Standard of Shanghai 2020 “Technology Innovation Action Plan” (20DZ2205400).
The authors declare that the research was conducted in the absence of any commercial or financial relationships that could be construed as a potential conflict of interest.
All claims expressed in this article are solely those of the authors and do not necessarily represent those of their affiliated organizations, or those of the publisher, the editors, and the reviewers. Any product that may be evaluated in this article, or claim that may be made by its manufacturer, is not guaranteed or endorsed by the publisher.
Ali, S. M. H., Lenzen, M., and Tyedmers, E. (2019). Optimizing 100% renewable grids through shifting residential water-heater load. Int. J. Energy Res. 43 (4), 1479–1493. doi:10.1002/er.4416
Alrawi, O., Bayram, I. S., Koc, M., and Al-Ghamdi, S. G. (2022). Economic viability of rooftop photovoltaic systems and energy storage systems in Qatar. Energies 15 (9), 3040. doi:10.3390/en15093040
Apeh, O. O., Meyer, E. L., and Overen, O. K. (2022). Contributions of solar photovoltaic systems to environmental and socioeconomic aspects of national development—A review. Energies 15 (16), 5963. doi:10.3390/en15165963
Azimov, U., and Avezova, N. (2022). Sustainable small-scale hydropower solutions in Central Asian countries for local and cross-border energy/water supply. Renew. Sustain. Energy Rev. 167, 112726. doi:10.1016/j.rser.2022.112726
Bird, L., Lew, D., Milligan, M., Carlini, E. M., Estanqueiro, A., Flynn, D., et al. (2016). Wind and solar energy curtailment: A review of international experience. Renew. Sustain. Energy Rev. 65, 577–586. doi:10.1016/j.rser.2016.06.082
Chao, H.-p. (2011). Efficient pricing and investment in electricity markets with intermittent resources. Energy Policy 39 (7), 3945–3953. doi:10.1016/j.enpol.2011.01.010
Chen, Q., Xie, R., Chen, Y., Liu, H., Zhang, S., Wang, F., et al. (2021). Power configuration scheme for battery energy storage systems considering the renewable energy penetration level. Front. Energy Res. 9. doi:10.3389/fenrg.2021.718019
Domínguez, R., Carrión, M., and Oggioni, G. (2020). Planning and operating a renewable-dominated European power system under uncertainty. Appl. Energy 258, 113989. doi:10.1016/j.apenergy.2019.113989
Du, P., Liu, Z., Huang, B., Jing, G., Feng, L., and Yang, C. (2022). Blockchain based peer-to-peer energy trading between wind power producer and prosumers in short-term market. Front. Energy Res. 10. doi:10.3389/fenrg.2022.923292
Fang, W., Huang, Q., Huang, S., Yang, J., Meng, E., and Li, Y. (2017). Optimal sizing of utility-scale photovoltaic power generation complementarily operating with hydropower: A case study of the world’s largest hydro-photovoltaic plant. Energy Convers. Manag. 136, 161–172. doi:10.1016/j.enconman.2017.01.012
Garip, S., and Ozdemir, S. (2022). Optimization of PV and battery energy storage size in grid-connected microgrid. Appl. Sci. 12 (16), 8247. doi:10.3390/app12168247
Jani, V., and Abdi, H. (2018). Optimal allocation of energy storage systems considering wind power uncertainty. J. Energy Storage 20, 244–253. doi:10.1016/j.est.2018.09.017
Keeratimahat, K., Bruce, A., and MacGill, I. (2021). Analysis of short-term operational forecast deviations and controllability of utility-scale photovoltaic plants. Renew. Energy 167, 343–358. doi:10.1016/j.renene.2020.11.090
Kim, R., Wang, Y., Vudata, S. P., Bhattacharyya, D., Lima, F. V., and Turton, R. (2020). Dynamic optimal dispatch of energy systems with intermittent renewables and damage model. Mathematics 8 (6), 868. doi:10.3390/math8060868
Kut, P., Pietrucha-Urbanik, K., and Tchórzewska-Cieślak, B. (2021). Reliability-oriented design of a solar-PV deployments. Energies 14 (20), 6535. doi:10.3390/en14206535
Lei, J., Yuan, Z., Bai, H., Su, S., Yang, J., Li, W., et al. (2022). Economic dispatch of distribution network with dispersed wind power considering network reconfiguration. Front. Energy Res. 10. doi:10.3389/fenrg.2022.942350
Li, J., Zhang, Z., Shen, B., Gao, Z., Ma, D., Yue, P., et al. (2020). The capacity allocation method of photovoltaic and energy storage hybrid system considering the whole life cycle. J. Clean. Prod. 275, 122902. doi:10.1016/j.jclepro.2020.122902
Liu, X., Grassi, F., Spadacini, G., and Pignari, S. A. (2020). Physically based modeling of hand-assembled wire bundles for accurate EMC prediction. IEEE Trans. Electromagn. Compat. 62 (3), 914–922. doi:10.1109/temc.2019.2922455
Liu, X., Xiong, L., Wu, B., Qian, Y., and Liu, Y. (2022). Phase locked-loop with decaying DC transient removal for three-phase grids. Int. J. Electr. Power & Energy Syst. 143, 108508. doi:10.1016/j.ijepes.2022.108508
Lu, H., Sheng, X., and Du, F. (2022). Economic benefit evaluation system of green building energy saving building Technology based on entropy weight method. Processes 10 (2), 382. doi:10.3390/pr10020382
Lund, P. D. (2018). Capacity matching of storage to PV in a global frame with different loads profiles. J. Energy Storage 18, 218–228. doi:10.1016/j.est.2018.04.030
Luthander, R., Nilsson, A. M., Widén, J., and Aberg, M. (2019). Graphical analysis of photovoltaic generation and load matching in buildings: A novel way of studying self-consumption and self-sufficiency. Appl. Energy 250, 748–759. doi:10.1016/j.apenergy.2019.05.058
Lutsenko, N. A., and Fetsov, S. S. (2020). Effect of side walls shape on charging and discharging performance of thermal energy storages based on granular phase change materials. Renew. Energy 162, 466–477. doi:10.1016/j.renene.2020.08.029
Motalleb, M., Reihani, E., and Ghorbani, R. (2016). Optimal placement and sizing of the storage supporting transmission and distribution networks. Renew. Energy 94, 651–659. doi:10.1016/j.renene.2016.03.101
Ndebele, T. (2020). Assessing the potential for consumer-driven renewable energy development in deregulated electricity markets dominated by renewables. Energy Policy 136, 111057. doi:10.1016/j.enpol.2019.111057
Oh, E., and Son, S.-Y. (2020). Theoretical energy storage system sizing method and performance analysis for wind power forecast uncertainty management. Renew. Energy 155, 1060–1069. doi:10.1016/j.renene.2020.03.170
Pablo-Romero, M. P., Sánchez-Braza, A., and Galyan, A. (2021). Renewable energy use for electricity generation in transition economies: Evolution, targets and promotion policies. Renew. Sustain. Energy Rev. 138, 110481. doi:10.1016/j.rser.2020.110481
Qian, L., Shen, M., and Yi, H. (2022). Spatio-temporal pattern of coupling coordination between urban development and ecological environment under the “double carbon” goal: A case study in anhui, China. Sustainability 14 (18), 11277. doi:10.3390/su141811277
Ud-Din Khan, S., Wazeer, I., Almutairi, Z., and Alanazi, M. (2022). Techno-economic analysis of solar photovoltaic powered electrical energy storage (EES) system. Alex. Eng. J. 61 (9), 6739–6753. doi:10.1016/j.aej.2021.12.025
Wang, X., Chang, J., Meng, X., and Wang, Y. (2019). Hydro-thermal-wind-photovoltaic coordinated operation considering the comprehensive utilization of reservoirs. Energy Convers. Manag. 198, 111824. doi:10.1016/j.enconman.2019.111824
Yang, Y., Qin, C., Zeng, Y., and Wang, C. (2022). Optimal coordinated bidding strategy of wind and solar system with energy storage in day-ahead market. J. Mod. Power Syst. Clean. Energy 10 (1), 192–203. doi:10.35833/mpce.2020.000037
Zhang, F., Fu, A., Ding, L., and Wu, Q. (2020). MPC based control strategy for battery energy storage station in a grid with high photovoltaic power penetration. Int. J. Electr. Power & Energy Syst. 115, 105448. doi:10.1016/j.ijepes.2019.105448
Zhang, J., Ji, X., Ren, Y., Yang, J., Qiao, Y., Jin, X., et al. (2022). IASA-based capacity allocation optimization study for a hydro–pumped storage–photovoltaic–wind complementary clean energy base. Front. Energy Res. 10. doi:10.3389/fenrg.2022.891225
Zhang, S., Yao, L., Xue, Y., Dou, D., Yang, G., Lv, Y., et al. (2020). Optimal operation of photothermal power station in regional power grid with high permeability of new energy. Sustain. Comput. Inf. Syst. 27, 100388. doi:10.1016/j.suscom.2020.100388
Zhang, X., Elia Campana, P., Bi, X., Egusquiza, M., Xu, B., Wang, C., et al. (2022). Capacity configuration of a hydro-wind-solar-storage bundling system with transmission constraints of the receiving-end power grid and its techno-economic evaluation. Energy Convers. Manag. 270, 116177. doi:10.1016/j.enconman.2022.116177
Keywords: PV power station, solar curtailment rate, forecasting accuracy, economic analysis, energy storage system sizing
Citation: Li B, Li M, Yan S, Zhang Y, Shi B and Ye J (2023) An optimal energy storage system sizing determination for improving the utilization and forecasting accuracy of photovoltaic (PV) power stations. Front. Energy Res. 10:1074916. doi: 10.3389/fenrg.2022.1074916
Received: 20 October 2022; Accepted: 02 November 2022;
Published: 18 January 2023.
Edited by:
Liansong Xiong, Xi’an Jiaotong University, ChinaReviewed by:
Yang Liu, ENGIE, FranceCopyright © 2023 Li, Li, Yan, Zhang, Shi and Ye. This is an open-access article distributed under the terms of the Creative Commons Attribution License (CC BY). The use, distribution or reproduction in other forums is permitted, provided the original author(s) and the copyright owner(s) are credited and that the original publication in this journal is cited, in accordance with accepted academic practice. No use, distribution or reproduction is permitted which does not comply with these terms.
*Correspondence: Jilei Ye, eWVqaWxlaUBuanRlY2guZWR1LmNu
Disclaimer: All claims expressed in this article are solely those of the authors and do not necessarily represent those of their affiliated organizations, or those of the publisher, the editors and the reviewers. Any product that may be evaluated in this article or claim that may be made by its manufacturer is not guaranteed or endorsed by the publisher.
Research integrity at Frontiers
Learn more about the work of our research integrity team to safeguard the quality of each article we publish.