 Yuan Yin1,2
 Fenqin Xu
 Bo Pang
95% of researchers rate our articles as excellent or good
Learn more about the work of our research integrity team to safeguard the quality of each article we publish.
Find out more
ORIGINAL RESEARCH article
Front. Energy Res. , 20 September 2022
Sec. Nuclear Energy
Volume 10 - 2022 | https://doi.org/10.3389/fenrg.2022.1011362
This article is part of the Research Topic Dynamics and Control for Nuclear Energy View all 8 articles
Sensors in the primary circuit of a pressurized water reactor (PWR) are normally designed with redundant structures to improve system safety and reliability. However, reliability of the actual system is often lower than that obtained by theoretical calculation due to the inevitable occurrence of common mode fault (CMF), which is a dependent failure event that can cause multiple failures in redundant channels. CMF may increase the reliability deviation of the system by orders of magnitude and, hence, seriously affects the reliability of the system. To mitigate the CMF of redundant sensors in nuclear power plants, an artificial neural network (ANN) can serve as a data-driven analytic model to monitor sensor parameters, to identify any possible abnormal status of the sensors, and provide an early warning. In this study, by using the high-fidelity dataset obtained in a full-scope PWR simulator as training, validation, and test data, a relevant parameter-based ANN black-box model (RPANN) was established by employing the back-propagation (BP) learning algorithm, which was then defined as an analytic redundancy. Time series-based ANN checking models (TSANNs) were also established for each of the input and output parameters of the RPANN in order to identify its abnormal state based on historical data in the past. When combined with the existing hardware redundancy, the ANN-based analytic redundancy can serve as an online monitoring tool of the hardware status and an online diagnosis strategy for sensor faults. Furthermore, ANN-based analytic redundancy can replace faulty hardware sensors to analytically reconstruct the reading of the monitored sensor parameter without having to reduce the reactor output power or even shut down the reactor for emergency maintenance so that the on-site calibration frequency of hardware sensors in redundant channels can be effectively reduced. This is not only of vital importance in reducing operation and maintenance costs of existing PWR power plants but also plays an important role in building reactor operation schemes with rapid and frequent changes in power output in the future. Simultaneously, the diverse redundancy combining analytic software redundancy and physical hardware redundancy can effectively reduce the threat of CMF of hardware sensors on the operation safety of reactor systems.
The modern large-scale pressurized water reactor (PWR) power plant is a large and complex system. Judgment of the state of the nuclear power plant (NPP) by a control and safety system depends strongly on accurate and reliable signals provided by various sensors. Hence, a large number of sensors measuring various physical parameters are, hence, installed in a PWR power plant, and some of them are inevitably exposed to extreme environments of high temperature, high pressure, and high radiation. With accumulation of plant operation time, the performance and reliability of the sensors are easily affected, and fault conditions may occur inevitably (Hashemian, 2010). Once a faulty sensor provides a wrong signal, its chain effects might cause the control system to perform protective actions, which may lead to unnecessary power reduction or accidental shutdown of the reactor, and, in the worst case, even lead to damage of reactor equipment or components.
In the current state, large-scale PWR power plants are normally defined as the base load of the power grid. For this purpose, reactors are maintained in a steady-state condition of full power output for most of the operation time. Consequently, relevant parameters remain relatively stable during the operation. However, with the fast and continuous development of renewable energy sources represented by wind and solar power, the proportion of unstable energy supply increases rapidly in the power grid. Hence, it is necessary to develop operation schemes also for NPPs, which enable PWRs to participate in peak shaving in the future to ensure overall stability of the power grid (Subki, 2020). The increase and decrease of the reactor power output during peak shaving are fast transient processes. Parameters of the reactors will change frequently and rapidly during these fast transients, which imposes further higher requirements for rapid and accurate control of the reactor. The basis of all these depends on sensor output of accurate and reliable signals.
To sum up, it is of crucial importance to identify possible faults of sensors in a rapid manner to guarantee safety of NPPs. If a sensor fault cannot be identified and handled in time, possible chain effects will impose a threat to the safety, economy, and reliability of the entire power plant. Therefore, many functions and structures in PWR power plants, especially those safety-related nuclear-level sensors in the primary circuit, are designed and equipped with redundant structures to improve the safety and reliability of the system. Although each individual sensor in a redundant sensor group has a small probability of experiencing an abnormality, due to the fact that redundant sensors are, in general, of the same hardware type and their working environment is also quite similar, redundant sensors may face the inevitable situation of two or more units having the same mode failure at the same time, i.e., the so-called common mode fault (CMF) (Yu et al., 2020). CMF is a dependent failure event, which can cause multiple failures of redundant channels in a system that may increase the reliability deviation of the system by one or several orders of magnitude and hence seriously affects the reliability of the system.
In order to minimize the impact of CMF on the operation safety of NPPs, current operating regulations of PWRs require that at least one sensor in the redundant channels must be on-site calibrated in each refueling cycle (Hashemian, 2010). However, on-site calibration requires maintenance personnel to enter an environment of high temperature and high radiation, which consumes a lot of manpower and material resources (Khentout et al., 2018). In addition, in the future operation scheme of participating in peak shaving, the state of the power plant may change more rapidly and more frequently, which brings further challenges to the reliability of sensors. If the current method of on-site calibration is further used, it is plausible to anticipate that the on-site calibration frequency of the sensors will increase exponentially, which largely increases the operation cost of the power plants. Therefore, it is of high interest to develop more reliable, more intelligent, and more cost-efficient, nondestructive fault diagnosis methods.
The traditional method of monitoring the sensor fault is achieved by monitoring the residual error between the target sensor and its redundant components (Ray and Phoha., 2000), also known as physical redundancy (Chen et al., 2015). However, CMF cannot be avoided by physical redundancy. Therefore, analytical redundancy was proposed (Hwang et al.2010) as one of the possible solutions. As reviewed by Tambouratzis et al (2020), during the period 1990–2015, various computational intelligence paradigms, including the artificial neural network (ANN), have been employed in monitoring, diagnosis, and fault detection of relevant sensors and components of power plants. Nearly 50 studies have shown that the ANN is a useful tool to provide feasible solutions to sensor monitoring also in NPPs. Because of its simplicity, robustness, and simultaneously high prediction accuracy, the back-propagation (BP) algorithm and its variants remain the most preferred (28 out of a total of 49 reviewed studies) learning algorithm when constructing an ANN.
In this study, a nondestructive online intelligent fault diagnosis scheme based on the ANN was proposed. By using the high-fidelity dataset provided by a full-scope PWR simulator as training, validation, and test data, a relevant parameter-based ANN (RPANN) black-box model was established by employing the BP learning algorithm, which is then defined as analytic redundancy. For each of the input and output parameters of the RPANN, a time series-based ANN (TSANN) checking model was also established for self-checking purposes in order to identify any possible abnormal state of the RPANN caused by abnormal input parameters. In compliance with the “diversity principle” (Littlewood, 1996), a distributed online sensor fault detection scheme (DOFD) was then proposed by combining the ANN-based analytic redundancy and the existing hardware redundancy. The ANN-based analytic redundancy can be used for online monitoring of the hardware status and online diagnosis of possible sensor faults. Furthermore, the ANN-based analytic redundancy provides an effective surrogate for replacing the responsibility of faulty hardware sensors. Reference values of the monitored parameter can be continuously output by ANN-based analytic redundancy without having to reduce the reactor power output or even shut down the reactor for emergency maintenance. Faulty hardware sensors can be temporally isolated from the redundancy set. Further in-depth repair or/and replacement of the faulty sensor can be postponed to the next scheduled periodic maintenance of the power plant. In this manner, the on-site calibration frequency of hardware sensors in redundant channels can be effectively reduced. This is of vital importance in reducing operation and maintenance costs of existing PWR power plants and also plays an important role in building reactor operation schemes with rapid and frequent changes when participating in peak shaving in the future. At the same time, the diverse redundancy combining analytic software redundancy and physical hardware redundancy can effectively reduce the threat of CMF of the hardware sensor on the operational safety and reliability of the reactor power plants.
ANN is a data-driven black box model. Hence, its prediction ability depends strongly on the data used for training the ANN. To ensure its prediction accuracy, it is necessary to train the ANN with data as close as possible to the real state of a nuclear power plant. At the same time, to strengthen its generalization ability, data used for training and validation of the ANN model should be expanded, in addition to steady-state operational conditions, to more working conditions, for instance, transient conditions during power change. However, real plant data from commercial PWR power plants are normally of confidential nature. More importantly, to ensure safety and stability of the power plant, PWRs are kept in steady-state operation for most of the time, and relevant data of the power plant during transient conditions are fairly limited.
A full-scope PWR simulator, on the contrary, can provide high-fidelity, almost real-state data of NPP through the whole-chain and all-round simulation of a typical large commercial PWR power plant. Compared to the traditional point reactor model, the full-scope simulator has the advantage of providing a complete dataset covering all the important components of an actual PWR power plant. At the same time, by changing the input parameters of the simulator, plant data covering a wider range of working conditions, including transient and even accidental conditions, can also be provided (Ayo-Imoru and Cilliers., 2017; Peng et al., 2017; Kim et al., 2018). Therefore, a full-scope PWR simulator can be used as a provider of reliable plant data for ANN training.
In this study, the CPR1000 full-scope PWR simulator (Ni et al., 2016) based on the China Pressurized Reactor (CPR1000) in the CGN Ningde Nuclear Power Plant was employed. The complete high-fidelity dataset obtained in the full-scope simulator was used as the training, validation, and test data of the ANN models established in this study. CPR1000 is a three-loop PWR with a maximal output power of 1000 MWe, which is one of the most mature, advanced, second-generation NPPs in operation in mainland China in the current state. As an example, a simplified schematic diagram of the primary circuit of the CPR1000 full-scope PWR simulator is depicted in Figure 1. In addition to the reactor core, relevant components, including the three-loop steam generators (SGs), coolant pumps, and the primary-circuit pressurizer, are all considered and modeled in the simulator.
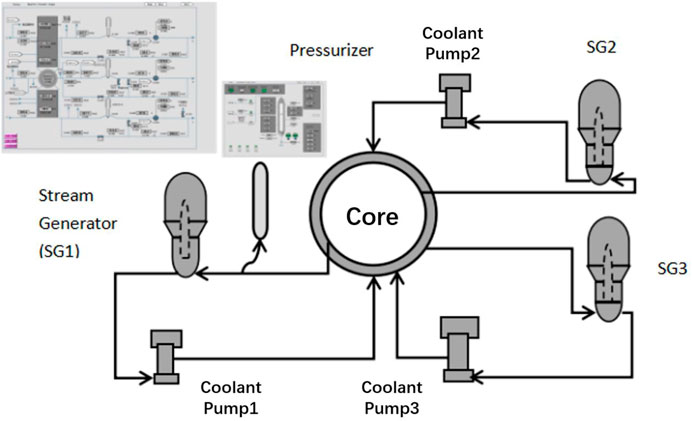
FIGURE 1. Simplified schematic diagram of the primary circuit of a three-loop PWR power plant in the CPR1000 full-scope simulator.
In this study, training of the ANN models was carried out using the BP toolbox embedded in MATLAB software according to the back-propagation (BP) algorithm (Rumelhart et al. 1986). Taking the exemplary ANN depicted in Figure 2 as an example, it consists of the input layer of
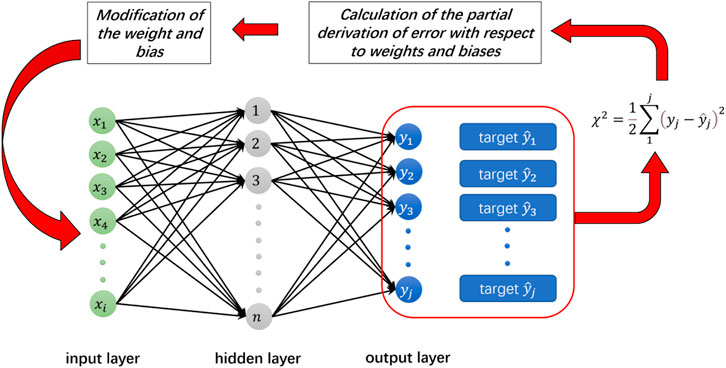
FIGURE 2. BP learning algorithm: forward propagation to calculate the quadratic deviation and back propagation of error to modify weights and bias.
Stage 1: forward propagation for calculation of error between ANN output and the target. In the first iterative step, a random weight
where
Stage 2: back propagation of the quadratic deviation for modification of weights and bias in order to minimize the quadratic deviation
In this study, pressure sensor of the primary-circuit pressurizer in a typical PWR was chosen as the objective sensor of investigation. The monitored sensor parameter is, hence, the pressure of the primary-circuit pressurizer. A relevant parameter-based ANN (RPANN) black-box model established with its output is then the predicted pressure of the primary-circuit pressurizer. The following five relevant thermal-hydraulic parameters were chosen to define the input variables of the RPANN input layer:
1) average value of the core power, which is defined as the average value of the six sensors measuring the core power in CPR1000;
2) average coolant temperature of the core, which is defined as the average value of primary-circuit hot leg temperature and primary-circuit cold leg temperature;
3) average steam flow rate of the steam generator, which is the average value of the steam flow rates of the three loops in CPR1000;
4) average feed water flow rate of the steam generator, which is the average value of the feed water flow rates of the three loops in CPR1000; and
5) water level of the pressurizer.
Furthermore, for each of the five input variables, and also for the monitored pressurizer pressure, a time series-based ANN (TSANN) checking model was also established based on historical data of the respective parameters as input parameters in order to identify a possible abnormal state of the respective variables. All the aforementioned thermal-hydraulic variables were retrieved from the CPR1000 full-scope simulator to construct the dataset for training of the ANNs.
It should be noted that the training datasets of RPANN and TSANNs cover the same range of operation conditions. In this study, four transient operation conditions were chosen, all of which begin with a steady-state operation of 1000 MWe full power (FP) for 1400 s, after which, the reactor power is gradually reduced from FP to 180 MWe at a constant rate of 0.5% FP/min, 0.6% FP/min, 0.8% FP/min, and 1.0% FP/min and then finally maintained at 180 MWe for ∼7000 s. For verification of the generalization ability of ANNs, an additional transient condition of reducing the reactor power at a constant rate of 0.75% FP/min was also defined. It should be noted that the rate of 0.75% FP/min is still covered within the range defined by the four transient conditions from 0.5% FP/min to 1.0% FP/min. Before training of the ANNs, different data preparation strategies were adopted for RPANN and TSANNs, which will be described in the following section.
The CPR1000 full-scope PWR simulator calculates the required thermal-hydraulic parameters every second. Consequently, the raw data retrieved from the simulator show two characteristics. First, the raw data would contain many duplicated values, especially for the periods during steady-state operation. Second, more importantly, the raw data would contain noisy, stochastic fluctuations of rather small amplitudes. Essentially speaking, the RPANN is a black-box, mathematic approximation of the rather complex and nonlinear relation between the five input parameters and the target output of pressurizer pressure. If training of the RPANN is performed with simulator raw data, the large size of the dataset will not only cause unnecessary waste of computing resources but also affect the convergence speed of the neural network. Furthermore, the presence of small-amplitude noisy fluctuations would lead to overfitting of the ANN, in which the error of the training dataset decreases with the training process, but the error of the verification dataset increases.
Thus, before training of the RPANN, it is necessary to perform a data cleaning for elimination of some duplicate and noisy data by resampling the raw data retrieved from the full-scope simulator. An appropriate choice of the sampling time interval is, therefore, of vital importance. With a reasonable sampling time interval, the original tens of thousands or even hundreds of thousands of data points retrieved from the full-scope simulator can be reduced to thousands of data points, and the essential characteristics of the dataset can still be kept.
Under the same transient condition of power reduction, a sensitivity study of the sampling time interval was conducted. As depicted in Figure 3, the change of the pressure output by the pressure sensor of the primary-circuit pressurizer is shown with transient time. The solid blue line in the figure stands for the original raw data retrieved from the CPR1000 full-scope simulator, which gives the pressure output every second. The dotted red line in the figure is the curve after data cleaning with a sampling time interval of 20 s, while the dashed–dotted purple line is the curve with a sampling time interval of 50 s. This means the size of the cleaned data is only one-twentieth and one-fiftieth of the original dataset. Overall, a rather good agreement is observed between all three curves, despite the relatively large difference in the sampling time interval.
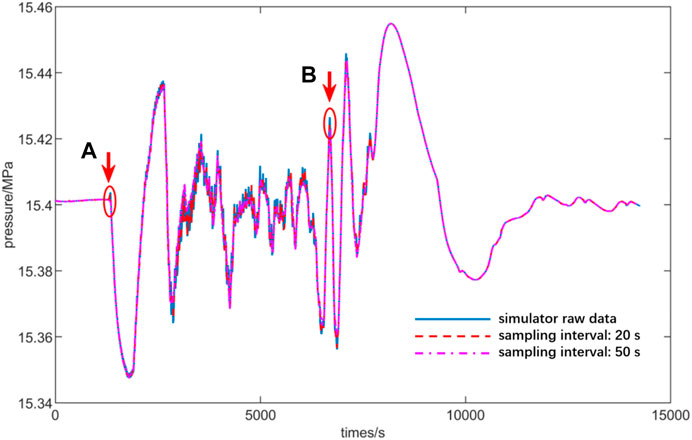
FIGURE 3. Sensitivity study of the sampling time intervals (the red arrows indicate the two largest local differences between different sampling intervals, which will be reviewed in Figure 4).
The two largest local differences, as marked with the two red arrows (a) and (b) in Figure 3, are then depicted in an enlarged view in Figures 4A,B, respectively. As observed in Figure 4A, the original raw data retrieved from the full-scope simulator show high-frequency noisy fluctuation with small amplitude even during the beginning ∼1300 s of steady-state operation. After data cleaning with a sampling time interval of 20 s, the curve of transient pressure change becomes much smoother, and the high-frequency fluctuation with small amplitudes also disappears. But, the transient changing trend of the pressure during the period of 1300 s–1400 s was still kept with the sampling time interval of 20 s. If the sampling time interval is further increased to 50 s, the cleaned data show a slight offset compared with the original curve, as depicted in Figure 4A and Figure 4B. Therefore, the sampling time interval is finally determined as 20 s based on a balance between economy and accuracy. The data after cleaning not only retain the essential characteristics of the original data but also eliminate most of the unnecessary noises to avoid possible overfitting of the ANNs. Therefore, the cleaned data with a sampling time interval of 20 s are then used as a dataset to train the RPANN.
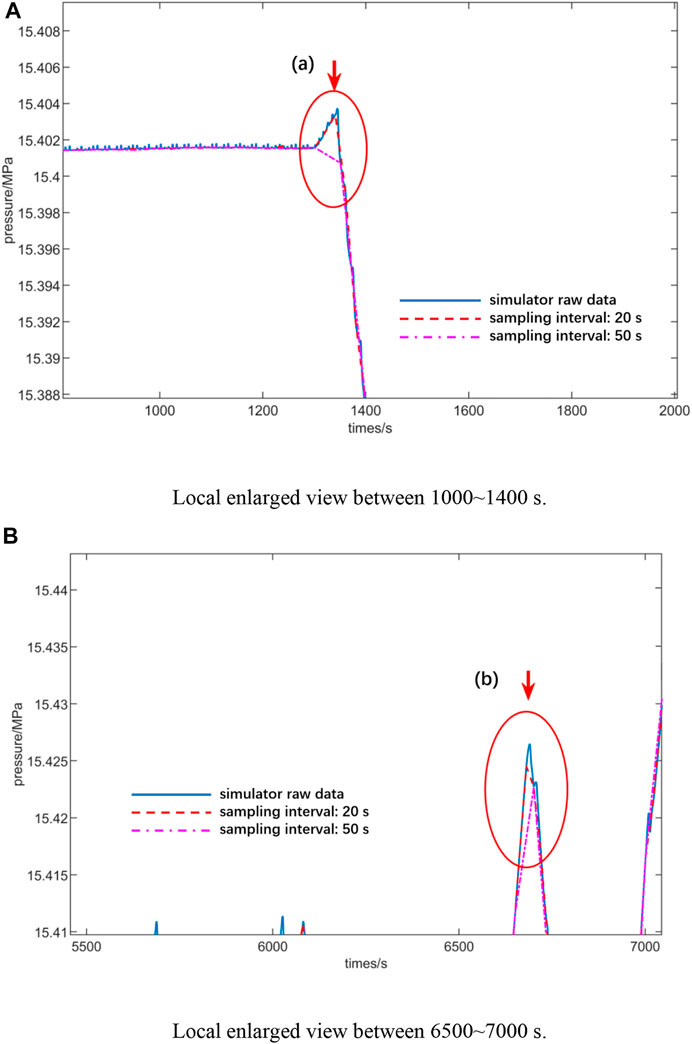
FIGURE 4. Local enlarged view of the two largest local differences between different sampling time intervals. (A) Local enlarged view between 1000 and 1400 s. (B) Local enlarged view between 6500 and 7000 s.
The basic principle of a time series-based ANN (TSANN) is to predict the future output based on historical data in a certain past period of time. Therefore, time-continuous data should be used to train the TSANN in order to improve its perception ability of the data changing trend. Therefore, the original raw dataset retrieved from the full-scope simulator was used to train the TSANN, for which the Z-score standardization is adopted in this study. After preparation of the dataset for both the RPANN and TSANN as described above, the dataset was then divided into the training set, validation set, and test set, which, by default, account for 70, 15, and 15% of the dataset, respectively. The training set is used to train the ANNs according to the BP algorithm, as described earlier, i.e., to calculate the gradient and modify the weight and bias of the neurons in the hidden layer. The validation set is used to validate the trained neural network model. The optimal weight of the validation set is used to update the network. The test set is then used to test whether the ANNs have fully learned the dataset, i.e., to verify the prediction ability of the trained ANNs for the so-called unfamiliar data different to the training and verification set.
Figure 5 shows the topology of the RPANN constructed in this study. The input layer consists of five input parameters, i.e., average value of the core power, average coolant temperature of the core, average steam flow rate of the steam generator, average feed water flow rate of the steam generator, and water level of the primary-circuit pressurizer. The pressure sensor of the primary-circuit pressurizer is the objective sensor of investigation in this study. Therefore, pressure of the pressurizer was specified as the single output variable of the RPANN. A single hidden layer with 150 hidden neural nodes was defined for the RPANN based on a balance between the performance and computational complexity of the neural network. It should be noted here that despite the data cleaning with a resampling time interval of 20 s, the RPANN still needs 150 neural nodes to fully learn the rather complex relation between the inlet thermal-hydraulic parameters and the objective pressure of the pressurizer.
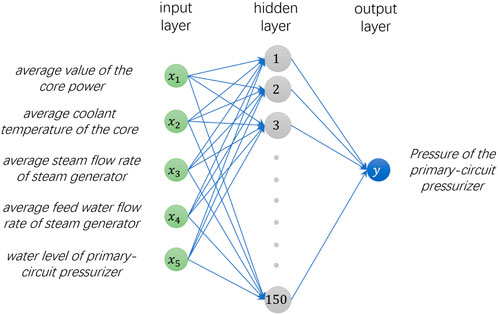
FIGURE 5. Topology of the relevant parameter-based ANN black-box (RPANN) model for pressure of the primary-circuit pressurizer.
For each of the five input variables of the RPANN, as well as for the objective pressure of the primary-circuit pressurizer, a time series-based ANN (TSANN) checking model was also established as a self-checking unit of each parameter. Therefore, the purpose of the TSANN for each variable is to identify any possible abnormality of the parameters based on historical data. The TSANNs established in this study share the same topology, as depicted in Figure 6. To predict a particular parameter value at time
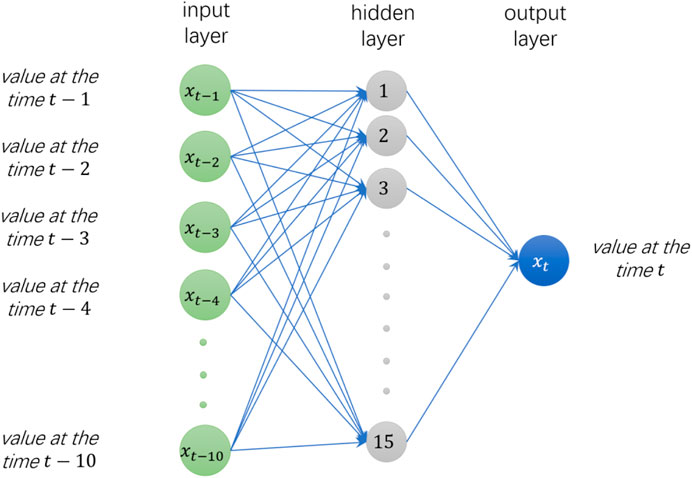
FIGURE 6. Topology of the time series-based ANN (TSANN) checking models for input parameters of the RPANN and for pressure of the primary-circuit pressurizer.
As shown in Figure 7, a “Distributed Online sensor Fault Diagnosis scheme” (henceforth termed DOFD scheme) was proposed in this study using both RPANN and TSANNs. As mentioned earlier, the objective sensor of investigation is the pressure sensor of the primary-circuit pressurizer. The output parameter of the DOFD scheme is then the monitored target sensor output, i.e., pressure of the primary-circuit pressurizer. The core of the fault diagnosis scheme is the trained RPANN, as depicted in Figure 5, which has established a relation to predict the monitored pressurizer pressure based on the five relevant thermal-hydraulic input variables (
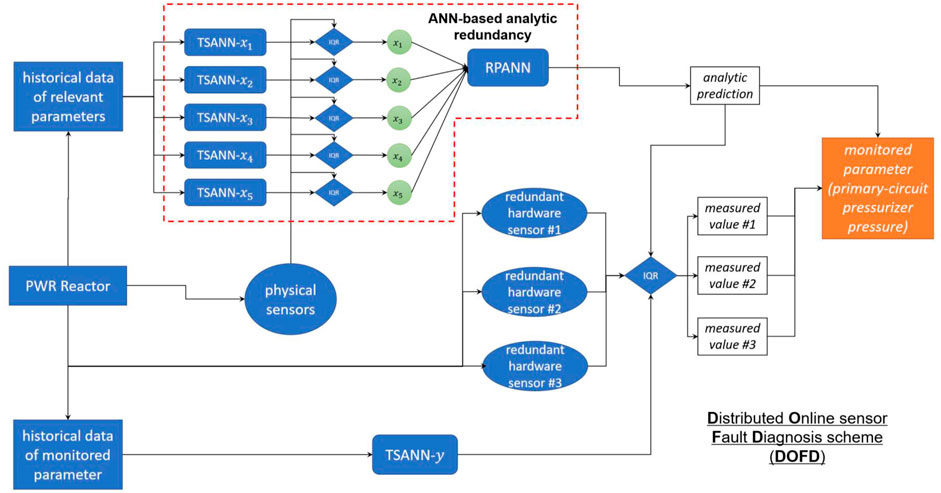
FIGURE 7. Distributed online sensor fault diagnosis (DOFD) scheme proposed in this study based on the RPANN and TSANNs.
First, the proposed DOFD scheme provides an ANN-based analytic redundancy that can give a theoretical prediction of the monitored sensor parameter. The detailed procedure is explained in the following text:
1) for a certain given operational condition, physical hardware sensors in the actual PWR reactor will provide the five relevant parameters (
2) TSANNs established for the five relevant parameters, i.e., TSANN-
3) If no abnormality is found based on historical data, the measured five relevant parameters (
Furthermore, by combining the ANN-based analytic redundancy and the three existing redundant hardware sensors #1, #2, and #3, the proposed DOFD, as depicted in Figure 7, can perform online fault diagnosis of the three hardware sensors. It should be noted that the prerequisite of online fault diagnosis is that all the five input parameters of the RPANN are in normal condition. The detailed procedure and algorithm of online fault diagnosis will be explained in the following text:
1) in case no abnormality is reported for the five input variables (
2) With the two analytically predicted values by the RPANN and TSANN-
3) A faulty condition of a hardware sensor will only be confirmed if the difference between the measured value by the hardware sensor and the predicted values of both the RPANN and TSANN-
4) If a faulty condition is confirmed at one of the hardware sensors, the difference between the measured value and the ANN-based predicted values will trigger an error warning for fault diagnosis. Fault warning information, including fault onset time, historical trend chart of the actual sensor output, and the predicted reference value by the neural network, will be printed out for online inspection by the plant operator.
Last but not the least, in addition to online fault diagnosis, the proposed DOFD, as depicted in Figure 7, can replace the function of the faulty hardware sensors to continuously provide reference output of the monitored parameter. The detailed procedure and the associated benefits are summarized as follows:
1) once an abnormality of a hardware sensor is detected by DOFD, the faulty sensor will be isolated from the redundancy set. Diagnosis data of the faulty hardware sensor will be printed out for more in-depth inspection by the plant operator.
2) More importantly, the ANN-based analytic redundancy can replace the function of the faulty hardware sensor to further provide prediction of the monitored sensor parameter. As a metaphor, the ANN-based analytic redundancy can perform an analytic “measurement” of the monitored parameter, so the setting of a triple redundancy is still retained even if one of the hardware sensors experiences abnormality.
3) In this manner, no change has to be implemented for the reactor such as power reduction or even shutting down for emergence maintenance. Possible on-site repairment or replacement of the faulty sensors can be carried out in the next scheduled periodic maintenance of the power plant. This is of high interest for economy of the power plant since the reactor can be maintained in full-power mode until the next scheduled maintenance.
The above-mentioned algorithms for detecting abnormality in the hardware sensors based on predicted values of the RPANN and TSANNs are defined according to the interquartile range (IQR)-based outlier detection method (Han et al., 2011), which is described as follows:
(1) Step 1: calculation of the interquartile range (IQR).
At a given time
Then, a buffer array that can store 100 values was created. The values of the absolute error at the time
(2) Step 2: determination of the fault warning threshold.
The fault threshold as the lower bound at the time
Hence, it is important to find an appropriate value of
(3) Step 3: comparison of
In case
To summarize, with the proposed fault diagnosis scheme (DOFD), as depicted in Figure 7, online monitoring and fault diagnosis of the hardware sensors in a redundant set of physical hardware sensors can be readily realized. Furthermore, the DOFD scheme can provide analytic “measurement” of the monitored sensor parameter, with which the setting of a triple redundancy is still retained even if one of the hardware sensors experiences abnormality.
As mentioned previously, the pressure sensor of the primary-circuit pressurizer is chosen as the target sensor of investigation in this study, for which the relevant parameter-based ANN (RPANN) black-box model was established. For the four transient conditions as defined in the Preparation of full-scope simulator data for ANN training subsection, the dataset retrieved from the CPR1000 full-scope PWR simulator was first resampled and then used as the training, validation, and test of the RPANN.
The training cure of the RPANN is depicted in Figure 8, in which the mean squared errors (MSE) between the predicted value and the expected target value are shown with progression of the learning process. The blue, green, and red lines represent the MSE of the training, validation, and test set, respectively. After ∼1000 epochs of iteration, the MSE of the training, validation, and test set all converged to the order of magnitude of 10−5. A slight increase of the MSE was observed after 1522 epochs of iteration. To avoid overfitting of this further upward trend, training was manually stopped at 1605 epochs, after which the MSE of the training set shows no more decreasing trend.
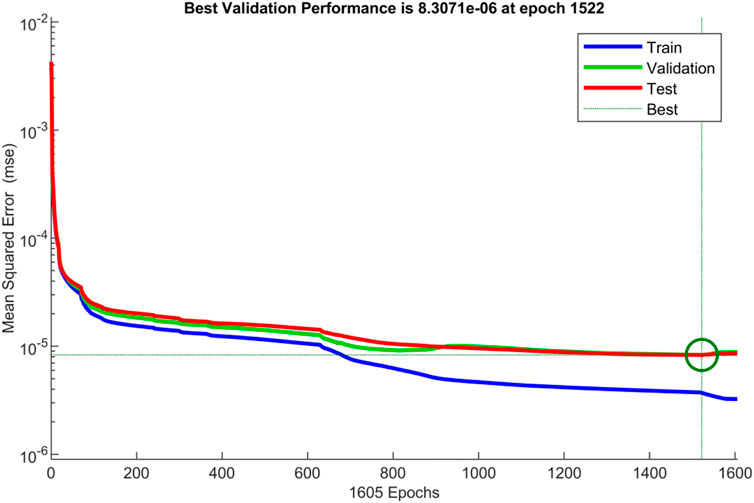
FIGURE 8. Training curve of the relevant parameter-based ANN black-box model (RPANN).
The final linear regression relations between the predicted values and the target values are depicted in Figure 9. “Output” denotes the predicted value by the trained RPANN, while “Target” denotes the expected target value of the pressurizer pressure, which is obtained from the full-scope PWR simulator. As observed in the figure, an excellent good agreement exists between “Output” and “Target”. With the trained RPANN, an accurate prediction can be provided for all the training, validation, and test set.
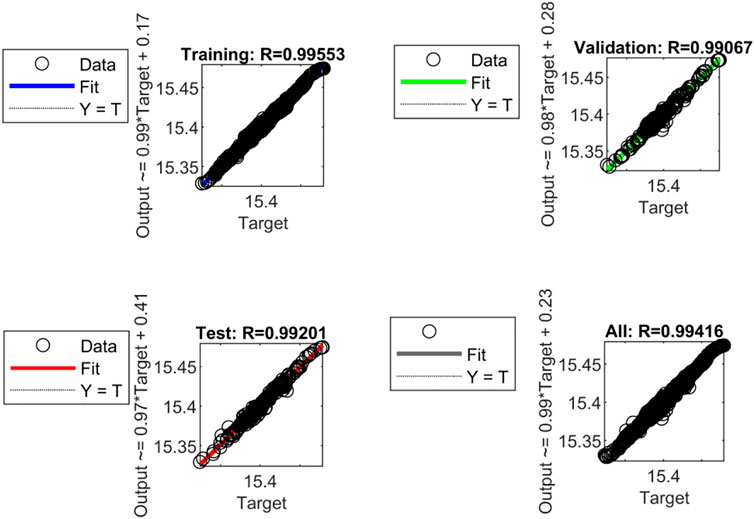
FIGURE 9. Linear regression relations between the predicted values and the target values for the RPANN.
To further verify the generalization ability of the trained RPANN, an additional operational condition for verification was defined as follows: at a constant rate of 0.75% FP/min, the reactor power is reduced from the steady-state condition of full power (1000 MWe output) to a lower power output of 180 MWe and is then maintained stable at 180 MWe. This operational condition is different to the four operational conditions defined for training of the RPANN. Figure 10 then compares the predicted pressure by the trained RPANN (dotted red line) with that retrieved from the full-scope PWR simulator (solid blue line). Although the operational condition defined for verification is not used for training, validation, or test of the RPANN, the pressure changing trend predicted by RPANN agrees well with that given by the full-scope simulator. Despite some deviations observed at the inflection points in the figure, the maximal deviation between the predicted values and the target values is still less than 0.2%. This reflects a strong generalization ability of the RPANN established based on relevant parameters.

FIGURE 10. Verification of the generalization ability of the RPANN.
As mentioned above, time series-based ANN (TSANN) checking models were established for the five input variables of RPANN and for the pressure of the primary-circuit pressurizer. The structure of the TSANNs is the same as shown in Figure 6. As an example, the training curve of the TSANN established for pressurizer pressure is depicted in Figure 11. The mean squared error (MSE) converges to the order of 10−5 after about 3000 epochs of iteration. Overall, the best performance with the smallest MSE was achieved at 3297 epochs of iteration. A slight increase of the MSE was observed in the validation set after 3500 epochs; hence, the training was then stopped to avoid overfitting.

FIGURE 11. Training curve of the time series-based ANN checking model (TSANN) established for pressure of the primary-circuit pressurizer.
Figure 12 shows finally the linear regression relation between the TSANN output and the expected target. With the trained TSANN, the predicted output shows an excellent agreement with the expected target for the training set, verification set, and test set.
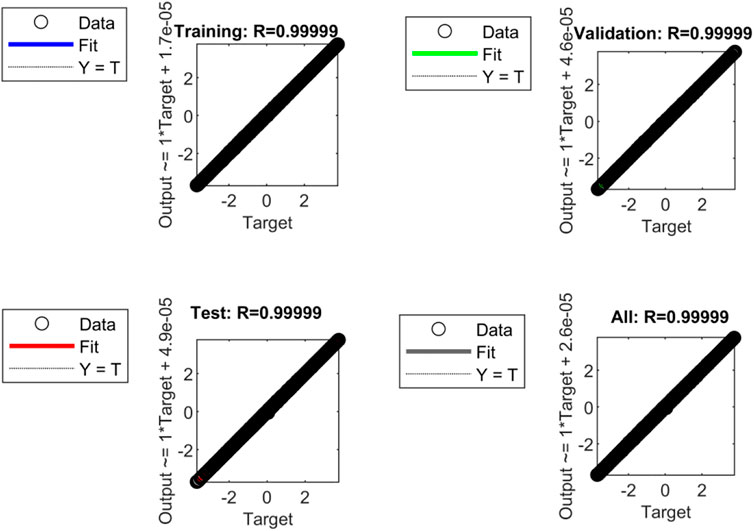
FIGURE 12. Linear regression relations between the predicted values and the target values for the TSANN established for pressure of the primary-circuit pressurizer.
To further verify the generalization ability of the trained TSANN, Figure 13 compares the predicted pressure by the TSANN (red dotted line) with the expected pressure given by the full-scope simulator (solid blue line) for the verification conditions of reducing the reactor power from 1000 MWe to 180 MWe at a constant rate of 0.75% FP/min. The predicted transient changing trend of the pressure agrees well with the expected value depicted with a solid blue line with a maximal deviation less than 0.1%. Hence, this also reflects a strong generalization ability of the TSANN established based on historical data.
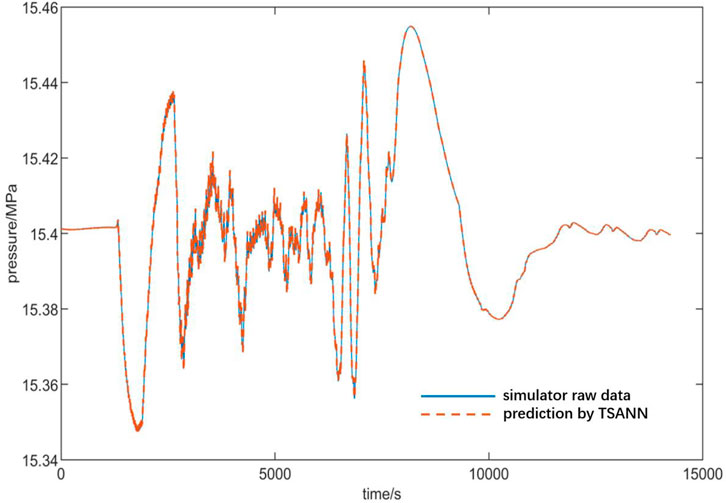
FIGURE 13. Verification of the generalization ability of the TSANN established for pressure of the primary-circuit pressurizer.
As reviewed in a recent EPRI technical report (Rusaw and EPRI Project Manger, 2014) based on a large amount of statistical data and extensive experiences of instrument calibration collected at 18 different NPPs, constant-bias fault (CBF) is found to be the most frequent sensor fault mode in NPPs that account for ∼40% of all statistical drift faults. Therefore, in this study, feasibility investigation on the practical application of the proposed distributed online sensor fault detection (DOFD) scheme was conducted by taking typical examples of CMF of hardware sensors. It should be noted that feasibility investigation was conducted in this study based on the CPR1000 full-scope PWR simulator so that the “PWR reactor” in Figure 7 was replaced with the full-scope simulator.
The so-called “constant-bias fault” (CBF) is characterized by a constant bias between the actual output of the sensor and the expected output of the sensor. Mathematical representation of CBF can be described as
where
1) After 1400 s steady-state operation of the full power output of 1000 MWe, the reactor power is gradually reduced to a lower power output of 180 MWe at a constant rate of 0.75% FP/min. This operation condition is defined above for verification of the generalization ability of ANNs.
2) A sporadic relative deviation of
3) A constant-bias fault (CBF) was assumed to occur at one of the redundant pressure sensors of the primary-circuit pressurizer, beginning at the time of 1001 s counting from the operating zero hour. Considering the fact that the threshold of fault warning in the traditional means of hardware redundancy is
Figures 14A,B are the printed-out monitoring curves of the pressure changing trends after the
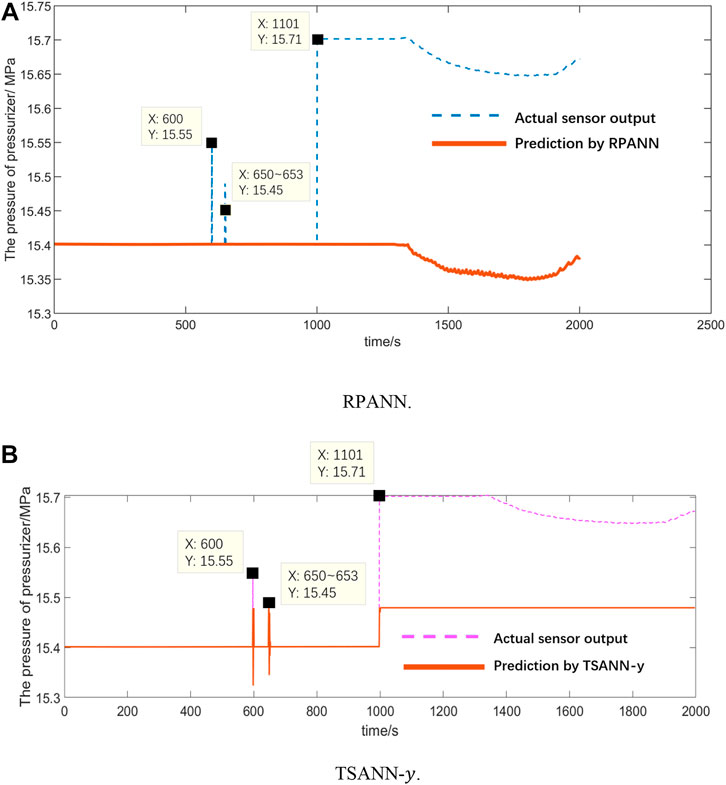
FIGURE 14. Monitoring curve of the pressure in the primary-circuit pressurizer with the RPANN and TSANN for the case of a
The following can be observed in Figure 14A:
1) Before the onset of CBF at 1001 s, the actual sensor output agrees well with the analytically predicted value by the RPANN. Due to the setting in the IQR-based outlier detection method, the sporadic relative deviation of
2) At the time of 1001 s, due to the occurrence of a
3) With progression of the transient process, the
The printed-out monitoring curve with TSANN-
1) Before the onset of CBF at 1001 s, the actual sensor output agrees in general well with the analytically predicted value by TSANN-
2) The time series-based TSANN-
3) However, the sudden change of the pressure due to the
To summarize, the DOFD scheme proposed in this study can serve as online monitoring and fault diagnosis of redundant hardware sensors. A reconstruction of readings of faulty hardware sensors can also be conducted with analytically prediction by the previously trained RAPNN. In this manner, the operation condition of the reactor can be retained despite the onset of faulty conditions in the redundant sensors. This is of high interest for reducing maintenance cost and enhancing economic competitiveness of a nuclear power plant since the reactor can be operated in full-power mode until the next scheduled maintenance. Possible on-site repair or replacement of the faulty sensors can be postponed and conducted in the next scheduled periodic maintenance of the power plant.
In view of the problem that redundant hardware sensors with the same functional structure and in the same working environment in PWR nuclear power plants are vulnerable to common mode faults (CMF), analytic software redundancy based on an artificial neural network (ANN) was constructed in this study by using the high-fidelity dataset provided by a full-scope PWR simulator. In compliance with the “diversity principle,” a distributed online sensor fault detection (DOFD) scheme was then proposed by combining the ANN-based analytic redundancy and the existing hardware redundancy. Taking the pressure sensor of the PWR primary-circuit pressurizer as an example, the feasibility of the DOFD scheme to realize the functions of sensor monitoring, fault diagnosis, early warning, and reading reconstruction is preliminarily investigated. The main results and conclusions derived are summarized as follows:
1) due to the limited availability of actual real plant data, a full-scope PWR simulator was employed in this study to provide high-fidelity data close to the actual operation state of a typical 1000 MWe PWR power plant for the offline training and validation of the ANN. Compared to the traditional point reactor model, the full-scope simulator has the advantage of providing a complete dataset covering all the important components of an actual PWR power plant. Furthermore, it is also easy to expand the training and validation data for ANNs covering a wide range of possible operational conditions or even accidental conditions of a PWR power plant in order to enhance the generalization ability of the ANNs established in this study.
2) By using the complete dataset obtained in a full-scope PWR simulator as training, validation, and test data, a relevant parameter-based ANN black-box (RPANN) model was established by employing the BP learning algorithm. Combining the ANN-based analytic redundancy with the existing hardware redundancy, a distributed online sensor fault detection (DOFD) scheme was proposed. Its feasibility of online monitoring of the hardware status and an online diagnosis of sensor faults was successfully demonstrated with the pressure sensor in the primary-circuit pressurizer as an example.
3) More importantly, the ANN-based analytic redundancy can also replace the faulty hardware sensor to provide an analytically reconstructed reading of the monitored sensor parameter without having to reduce the reactor power output or even shut down the reactor for emergency maintenance. On-site calibration frequency of hardware sensors in redundant channels can, hence, be effectively reduced. This is of vital importance in reducing the operation and maintenance costs of existing PWR nuclear power plants. The diverse redundancy in the DOFD scheme combining analytic software redundancy and physical hardware redundancy can effectively reduce the threat of CMF of redundant hardware sensors on the operational safety of the reactor systems.
Compared to hardware redundancy, the ANN-based software redundancy proposed in this study shows the advantage of cost-efficiency and high flexibility that can be customized according to the requirement of the monitored objective sensor. However, before its possible deployment in an actual PWR power plant, the following points should be considered in future studies:
1) First, it should be noted that the core of the sensor fault detection scheme proposed in this study is a relevant parameter-based ANN black-box (RPANN) model. Essentially speaking, the RPANN is a mathematical approximation of the physical relation between the chosen input thermal-hydraulic variables and the objective sensor parameter. Hence, the choice of input thermal-hydraulic variables is of vital importance for performance of the RPANN. A PWR power plant is a large system, and the physical relations between different thermal-hydraulic parameters are rather complex. An appropriate choice of input variables for the RPANN, hence, requires expert experience, if the proposed online sensor diagnosis scheme is to be deployed in actual PWR power plants in the future.
2) Furthermore, it should be pointed out that the preliminary investigation conducted in this study on the feasibility of the proposed DOFD is based on a known constant-bias fault (CBF). The fault mode and the associated impact on the actual sensor output were already well-defined. However, if the proposed DOFD scheme is to be deployed in a real PWR power plant, its responsibility of online sensor monitoring and fault diagnosis should be fulfilled without any given information on the fault mode or the related consequences. Therefore, more comprehensive investigations of the proposed DOFD scheme on the diagnosis of more fault modes, especially those frequently encountered in actual PWR power plants, should be conducted in future studies.
3) Last but not the least, the proposed DOFD scheme also has important application prospects in the next generation of advanced small modular reactors (SMRs). Since SMRs are usually deployed in remote areas and used for multifunctional purposes, the working condition of SMRs will be more rapidly changing. Simultaneously, the number of maintenance personnel of SMRs will be much lesser than that of traditional PWRs. Therefore, SMRs will require more online intelligent fault diagnosis methods of important sensors, such as the one proposed in this study.
The raw data supporting the conclusion of this article will be made available by the authors, without undue reservation.
YY: conceptualization, methodology, investigation, project administration, and writing—original draft preparation; FX: software, investigation, data curation, visualization, and writing—original draft preparation; BP: conceptualization, methodology, writing—original draft preparation, writing—review and editing, project administration, and funding acquisition.
This work was financially supported by the Natural Science Foundation of Guangdong Province (2021A1515010391) and the University Stability Support Program of Shenzhen (Grant No. 20200803132736020).
The authors declare that the research was conducted in the absence of any commercial or financial relationships that could be construed as a potential conflict of interest.
All claims expressed in this article are solely those of the authors and do not necessarily represent those of their affiliated organizations, or those of the publisher, the editors, and the reviewers. Any product that may be evaluated in this article, or claim that may be made by its manufacturer, is not guaranteed or endorsed by the publisher.
Ayo-Imoru, R. M., and Cilliers, A. C. (2017). Hybrid nuclear plant simulator design requirements to enable dynamic diagnostics of plant operations. Ann. Nucl. Energy 101, 447–453. doi:10.1016/j.anucene.2016.11.034
Chen, J., Li, H., Sheng, D., and Li, W. (2015). A hybrid data-driven modeling method on sensor condition monitoring and fault diagnosis for power plants. Int. J. Electr. Power & Energy Syst. 71, 274–284. doi:10.1016/j.ijepes.2015.03.012
Gavin, H. P. (2013). The Levenberg-Marquardt method for nonlinear least squares curve-fitting problems. Durham, North Carolina: Department of Civil and Environmental Engineering, Duke University.
Hashemian, H. M. (2010). Aging management of instrumentation & control sensors in nuclear power plants. Nucl. Eng. Des. 240 (11), 3781–3790. doi:10.1016/j.nucengdes.2010.08.014
Hwang, I., Kim, S., Kim, Y., and Seah, C. E. (2010). A survey of fault detection, isolation, and reconfiguration methods. IEEE Trans. Control Syst. Technol. 18 (3), 636–653. doi:10.1109/tcst.2009.2026285
Khentout, N., Salhi, H., Magrotti, G., and Merrouche, D. (2018). Fault monitoring and accommodation of the heat exchanger parameters of triga-mark II nuclear research reactor using model-based analytical redundancy. Prog. Nucl. Energy 109, 97–112. doi:10.1016/j.pnucene.2018.02.019
Kim, Y., Park, J., Jung, W., Choi, S. Y., and Kim, S. (2018). Estimating the quantitative relation between PSFs and HEPs from full-scope simulator data. Reliab. Eng. Syst. Saf. 173, 12–22. doi:10.1016/j.ress.2018.01.001
Littlewood, B. (1996). The impact of diversity upon common mode failures. Reliab. Eng. Syst. Saf. 51 (1), 101–113. doi:10.1016/0951-8320(95)00120-4
Ni, X., Zheng, J., Hou, E., Hao, J., Bian, B., and Li, N. (2016). Simulation of early phase radioactivity of CPR1000 plant under LOCAs based on RELAP5-3D core engineering simulator. Prog. Nucl. Energy 93, 47–58. doi:10.1016/j.pnucene.2016.07.019
Peng, M., Wang, H., Yang, X., Liu, Y., Guo, L., Li, W., et al. (2017). Real-time simulations to enhance distributed on-line monitoring and fault detection in Pressurized Water Reactors. Ann. Nucl. Energy 109, 557–573. doi:10.1016/j.anucene.2017.04.041
Ray, A., and Phoha, S. (2000). Calibration and estimation of redundant signals. Automatica 36 (10), 1525–1534. doi:10.1016/s0005-1098(00)00067-4
Rumelhart, D. E., Hinton, G. E., and Williams, R. J. (1986). Learning representations by back-propagating errors. Nature 323 (6088), 533–536. doi:10.1038/323533a0
Rusaw, R.EPRI Project Manager (2014). Guidelines for instrument calibration extension/reduction - revision 2: Statistical analysis of instrument calibration data, EPRI technical repor.t
Tambouratzis, T., Giannatsis, J., Kyriazis, A., and Siotropos, P. (2020). Applying the computational intelligence paradigm to nuclear power plant operation: A review (1990-2015). Int. J. Energy Optim. Eng. 9 (1), 27–109. doi:10.4018/ijeoe.2020010102
Keywords: common mode failure, artificial neural network, fault diagnosis, CPR1000 full-scope PWR simulator, BP algorithm
Citation: Yin Y, Xu F and Pang B (2022) Online intelligent fault diagnosis of redundant sensors in PWR based on artificial neural network. Front. Energy Res. 10:1011362. doi: 10.3389/fenrg.2022.1011362
Received: 04 August 2022; Accepted: 05 September 2022;
Published: 20 September 2022.
Edited by:
Peiwei Sun, Xi’an Jiaotong University, ChinaCopyright © 2022 Yin, Xu and Pang. This is an open-access article distributed under the terms of the Creative Commons Attribution License (CC BY). The use, distribution or reproduction in other forums is permitted, provided the original author(s) and the copyright owner(s) are credited and that the original publication in this journal is cited, in accordance with accepted academic practice. No use, distribution or reproduction is permitted which does not comply with these terms.
*Correspondence: Bo Pang, Ym8ucGFuZ0BzenUuZWR1LmNu
Disclaimer: All claims expressed in this article are solely those of the authors and do not necessarily represent those of their affiliated organizations, or those of the publisher, the editors and the reviewers. Any product that may be evaluated in this article or claim that may be made by its manufacturer is not guaranteed or endorsed by the publisher.
Research integrity at Frontiers
Learn more about the work of our research integrity team to safeguard the quality of each article we publish.