- 1East China Tianhuangping Pumped Storage Power Co., Ltd, Hangzhou, China
- 2State Grid Shandong Maintenance Company, Jinan, China
Hydroelectric energy storage, that is, pumped storage hydropower (PSH) is considered as the essential solution for grid reliability with high penetration of renewable power, due to its advantages of cost-effectiveness for grid energy storage as well as supporting ancillary services. However, the operation modes of the main transformer unit in PSH are way more complex than the conventional power transformer, which makes the condition monitoring and fault detection of PSH becoming a technical challenge. In this article, an operation status recognition model of main transformers in PSH based on artificial visualization of mechanical vibration signals and deep learning is proposed. The vibration signals on a series of 500 kV/360 MVA main transformers of PSH are monitored periodically by contacting sensor arrays. These vibration signals are processed into nephograms by using linear interpolation fitting and 1D to 2D data mapping. A deep learning method based on the convolutional neural network (CNN) is used to classify nephograms obtained under different operation modes, that is, no load, full load, DC bias, and short circuit. The proposed status prediction algorithm was trained and tested through 150 sets of vibration nephogram samples, which ensures the feasibility of the nephogram generation method and the performance of the classifier. The testing results show that the overall status prediction accuracy for the proposed algorithm achieves 89.7% when the network structure is optimized. It is indicated that the mechanical vibration of the main transformer has a pattern matching relationship with the operating state of PSH. In practice, the operating status of PSH can be diagnosed remotely by embedded IoT sensors; the health index of PSH can also be estimated by weighed analysis of the changing trend of vibration data obtained in the life cycle.
Introduction
The carbon neutrality target by countries worldwide has raised the demand in combining the power system with energy storage units, in order to buffer the system instability brought by high penetration of the renewable energy system (Hunt et al., 2020; Feng et al., 2021). With the ability of quick responding to changes in the amount of power running through the grid, pumped storage hydropower (PSH) is considered as the primary choice for ensuring grid reliability. PSH is also one of the most cost-effective utility-scale option for grid energy storage (Hou et al., 2018), with the advantages of providing clean and affordable ways of storing and deploying electricity, as well as supporting ancillary services such as network frequency control and reserve generation (Zhao et al., 2021). The United States has more than 20 GW of pumped storage capacity in 2021, with an additional 31 GW in proposal. The situation is even more impressive in China, since the total capacity of pumped storage has reached over 50 GW, accounting for more than 80% of energy storage nationwide. The proper function of electricity generation for PSH relies on the successful switching between pumping and turbine modes (Liang et al., 2019). During mode shifting, the excitation state of the main transformer in PSH might change intensely in a few hours; thus, the system stability of the main transformer is essential for the operation reliability of PSH. As the core component of PSH, main transformers are not only expensive but also difficult to repair or replace (Zhang et al., 2021). In recent years, the development of the AC/DC hybrid power grid and the application of large power electronic equipment have made it possible for the main transformer to withstand various operating overvoltage, excitation inrush current, and the resulting electric stress and thermal stress of winding under DC bias and high frequency harmonic, such that it is closely combined with regional rail transportation network transformer which is affected by high-frequency harmonics. At the same time, the application of a large number of power electronic devices makes the electromagnetic environment in the transformer more complicated.
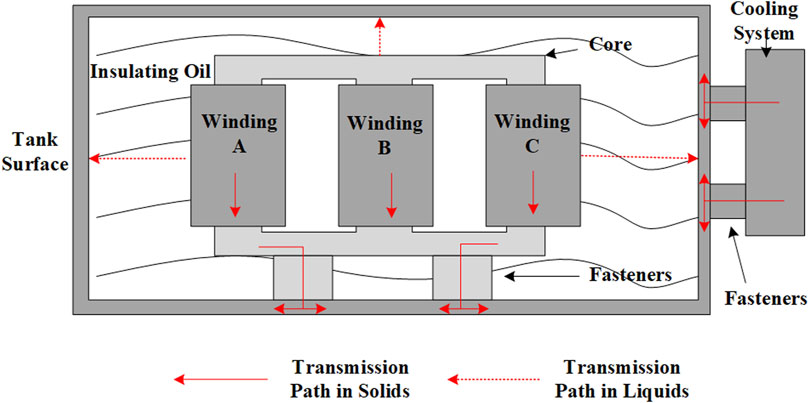
Similar to power transformer in operation, the iron core of the main transformer is subjected to main magnetic flux, and the windings are subjected to alternating magnetic flux leakage, both of which lead to mechanical vibration (Cheng and Yu, 2018). The vibration is transmitted to the transformer shell through internal structural parts and insulating oil. When the internal operation state of the transformer changes, the vibration state of the tank surface changes accordingly (Žarković and Stojković, 2017). Since the early 1990s, much research work in identifying influence factors for transformer vibration, extracting signature signals of vibration, and establishing transformer vibration models have been carried out. It is indicated that the mechanical vibration signals obtained from the tank surface can be used as an effective tool for system condition monitoring and fault diagnosis (Fan et al., 2017; Kirkbas et al., 2020). However, most of the actual vibration measurements are obtained from the tank surface of single-phase model transformers; the specific vibration monitoring method still lacks PSH in the case of main transformers. In addition, the current vibration signal measuring method heavily relies on the classification of 1D vibration acceleration information obtained by mechanical sensors, that is, the vibration information is generated from few discrete measuring points (Tightiz et al., 2020; Xu et al., 1997). The overall distribution of mechanical vibrations cannot be obtained, which makes it difficult to analyze the precise operation state of main transformers in PSH.
Recently, the deep learning method, that is, artificial neural network (ANN), has been increasingly used in the asset management of power systems (Thada et al., 2021; Ghoneim et al., 2016). Among all the ANN methods, convolutional neural network (CNN) is widely accepted as one of the most effective solutions to the fault diagnosis of graphical inspection information, such as infrared images and video surveillance of high-voltage electric equipment, due to the application of gradient descent and error back-propagation in the network training process (Idowu et al., 2016; Daelemans et al., 2003). Regarding the potential application of CNN in combination with vibration signals in operation status classification of main transformers in PSH (Ghoneim et al., 2016), the most important step is to transfer the 1D vibration signals into 2D numpy arrays in image file types; only in this way, the precise feature extraction of CNN can be carried out.
This study aims at encapsulating the operation status of main transformers in PSH from visualized vibration data by using advanced deep learning methods. Two-dimensional visualization of transformer surficial vibration is carried out by using linear interpolation and data mapping of vibration data generated on 21 measuring points evenly distributed on the tank surface of the main transformer. The visualized vibration data are then trained by a specified CNN network with two convolution layers, two pooling layers, and 1 full connected layer. The feature extraction and mode classification of PSH in four modes, that is, full load, no load, DC bias, and short current, are carried out by integrating rectified linear unit (ReLU) activation and batch normalization function. The proposed method accelerates the early risk detection since the sensors on the surface works periodically without interrupting the normal operation of main transformers.
Methodology
Technical Framework for Operation Risk Assessment of PSH
The technical framework for the operation risk assessment of PSH based on condition monitoring of the main transformer is shown in Figure 1. By incorporating intelligent risk assessment based on pattern recognition from main transformer vibration in the process of operation and maintenance, the individual and clustered equipment operation status data in PSH can be comprehensively collected. Consequently, health index analysis such as operation status threshold value and trending, as well as health index warning and lifetime estimation can be carried out. Based on the operation risk assessment, the systematical alarm policies and device health warning lists can be created to timely alert early deterioration in the device and system. Eventually, the optimized PSH operation status management strategy can be formed.
Mapping Relationship Between Transformer Vibration and PSH Operation Status
During operation, the vibration of the transformer tank mainly comes from the vibration of the core, winding, voltage regulator, and cooling system. The transmission path of inherent vibration to the tank surface is shown in Figure 2. The tank vibration caused by the core is in the order of 100 kHz, whereas vibration caused by winding could be calculated by taking the vibration in non-loading status as reference. The vibration caused by the cooling system mainly ranges in the frequencies lower than 100 Hz, whereas the vibration caused by the voltage regulator mainly ranges in the frequencies higher than 1 kHz (Ji et al., 2020). By carrying out data clustering on the vibration signals obtained on the tank surface, the origins of the vibration can be easily distinguished; and the precise relationship between the forms of vibration data and transformer component under different working conditions can be easily found.
Vibration Data Visualization
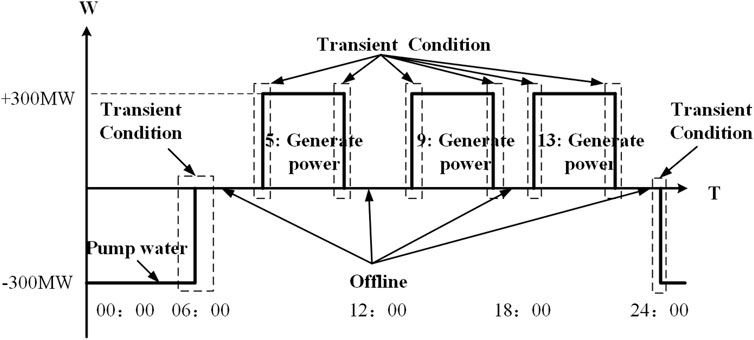
The typical loading conditions of main transformer in PSH are shown in Figure 3. The main transformer is in the pump status once a day and in the generator state three times a day. The operation status of the main transformer in PSH is way more complex than that of the conventional power transformer, that is, it could suffer offline, pump water, phase modulation, generate power, and transient conditions in a row. In the worst-case scenario, fault and breakdown could occur during frequent switching of the operation status. The various working conditions of PSH greatly increase the complexity of vibration signals obtained from the main transformer. The traditional vibration signal monitoring methods try to distinguish the operation mode of the transformer through the establishment of the vibration mathematical model manually. However, all the traditional methods cannot deal with transient non-periodical vibration signals. Only 1D type of vibration data can be collected through these methods, which makes it difficult to consider both the vibration information in time domains and frequency domains (Xi et al., 2020). The advanced data processing technologies such as deep learning is also impossible to be proposed on 1D series of data as some key information such as correlating events with time series for incident accidents could possibly be missing during training.
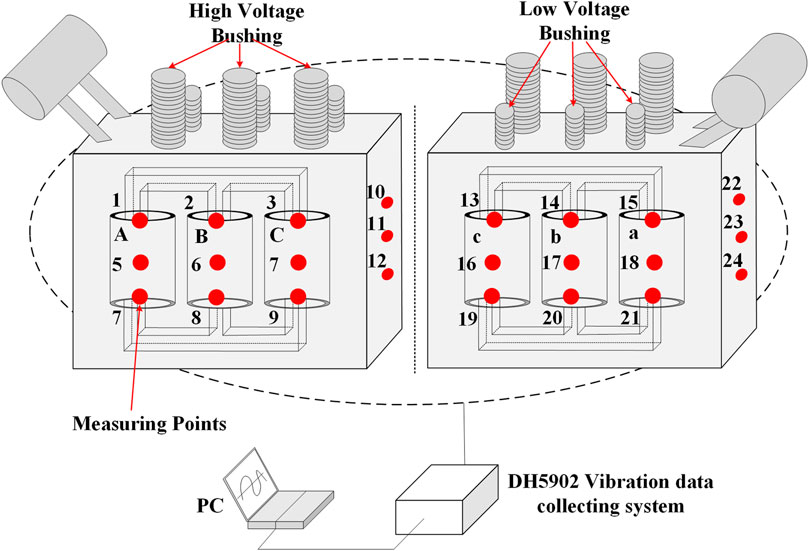
In order to solve the aforementioned issues, a new data visualization method to transfer the 1D series type of data to the 2D matrix type of data is proposed, including vibration data collection by sensor arrays, as well as data mapping by perspective transformation. Since the typical magnetic circuit structure for the PSH main transformer is in the type of three-phase five-limb transformer, the closer the sensor is to the areas over against the winding and core, the more precise the mechanical state can be obtained. The setup for vibration sensor arrays is shown in Figure 4. The arrays are made up of 21 measuring points in total, where 9 measuring points are set on the high-voltage side and low-voltage side, respectively, and 3 additional measuring points are set on top of the tank. The measuring points are located on top, middle, and bottom sides of the surface areas over against A, B, and C phases of windings. The 16-channel acceleration sensor system DH5902N is used in this study, with a capability of frequency response ranging from 0.5 Hz to 7 kHz.
The vibration signal measurement system is composed of four parts: data acquisition, data integration, data output, and back-end processing. Firstly, the vibration signal of transformer tank surface is collected by vibration acceleration sensor, used in the process of acquisition of the synchronous clock line to realize synchronous measurement between multiple devices, each channel signal processing chip between mutual independence, can realize the multichannel vibration signals, and the exciting current signal synchronous real-time collection and analysis. Then the vibration tester completes the sensor signal conversion analysis and output to the post-processing end.
The typical sampling of vibration data collected from the transformer tank is shown in Figure 5. Under the same operation condition, the waveform and amplitude of vibration data are quite similar in different time periods. Once the operation condition is changed, the shape of vibration curves changes significantly, which indicates that the extremum on the periodically changed vibration curves can be taken as the signature feature for transformer mode recognition. For the simplification of data processing, the extremum of each measuring point is defined as the mean value of all the peak vibration values measured in 10 min continually.
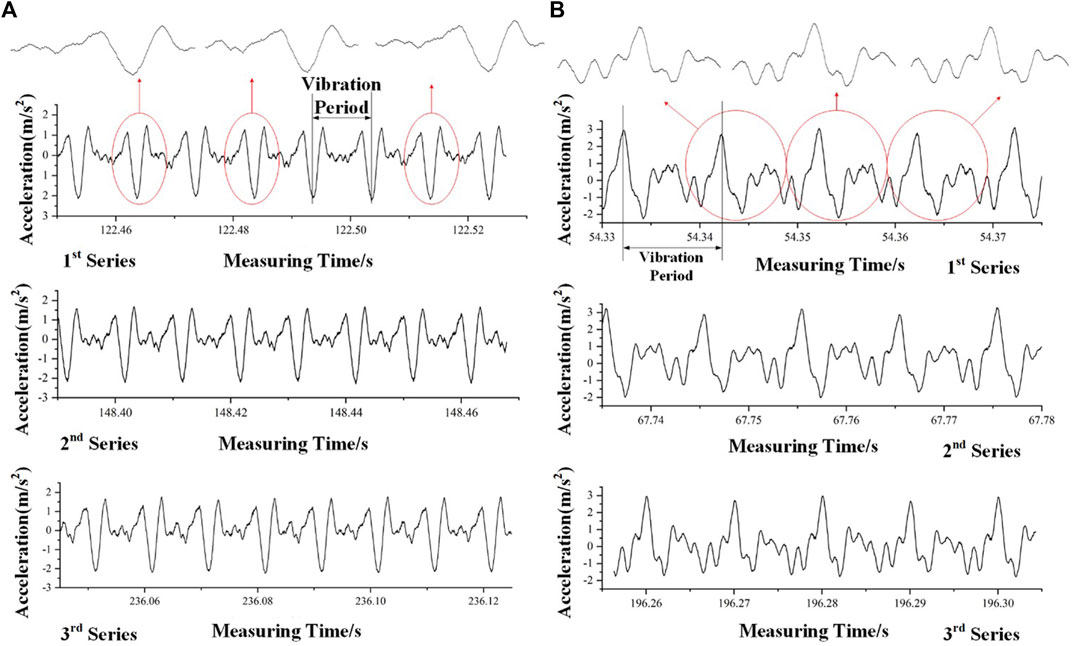
FIGURE 5. Typical sampling of vibration data. (A) Non-loading condition; (B) full-loading condition].
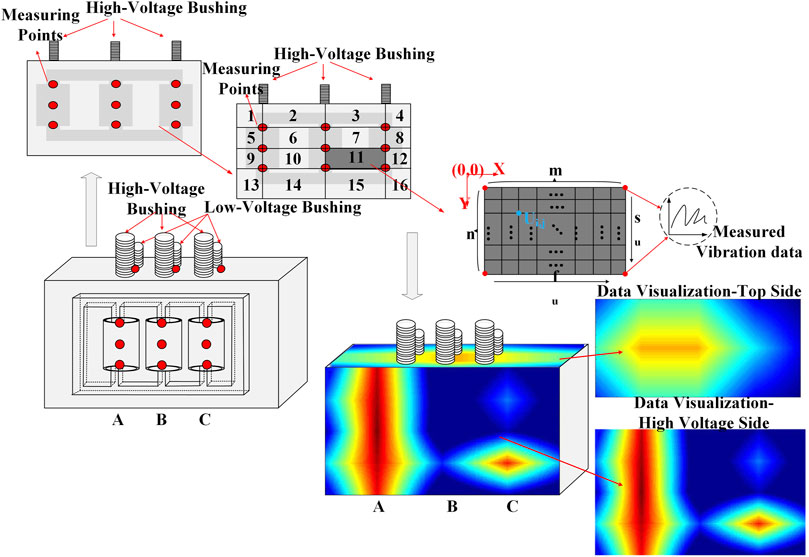
After the original vibration data are processed by feature extraction and data numeralization, the data mapping and data visualization of transformer vibration can be carried out. The detailed steps for the perspective transformation of 1D series data to 2D matrix data are shown in Figure 6.
Figure 6 shows the solution process of the vibration nephogram based on the linear interpolation method. Taking the position of the vibration measurement point as the node, the surface of the tank is divided into regions, and each region is interpolated to obtain the distribution of the characteristic value of the overall vibration acceleration. In Figure 6, area 11 is taken as an example, and it is divided into m×n meshes, and the vibration acceleration values at the nodes of the generated meshes are solved. The specific value of m × n can be set according to the actual resolution requirements. The red in the figure is the position of the vibration measurement point, the blue is the position of the point to be determined, Ui. j is the vibration acceleration characteristic value at (i,j), fu is the x-direction interpolation function, and su is the y-direction interpolation function. Since the influence of the axial force of the winding vibration is greater than the amplitude force, the y-axis is the main interpolation direction, and x is the auxiliary interpolation direction. The values of u0,0∼um,0、u0,n ∼ um,n are solved by fu, ui,j (1 ≤ i ≤ m, 1 ≤ j ≤ n). The value su is solved, and fu and su are shown in the following Formula 1:
After the characteristic values of vibration acceleration on each node in all regions of the whole tank surface are obtained, the pseudo-color image processing is unified, that is, the complete vibration cloud image of the tank surface can be obtained.
PSH Operation Status Recognition Based on Convolutional Neural Network
As a typical representative of deep learning, the convolutional neural network was first proposed by biologists Huber and Visser in 1962 in the study of cat visual system. It is a kind of feedforward neural network. As a supervised learning algorithm, CNN, like the traditional neural network, must use labeled data to conduct model training, so as to predict the samples to be recognized through the model.
As a multilayer neural network, the basic network structure of CNN is shown in Figure 7. First, the one-dimensional or multidimensional array is input from the input layer, and then feature extraction and sampling processing are carried out through the convolution layer C1 and sampling layer S1. The operations of convolution layer C2 and sampling layer S2 are consistent with those of C1 and S1. Finally, the full connection layer expands it into a one-dimensional vector F3 and passes it to the output layer through activation function (Zhao et al., 2020).
The convolution layer contains multiple convolution kernels, and each of its constituent elements corresponds to a weight coefficient and a deviation quantity. Feature extraction and nephograms are carried out by the inner product. Let each input sample be x, the number of convolution kernels be n, and the size of all convolution kernels be m × 1. Generally, the output form of the kth convolution kernel of the convolution layer is shown in Formula 2:
In Formula 2,
The sampling layer, also known as the pooling layer, is a sampling operation after feature extraction, as shown in S1 and S2 in Figure 7. After feature extraction at the convolutional layer, the pooling layer replaces the value of the pixel with the statistical value of the nephogram of the adjacent area of a single pixel through the preset pooling function to complete the selection and filtering of feature information. At the end of the sampling process, the size of the feature graph will be reduced, but its number remains constant. Assuming that the sampling width is q × 1, generally, the output result of the sampling layer S matching the kth convolution kernel is as follows:
In Formula 3,
The model uses the back-propagation algorithm to optimize the network structure and solve the network parameters, that is, the excitation propagation and weight update are carried out repeatedly and iteratively until the objective function converges to a preset range. The solving process of network parameters is divided into two steps. First, the cost function between the actual output and the ideal output is calculated, and then the network is trained with the criterion of minimizing the cost function through the back-propagation algorithm of supervised learning. The training loss function is shown in Formula 4:
In Formula 4,
The calculation formula of the iteratively updated weight W and bias parameter b is given as follows:
In Formulas 5, 6: xp represents the output of layer p; d p+1represents the error term of p+1 layer; and h stands for learning rate.
Field Test Results and Discussions
Origin of Vibration Data and Construction of Data Set
The data are from six main transformers of a pumped storage power station, all of which have been running for more than 10 years. The data comes from six main transformers of a pumped-storage power station. These transformers have been in operation for more than 10 years, and they are all main-transformer three-phase five-column structures. No. 1, 3, and 5 transformers are non-excitation voltage regulating transformers, and No. 2, 5, and 6 transformers are on-load voltage regulating transformers. The difference between them is that the pressure regulation range and cooling method are different, and other parameters are the same. Table 1 is the main technical parameters of the two different main transformers.
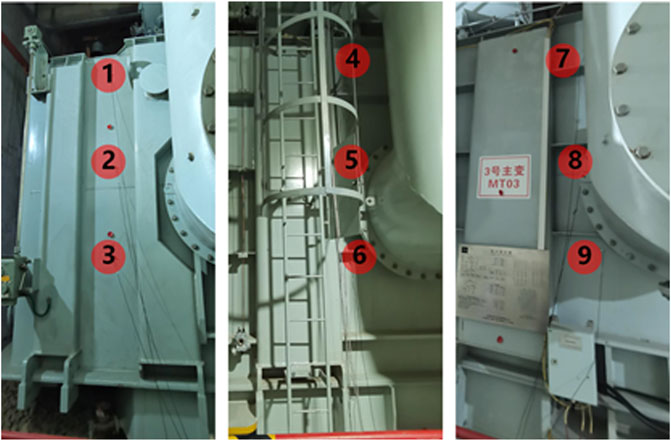
DH5902N data acquisition and analysis system was used for vibration signal measurement. The sensor was 1A111E IEPE piezoelectric acceleration sensor with a axial sensitivity of 100 mV/g and sampling frequency of 20 kHz. The sensors are directly attached to the surface of the main transformer tank surface for measurement, and 9 side points are selected on the wide side of each transformer, as shown in Figure 8. Each device operating condition corresponds to a data label, and each data label contains time domain, frequency domain, and time–frequency atlas. After visualization processing of the time domain data of 9 electrical measurements, the generated visualized spectra under four typical working conditions are shown in Figure 9, including the visualized cloud images of no load, full load, DC magnetic bias, and short circuit working conditions.
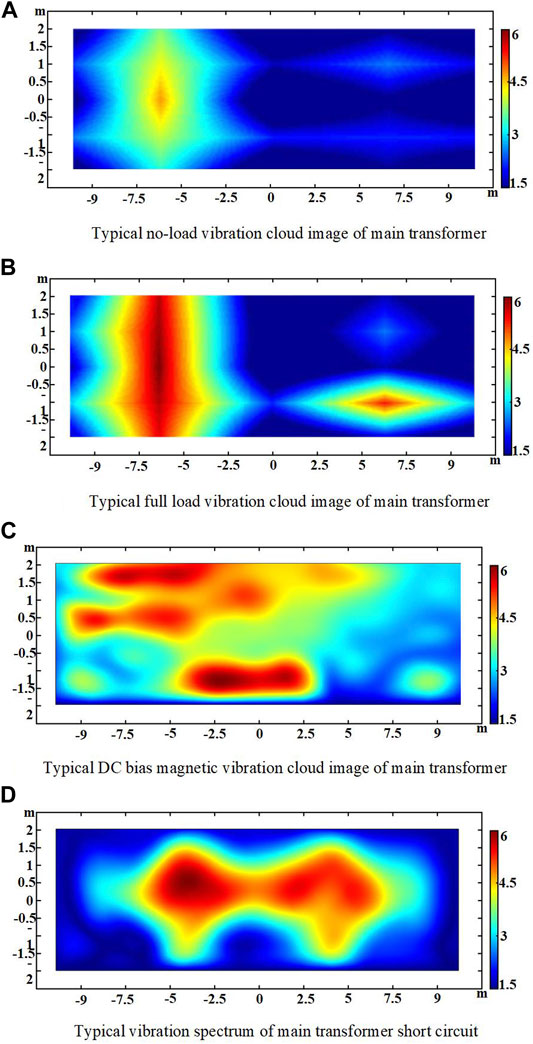
FIGURE 9. Typical vibration map. (A) Typical no-load vibration cloud image of main transformer. (B) Typical full load vibration cloud image of main transformer. (C) Typical DC bias magnetic vibration cloud image of main transformer. (D) Typical vibration spectrum of main transformer short circuit.
Effect of Network Parameters on the Recognition Efficiency
In the structure of convolutional neural network, the accuracy and convergence speed of the network will change with the activation function selected at the convolutional layer. Sigmoid, tanh, and leaky ReLU functions are three activation functions commonly used in the convolution layer, and their formulas are, respectively, given in the following equations.
Sigmoid function is
Tanh function is
Leaky ReLU function is
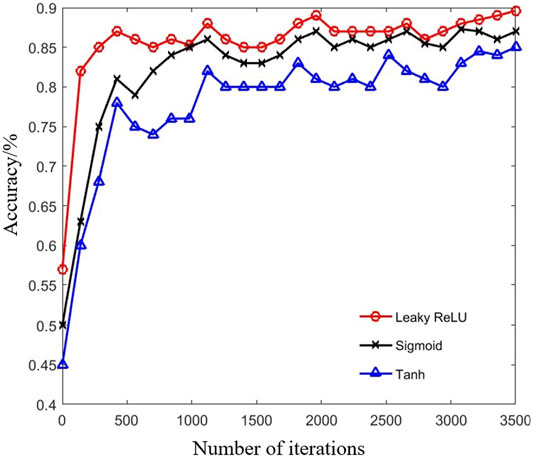
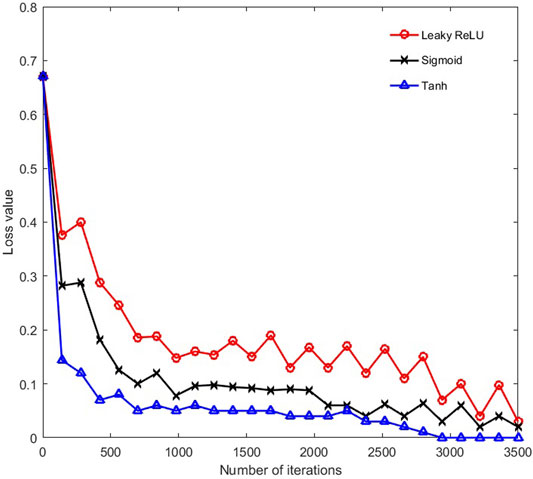
Considering the influence of different activation functions on the experimental results, three different activation functions were used in the convolution layer to conduct comparative experiments, and the comparison results are shown in Figures 10, 11. It can be seen that when leaky ReLU function is selected as the activation function in the convolution layer, the classification recognition effect of this model is the best. When leaky ReLU function is used as the activation function in the convolution layer, the number of iterations of the model is the least and the recognition accuracy is the highest, reaching 89.7%. It is significantly higher than the recognition results under tanh function and sigmoid function, and the loss value after convergence is far smaller than those in the other two cases.
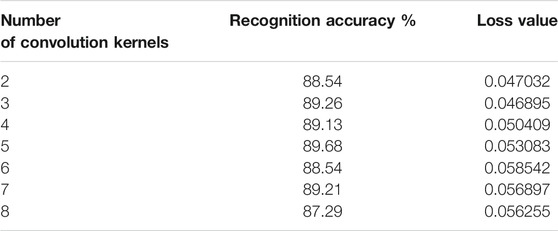
In the structure of the convolutional neural network, the number of convolutional kernels will affect the recognition accuracy of the model. Therefore, this study compares and analyzes the recognition results under different convolution kernels through experiments. As can be seen from Table 2, loss values under different numbers of convolution kernels range from 0.11 to 0.13, which all meet the requirements of convergence. As can be seen from the comparison results of recognition accuracy, when the number of convolutional kernels is 5, the accuracy is 89.78%. Therefore, when five convolution kernels are selected at the convolution layer, the classification effect of the algorithm is the best.
Comparison of Different Deep Learning Models
In order to verify the application value of the algorithm in the field of main transformer vibration pattern recognition, the SVM algorithm and BP neural network algorithm are selected to compare with the algorithm in this study among the existing conventional algorithms, and the genetic algorithm is selected to optimize its network parameters, as shown in Table 3. All experiments in this article were conducted on computers equipped with an I7-8700 processor, NVDIA TITAN X graphics card, and 16G memory.
First, the unified and normalized training data set is used as the input of the support vector machine to obtain the training model, and then the test data set is substituted into the training model to test the accuracy of the training model. Second, the unified and normalized training data set is used as the input of the support vector machine to obtain the training model, and then the test data set is substituted into the training model to test the accuracy of the training model. Among them, radial basis kernel function is selected for support vector machine, crossover probability is 0.3, mutation probability is 0.01, and genetic algorithm is used to optimize the parameters of SVM, where the maximum evolutionary algebra is 200, the number of individuals is 50, the value of penalty factor C is (0.01, 200), the value of kernel function parameter G is (0.001, 200), and the generation gap is 0.9. The final parameter selection result is C = 38.245, g = 0.0568.
Taking the same experimental data set as the input of BP neural network and SVM algorithm, the recognition accuracy is 79.9 and 83.2%, respectively. The recognition rate of CNN neural network has certain advantages over these two traditional algorithms. Experimental results show that the recognition method based on convolutional neural network has better recognition performance than the traditional algorithm, which reflects a good advance.
Promotion of the Proposed Method on Risk Assessment of PSH
The proposed PSH operation risk assessment method based on vibration visualization and deep learning can be extended to the digital operation maintenance of PSH. As shown in Figure 12 the digital twin of the PSH system can be evaluated by building the refined 3D model of main transformers in the multi-physical field coupling system with visualized monitoring data as reference. In order to ensure the digital model to cover all the typical faults and defects that could possibly occur during the lifetime of PSH, other non-electrical signals such as infrared and ultraviolet detections are also advised for condition monitoring of main transformers. The refined model could be reproduced from a scaling modeling data of the 3D scan of the actual equipment.
Conclusion
This article proposes a PSH main transformer operating-state recognition model based on mechanical vibration signal artificial visualization and deep learning. By means of linear interpolation and data mapping for vibration data of 21 measuring points with uniform distribution of the main transformer groove surface, two-dimensional visualization of transformer surface vibration is realized. The vibration information with transformer load information is transformed into feature images and trained by the designated CNN network, thus realizing the classification of working state. This method has been applied to the status monitoring of the main transformer of PSH, realizing the status recognition of the four modes of the main transformer. This method provides a new idea for operation risk assessment of hydroelectric energy storage, that is, transformer vibration signal is periodically detected by embedded IOT sensor array. On the one hand, transformer failure warning can be achieved in a short time. On the other hand, the health index of transformer can be estimated through the change trend of vibration data in the life cycle obtained by long-term monitoring, and the formulation of the optimal maintenance plan can be finally realized (Chen and Guestrin, 2016, O'Shaughnessy et al., 2021, Duan et al., 2010, Aydin et al., 2008).
Data Availability Statement
The original contributions presented in the study are included in the article/supplementary materials; further inquiries can be directed to the corresponding author.
Author Contributions
The individual contributions of the authors are as follows: SL carried out data curation; WW contributed to formal analysis; ZZ framed methodology; YL supervised; and HL wrote the original draft. All authors have read and agreed to the published version of the manuscript.
Conflict of Interest
Authors SL, WW, ZZ, and YL were employed by East China Tianhuangping Pumped Storage Power Co., Ltd. Author HL was employed by State Grid Shandong Maintenance Company.
Publisher’s Note
All claims expressed in this article are solely those of the authors and do not necessarily represent those of their affiliated organizations, or those of the publisher, the editors, and the reviewers. Any product that may be evaluated in this article, or claim that may be made by its manufacturer, is not guaranteed or endorsed by the publisher.
References
Aydin, T. O., Mantiuk, R., Myszkowski, K., and Seidel, H.-P. (2008). Dynamic Range Independent Image Quality Assessment. ACM Trans. Graph. 27, 1–10. doi:10.1145/1360612.1360668
Chen, T., and Guestrin, C. (2016). “XGBoost,” in Proceedings of the 22nd ACM SIGKDD International Conference on Knowledge Discovery and Data Mining, 785–794. doi:10.1145/2939672.2939785
Cheng, L., and Yu, T. (2018). Dissolved Gas Analysis Principle-Based Intelligent Approaches to Fault Diagnosis and Decision Making for Large Oil-Immersed Power Transformers: A Survey. Energies 11, 913. doi:10.3390/en11040913
Daelemans, W., Hoste, V., De Meulder, F., and Naudts, B. (2003). “Combined Optimization of Feature Selection and Algorithm Parameters in Machine Learning of Language,” in European Conference on Machine Learning (Springer), 84–95. doi:10.1007/978-3-540-39857-8_10
Duan, J., Bressan, M., Dance, C., and Qiu, G. (2010). Tone-mapping High Dynamic Range Images by Novel Histogram Adjustment. Pattern Recognition 43, 1847–1862. doi:10.1016/j.patcog.2009.12.006
Fan, J., Wang, F., Sun, Q., Bin, F., Liang, F., and Xiao, X. (2017). Hybrid RVM-ANFIS Algorithm for Transformer Fault Diagnosis. IET Generation, Transm. Distribution 11, 3637–3643. doi:10.1049/iet-gtd.2017.0547
Feng, C., Li, C., Chang, L., Mai, Z., and Wu, C. (2021). Nonlinear Model Predictive Control for Pumped Storage Plants Based on Online Sequential Extreme Learning Machine with Forgetting Factor. Complexity 2021, 1–19. doi:10.1155/2021/5692621
Ghoneim, S. S. M., Taha, I. B. M., and Elkalashy, N. I. (2016). Integrated ANN-Based Proactive Fault Diagnostic Scheme for Power Transformers Using Dissolved Gas Analysis. IEEE Trans. Dielect. Electr. Insul. 23, 1838–1845. doi:10.1109/TDEI.2016.005301
Hou, J., Li, C., Tian, Z., Xu, Y., Lai, X., Zhang, N., et al. (2018). Multi-Objective Optimization of Start-Up Strategy for Pumped Storage Units. Energies 11 (5), 1141. doi:10.3390/en11051141
Hunt, J. D., Zakeri, B., Lopes, R., Barbosa, P. S. F., Nascimento, A., Castro, N. J. d., et al. (2020). Existing and New Arrangements of Pumped-Hydro Storage Plants. Renew. Sust. Energ. Rev. 129, 109914. doi:10.1016/j.rser.2020.109914
Idowu, S., Saguna, S., Åhlund, C., and Schelén, O. (2016). Applied Machine Learning: Forecasting Heat Load in District Heating System. Energy and Buildings 133, 478–488. doi:10.1016/j.enbuild.2016.09.068
Ji, S., Zhang, F., Shi, Y., and Zhan, C. (2020). Review on Vibration-Based Mechanical Condition Monitoring in Power Transformers. High Voltage Eng. 46 (01), 257–272. doi:10.13336/j.1003-6520.hve.20191227019
Kirkbas, A., Demircali, A., Koroglu, S., and Kizilkaya, A. (2020). Fault Diagnosis of Oil-Immersed Power Transformers Using Common Vector Approach. Electric Power Syst. Res. 184, 106346. doi:10.1016/j.epsr.2020.106346
Liang, L., Hou, Y., and Hill, D. J. (2019). GPU-based Enumeration Model Predictive Control of Pumped Storage to Enhance Operational Flexibility. IEEE Trans. Smart Grid 10 (5), 5223–5233. doi:10.1109/tsg.2018.2879226
O'Shaughnessy, E., Heeter, J., Shah, C., and Koebrich, S. (2021). Corporate Acceleration of the Renewable Energy Transition and Implications for Electric Grids. Renew. Sust. Energ. Rev. 146, 111160. doi:10.1016/j.rser.2021.111160
Thada, A., Panchal, S., Dubey, A., and Bhaskara Rao, L. (2021). Machine Learning Based Frequency Modelling. Mech. Syst. Signal Process. 160, 107915. doi:10.1016/j.ymssp.2021.107915
Tightiz, L., Nasab, M. A., Yang, H., and Addeh, A. (2020). An Intelligent System Based on Optimized Anfis and Association Rules for Power Transformer Fault Diagnosis. ISA Trans. 103, 63–74. doi:10.1016/j.isatra.2020.03.022
Xi, L., Wu, J., Xu, Y., and Sun, H. (2021). Automatic Generation Control Based on Multiple Neural Networks with Actor-Critic Strategy. IEEE Trans. Neural Netw. Learn. Syst. 32, 2483–2493. doi:10.1109/TNNLS.2020.3006080
Xu, W., Zhou, Z., Chen, H., and Wang, D. (1997). Fault Diagnosis of Power Transformers: Application of Fuzzy Set Theory, Expert Systems and Artificial Neural Networks. IEE Proc. - Sci. Meas. Tech. 144, 39–44. doi:10.1049/ip-smt:19970856
Žarković, M., and Stojković, Z. (2017). Analysis of Artificial Intelligence Expert Systems for Power Transformer Condition Monitoring and Diagnostics. Electric Power Syst. Res. 149, 125–136. doi:10.1016/j.epsr.2017.04.025
Zhang, K., Zhou, B., Or, S. W., Li, C., Chung, C. Y., and Voropai, N. I. (2021). “Optimal Coordinated Control of Multi-Renewable-To-Hydrogen Production System for Hydrogen Fueling Stations,” in Proceeding of the IEEE Transactions on Industry Applications, June 2021 (IEEE), 1. doi:10.1109/TIA.2021.3093841
Zhao, G., Zhang, Y., and Ren, J. (2021). Analysis of Control Characteristics and Design of Control System Based on Internal Parameters in Doubly Fed Variable-Speed Pumped Storage Unit. New Jersey, NY: Complexity. doi:10.1155/2021/6697311
Keywords: risk assessment, hydroelectric energy storage, state prediction, data visualization, convolutional neural network
Citation: Lu S, Wei W, Zhu Z, Liang Y and Liu H (2022) Operation Risk Assessment of Hydroelectric Energy Storage Based on Data Visualization and Convolutional Neural Network. Front. Energy Res. 9:827942. doi: 10.3389/fenrg.2021.827942
Received: 02 December 2021; Accepted: 30 December 2021;
Published: 24 January 2022.
Edited by:
Jian Zhao, Shanghai University of Electric Power, ChinaReviewed by:
Lujia Wang, China University of Mining and Technology, ChinaHualong Zheng, Chongqing University, China
You Zhou, Changsha University of Science and Technology, China
Copyright © 2022 Lu, Wei, Zhu, Liang and Liu. This is an open-access article distributed under the terms of the Creative Commons Attribution License (CC BY). The use, distribution or reproduction in other forums is permitted, provided the original author(s) and the copyright owner(s) are credited and that the original publication in this journal is cited, in accordance with accepted academic practice. No use, distribution or reproduction is permitted which does not comply with these terms.
*Correspondence: Hui Liu, bGl1aHVpc3RhdGVncmlkQDE2My5jb20=
 Sheng Lu1
 Wei Wei
 Hui Liu
