- College of Electrical Engineering and New Energy, China Three Gorges University, Yichang, China
Aiming at the lumped-circuits model of the lossless transmission line in the digital simulation, the article discusses and analyzes the unit step response generation of the lumped-circuits model by comparing the numerical simulation results of the implicit trapezoidal method, the implicit Euler method, and a multi-step formula. The root cause of numerical oscillations pointed out that using the L-stable numerical algorithm to indirectly simulate the dynamic response of the lumped-circuits model is a numerical method that does not truly reflect the original model, but it can directly reflect the true dynamic response of the lossless transmission line. In this study, a method for determining the chained number in the digital simulation of a lumped-circuits model is given. The simulation results prove the effectiveness of the method.
Introduction
In the digital simulation model of lossless transmission lines, the model using the circuit equivalent model to study the physical characteristics of transmission lines is called the lumped-circuits model, which is different from the classical finite-difference time-domain algorithm model. As the name suggests, the lumped-circuits is different from the distributed parameter circuit, which uses a partial differential equation to describe the voltage fluctuation process. The former uses lumped inductance and capacitance to approximate the physical characteristics of lossless transmission lines with distributed parameter characteristics. Cui (2018) pointed out that there are fundamental differences between the two, and they cannot be completely equivalent in physical characteristics. Therefore, only appropriate approximation methods (Shen et al., 2020; Shen et al., 2021; Shen and Raksincharoensak, 2021) can be found to ensure that the lumped-circuits of the transmission line can be approximately equivalent to the distributed parameter circuit.
The modeling of the transmission line transient response needs to select an appropriate physical model according to the frequency of the system research signal. The lumped-circuits model is a commonly used approximate model for physical simulation and digital simulation of transmission lines, but its significant problem in digital simulation is numerical oscillation (Ye et al., 2021). In order to solve this problem, various numerical algorithms are used to solve the transient response of transmission lines, but there are different defects in dealing with numerical oscillation. Root-matching techniques (Watson and Irwin, 1998) solve this problem well and are the main algorithm to solve the problem of numerical oscillation at present. Song et al. (2020) proposed an efficient electromagnetic transient simulation method based on the discrete similarity principle, which further expanded the application scope of root-matching techniques. Although the root-matching techniques can better solve the numerical oscillation problem, in a strict sense, these discrete calculation principles cannot ensure that the physical characteristics of the transmission line do not change. Therefore, the research on the numerical algorithm that can keep the physical structure of the transmission line from distortion has become a very important research subject.
In addition, the number of the chained circuits is a key parameter for the lumped-circuits of lossless transmission lines in physical analogy. Cui (2017) gives an estimation formula for determining the chained number of the lumped-circuits in the physical analogy of lossless transmission lines. This formula is also useful for the estimation (Yang et al., 2019a; Yang et al., 2019b; Yang et al., 2021a; Zhang et al., 2021) of the chained number in the digital simulation, but it can not be directly applied. The influence of the approximation error (Yang et al., 2018; Yang et al., 2021b) of the numerical algorithm needs to be considered.
For a long time, the lumped-circuits model of lossless transmission lines was often used as the electromagnetic simulation model of transmission lines (Paul, 1994; Min and Mao, 2007), but little is known about the numerical characteristics of the model. Starting from the characteristics of three lumped-circuits, the numerical characteristics of the lumped-circuits model, including its unit step response and sine excitation response, are studied in detail. The relevant conclusions can provide reference for the application range and method of the lumped-circuits model of lossless transmission lines. In addition, this study pointed out that the numerical algorithm of symplectic conservation can accurately simulate the physical characteristics of lossless transmission lines.
Lumped-Circuits Model of Lossless Transmission Lines
Basic Lumped-Circuits Model
Usually, the state space model is used to solve the dynamic response of lossless transmission lines. First, the lossless transmission lines need to be discretized in space to obtain blocks of

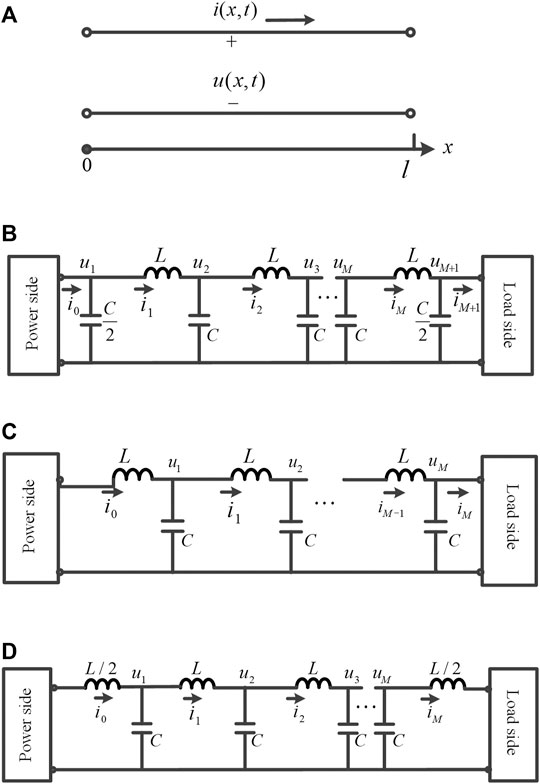
FIGURE 1. Lossless transmission line and its three equivalent lumped-circuits. (A) Lossless transmission line. (B) Lumped-circuits consisted of M
According to the topological characteristics of the above lumped-circuits, it is not difficult to see that the lumped-circuits consisting of chained inverse
Dynamic Response of the Lumped-Circuits Model
When the lossless transmission line shown in Figure 1A is connected with the characteristic impedance
The amplitude-frequency characteristics and phase-frequency characteristics of Eq. 1 are as follows:
where
For the lumped-circuits shown in Figures 1B,D, when the terminal is matched, the frequency response characteristic of the ending voltage transfer function is as follows (Cui, 2017; Cui, 2018):
where
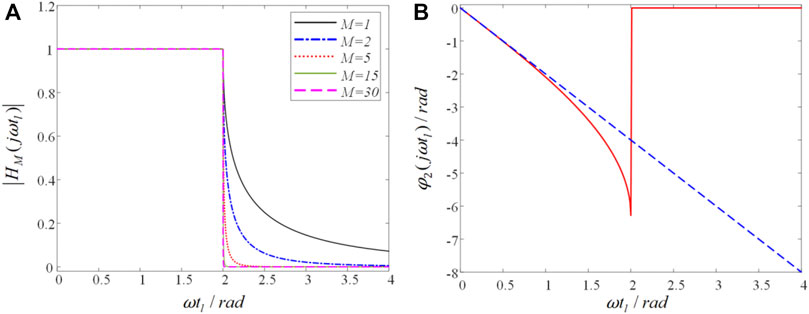
As shown in Figure 2A, the amplitude-frequency response curve of the lumped-circuits when

FIGURE 2. Frequency response curve. (A) Amplitude-frequency response curve when
Although it is theoretically possible to meet the property that the amplitude-frequency response of the lossless transmission line is always 1 and the phase relative error is 4.72% by physically controlling the frequency of the excitation source, it is inevitable to introduce numerical errors when using the numerical integration algorithm to solve the state space equation of the lumped-circuits (Lei et al., 2009). Therefore, reducing and avoiding the amplitude and phase errors caused by numerical calculation is the problem to be solved in this study.
Numerical Characteristics of the Lumped-Circuits Model
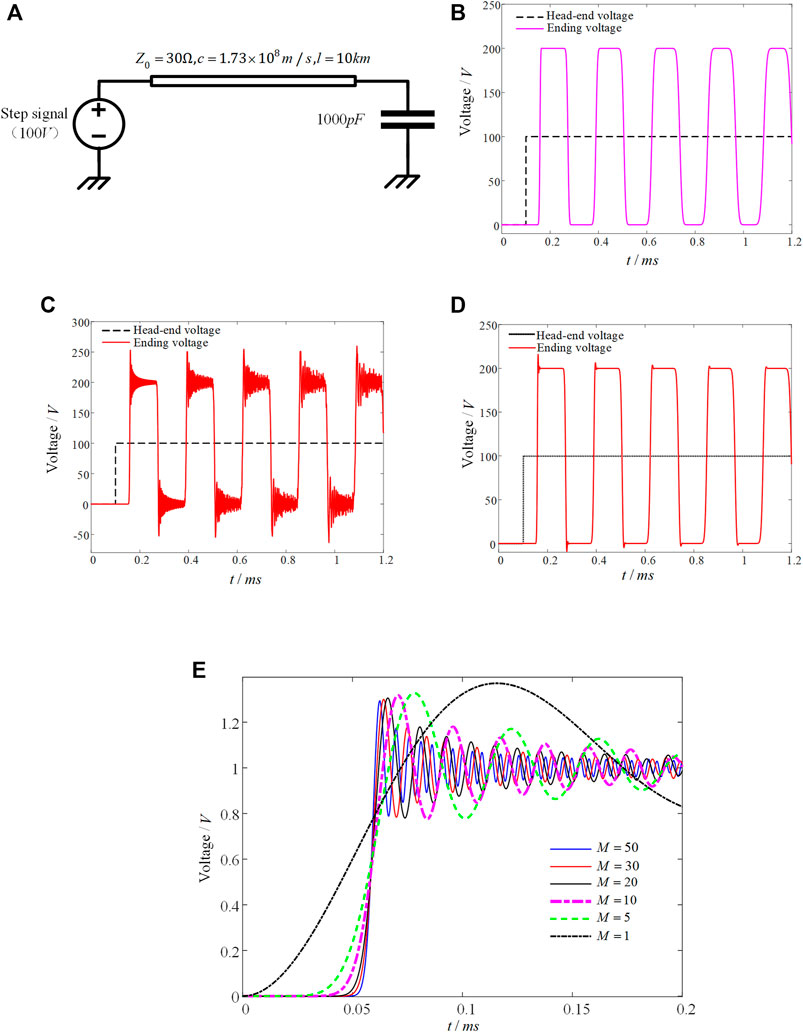
Figure 3A shows an example of a double conductor lossless transmission line. The wave impedance of the lossless transmission line is
For the Following Initial Value Problems
The approximate formula of the implicit trapezoidal integral formula (TR) for approximately solving the state variable
where
Similarly, the calculation format of the implicit Euler method (IE) is as follows:
The calculation format of the four-step method (FM) is as follows:
Table 1 shows the comparison of the three numerical algorithms. It can be seen that the properties of the three algorithms are different, and the solution effect of the actual problem is also different. The time domain response results of a single lossless transmission line will be analyzed in detail below.
Taking the lumped model in Figure 1B as an example, a set of linear differential equations can be obtained according to the circuit law as follows:
In Eq. 7,
Applying constraints to Eq. 7, we get the following:
In the simulation, the resistance in the ideal voltage source is
It can be seen from Figures 3B,D that under the
Therefore, the relative phase error of the algorithm is defined as follows:
where
The reason for the signal transmission delay under the lumped-circuits model is due to the charge discharge process of capacitance and inductance and the dissipative process of load energy in the lumped-circuits, which is obviously different from the wave process of lossless transmission lines.
In addition, the ending voltage calculated using the implicit trapezoidal method has obvious numerical oscillation. In order to further study the physical mechanism of numerical oscillation, this study uses the implicit trapezoidal method to solve the ending voltage response of different chained numbers
The above shows that the implicit trapezoidal integration method retains the dynamic response characteristics of the step response of the lumped-circuits because it does not have numerical L-stable (Noda et al., 2014; Chakraborty and Ramanujam, 2018), which just reflects the real numerical characteristics of the lumped-circuits. On the contrary, because of the L-stable of the implicit Euler method and the four-step method in the study by (Wang et al., 2019), the overshoot and oscillation characteristics of the unit step voltage waveform are suppressed and the details of the dynamic response process of the lumped-circuits are obliterated, so they are impossible for truly simulating the physical process (Wang and Yang, 2016).
The above conclusions show that whether the selection of the numerical algorithm is appropriate is very important to reflect the real dynamic response process of the lumped-circuits. Of course, this numerical oscillation is false for the lossless transmission line itself, which also shows that the lumped-circuits can not be completely equivalent to the lossless transmission line model. Therefore, the lumped-circuits is only a numerical approximation of the lossless transmission line model. In order to truly reflect the numerical characteristics of the lossless transmission line model, it is suggested that the numerical algorithm with L-stable be used to simulate the lumped-circuits. Although the L-stable numerical algorithm dampens the overshoot and oscillation characteristics of the real waveform of the lumped circuit (Gao et al., 2021), it positively reflects the numerical characteristics of the lossless transmission line model.

FIGURE 3. Example analysis. (A) Step response model of the lossless transmission line. (B) Calculation results of the implicit Euler method. (C) Calculation results of the implicit trapezoidal method. (D) Calculation results of the four-step method. (E) Unit step response of the
Sine Excitation Response of the Lumped-Circuits Model
Different numerical algorithms have great differences in the numerical simulation results of the lumped-circuits, but this difference is not very obvious for the sine excitation response without the disturbance term. In addition, although the larger the chained number
For the lossless transmission line shown in Figure 3A, according to the previous analysis, considering that the ending voltage phase delay is in the linear interval. Assuming that the angular frequency of the sinusoidal excitation source meets
According to Eq. 11, in order to reduce the phase transmission error of the lumped-circuits model and ensure that the amplitude-frequency response characteristic is constant 1, the chained number
where the square brackets indicate rounding up.
In order to verify the correctness of the above conclusions, the
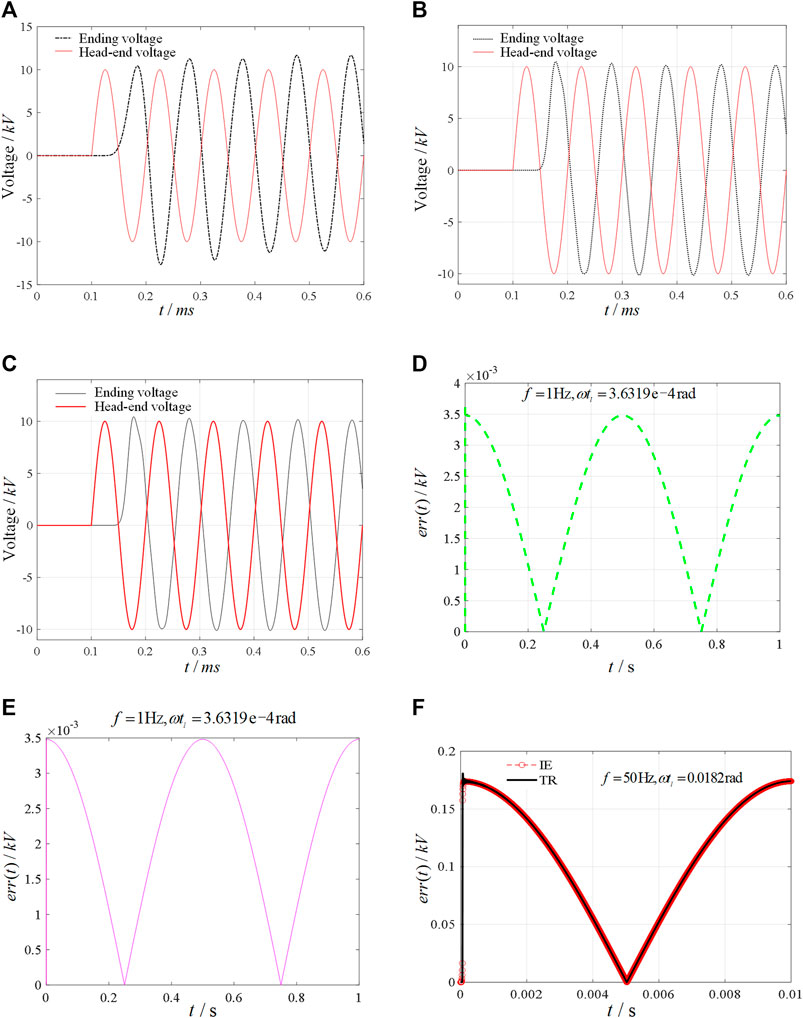
Using the numerical example shown in Figures 3A, a sine voltage excitation source with a frequency of 10
As can be seen from Figure 4, when

FIGURE 4. Chained number and numerical algorithm analysis of lumped-circuits numerical simulation. (A) M = 4 (the terminal resistance is 30 Ω). (B) M = 12 (the terminal resistance is 30 Ω). (C) M = 12 (the terminal resistance is 29.65 Ω). (D) Amplitude-frequency response error curve of the TR algorithm. (E) Amplitude-frequency response error curve of algorithm IE. (F) Amplitude-frequency response error curve of algorithms TR and IE.
As can be seen from Figures 4D,E, when the system frequency is small, that is, when
Conclusion
Starting from the equivalent lumped-circuits model of lossless transmission lines, this article mainly studies the boundary condition application methods of three equivalent lumped-circuits models. Users can flexibly choose the type of the equivalent lumped-circuits model according to the type of excitation source and load. The causes of numerical oscillation in digital simulation of the equivalent lumped-circuits model are explained theoretically, and the L-stable numerical algorithm is proposed to avoid this situation. A determination method of chained number of the equivalent lumped-circuits model is studied, and a specific application example is given. In conclusion, the method proposed in this study can provide the basis for the selection of model and numerical algorithm for the equivalent lumped-circuits model of lossless transmission lines in digital simulation.
Data Availability Statement
The raw data supporting the conclusion of this article will be made available by the authors, without undue reservation.
Author Contributions
HZ put forward the main research points and mathematical analysis; TL is responsible for the framework formation and revision; SZ collected relevant background information and completed simulation research; XZ completed manuscript writing.
Conflict of Interest
The authors declare that the research was conducted in the absence of any commercial or financial relationships that could be construed as a potential conflict of interest.
Publisher’s Note
All claims expressed in this article are solely those of the authors and do not necessarily represent those of their affiliated organizations, or those of the publisher, the editors, and the reviewers. Any product that may be evaluated in this article, or claim that may be made by its manufacturer, is not guaranteed or endorsed by the publisher.
References
Chakraborty, S., and Ramanujam, R. (2018). New Numerical Integration Methods for Simulation of Electromagnetic Transients. Int. J. Emerging Electric Power Syst. 19 (4), 122. doi:10.1515/ijeeps-2018-0122
Cui, X. (2018). Notes on Lumped-Circuits for Physical Analogy of Transmission Lines[J]. Zhongguo Dianji Gongcheng Xuebao/Proceedings Chin. Soc. Electr. Eng. 38 (1), 1–11. doi:10.13334/j.0258-8013.pcsee.171699
Cui, X. (2017). Chained Number of Lumped-Circuits for Physical Analogy of the Lossless Transmission Lines. Proc. Chin. Soc. Electr. Eng. 37 (09), 2561–2571. doi:10.13334/j.0258-8013.pcsee.162633
Gao, S., Chen, Y., Song, Y., and Huang, S. (2021). Three-stage Implicit Integration for Large Time-step Size Electromagnetic Transient Simulation with Shifted Frequency-Based Modeling. Electric Power Syst. Res. 198 (11), 107356. doi:10.1016/j.epsr.2021.107356
Lei, L., Xiang, C., and Lei, Q. (2009). Simulation of Electromagnetic Transients of the Bus Bar in Substation by the Time-Domain Finite-Element Method[J]. IEEE Trans. Electromagn. Compatibility 51 (4), 1017–1025. doi:10.1109/TEMC.2009.2028691
Min, T., and Mao, J. (2007). A Precise Time-step Integration Method for Transient Analysis of Lossy Nonuniform Transmission Lines[J]. IEEE Trans. Electromagn. Compatibility 50 (1), 166–174. doi:10.1109/TEMC.2007.913222
Noda, T., Kikuma, T., and Yonezawa, R. (2014). Supplementary Techniques for 2S ⁃DIRK ⁃ Based EMT Simulations[J]. Electric Power Syst. Res. (115), 87⁃93. doi:10.1016/j.epsr.2014.04.011
Shen, X., Ouyang, T., Khajorntraidet, C., Li, Y., Li, S., and Zhuang, J. (2021). Mixture Density Networks-Based Knock Simulator. Ieee/asme Trans. Mechatron., 1. doi:10.1109/TMECH.2021.3059775
Shen, X., and Raksincharoensak, P. (2021). Pedestrian-aware Statistical Risk Assessment. IEEE Trans. Intell. Transport. Syst., 1–9. doi:10.1109/TITS.2021.3074522
Shen, X., Zhang, Y., Sata, K., and Shen, T. (2020). Gaussian Mixture Model Clustering-Based Knock Threshold Learning in Automotive Engines. Ieee/asme Trans. Mechatron. 25 (6), 2981–2991. doi:10.1109/TMECH.2020.3000732
Song, W., Yao, S., Chang, L., Zhang, X., and Han, M. (2020). The Research of Electromagnetic Transient Simulation Method Based on Discrete Similarity[J]. Proc. Chin. Soc. Electr. Eng. 40 (21), 9. doi:10.13334/j.0258-8013.pcsee.200249
Wang, F., and Yang, M. (2016). Fast Electromagnetic Transient Simulation for over ⁃ Voltages of Transmission Line by High Order Radau Method and V-Transformation [J]. IET Generation Transm. Distribution 2016 10 (14), 3639–3645. doi:10.1049/iet-gtd.2016.0476
Wang, Y., Qiang, Li., Zhao, Wei., Zhang, Lei., and Chen, S. (2019). Electromagnetic Transient Simulation Algorithm Based on Improved Critical Damping Adjustment. Automation Electric Power Syst. (15), 180–185. doi:10.7500/AEPS20180413006
Watson, N. R., and Irwin, G. D. (1998). Electromagnetic Transient Simulation of Power Systems Using Root-Matching Techniques. IEE Proc. Gener. Transm. Distrib. 145 (5), 481–486. doi:10.1049/ip-gtd:19982173
Xing, Y., and Yang, R. (2007). Phase Errors and Their Correction in Symplectic Implicit Single-step Algorithm[J]. Chin. J. Theor. Appl. Mech. 39 (5), 4. doi:10.6052/0459-1879-2007-5-2006-561
Yang, N., Huang, Y., and Hou, D. (2019). Adaptive Nonparametric Kernel Density Estimation Approach for Joint Probability Density Function Modeling of Multiple Wind Farms[J]. Energies 12, 356. doi:10.3390/en12071356
Yang, N., Ye, Di., Zhou, Zh., Cui, J., Chen, D., and Wang, X. (2018). Research on Modelling and Solution of Stochastic SCUC under AC Power Flow Constraints[J. ].IET Generation, Transm. Distribution 12 (15), 3618–3625. doi:10.1049/iet-gtd.2017.1845
Yang, N., Huang, Y., Hou, D., Liu, S., Ye, D., Dong, B., et al. (2019). Adaptive Nonparametric Kernel Density Estimation Approach for Joint Probability Density Function Modeling of Multiple Wind Farms. Energies 12, 1356. doi:10.3390/en12071356
Yang, N., Liu, S., Deng, Y., and Xing, C. (2021). An Improved Robust SCUC Approach Considering Multiple Uncertainty and Correlation. IEEJ Trans. Elec Electron. Eng. 16, 21–34. doi:10.1002/tee.23265
Yang, N., Yang, C., Xing, C., Ye, D., Jia, J., Chen, D., et al. (2021). Deep Learning‐based SCUC Decision‐making: An Intelligent Data‐driven Approach with Self‐learning Capabilities. IET Gener. Transm. Distrib. 1, 12. doi:10.1049/gtd2.12315
Ye, J., Zhao, D., and Zhang, L. (2021). Research on Combined Electricity and Heating System Scheduling Method Considering Multi-Source Ring Heating Network[J]. Front. Energ. Res. Early Access.
Ye, J., Xu, M., Wang, Y., Li, B., Zhang, L., Yi, Z., et al. (2021). Time Domain Response Analyses of Multiconductor Transmission Lines Using L-Stable Single Step Multistage Block Method[J]. J. Xinyang Normal Univ. (Natural Sci. Edition) 34 (4), 639697–640644. doi:10.3969/j.issn.1003-0972.2021.04.022
Zhan, R., Li, Y., Jiao, C., Yu, Y., Meng, J., and Wang, B. “Time Delay along a Chained Lumped-Circuits: for the Physical Analogy of Half-Wavelength Power Transmission Lines,” in Proceedings of the 2017 IEEE 5th International Symposium on Electromagnetic Compatibility, EMC-Beijing), October 2017 (IEEE), 012044. doi:10.1088/1757-899x/231/1/012044
Keywords: lumped-circuits, digital simulation, lossless transmission line, numerical method, chained number
Citation: Zhou H, Lu T, Zhang S and Zhang X (2021) Lumped-Circuits Model of Lossless Transmission Lines and Its Numerical Characteristics. Front. Energy Res. 9:809434. doi: 10.3389/fenrg.2021.809434
Received: 05 November 2021; Accepted: 29 November 2021;
Published: 22 December 2021.
Edited by:
Zhenhao Tang, Northeast Electric Power University, ChinaReviewed by:
Kun Yu, Changsha University of Science and Technology, ChinaJun Wu, Wuhan University, China
Copyright © 2021 Zhou, Lu, Zhang and Zhang. This is an open-access article distributed under the terms of the Creative Commons Attribution License (CC BY). The use, distribution or reproduction in other forums is permitted, provided the original author(s) and the copyright owner(s) are credited and that the original publication in this journal is cited, in accordance with accepted academic practice. No use, distribution or reproduction is permitted which does not comply with these terms.
*Correspondence: Tianlin Lu, eDEzNjgzODIwN0AxNjMuY29t
 Huiyi Zhou
 Tianlin Lu