 Xianghua Li1,2
 Haodong Xie
- 1State Grid Hunan Electric Power Company Limited Economic and Technical Research Institute, Changsha, China
- 2State Grid Hunan Electric Power Company Limited, Changsha, China
- 3Hunan Key Laboratory of Energy Internet Supply-demand and Operation, Changsha, China
- 4College of Electrical and Information Engineering, Hunan University, Changsha, China
To achieve the goal of carbon peak and carbon neutrality, the integration of diversified renewable energy will be the principal feature of the planning framework of the smart grid, and the planning direction and focus of power systems would shift to the network transmittability and flexibility enhancement. This paper presents an infrastructure investment demand assessment model based on multi-level analysis method for the renewable-dominated power system planning. First, for the load side, the composite capacity ratio is used to assess the capacity demand of power transformation infrastructure for satisfying the load growth. Then, the renewable energy permeability is adopted as the basis to assess the extensional transmittability capacity for the integration of high renewables. Furthermore, the capacity demand of flexible transmission lines for power grid flexibility enhancement is also estimated. Finally, the amount of unit investment for source-network-load infrastructure capacities can be predicted based on the least square generation adjunctive network and support vector machine (LSGAN-SVM) algorithm. The performance of the proposed model has been tested and benchmarked on a practical-sized power system to verify its effectiveness and feasibility.
Introduction
Promoting a high proportion of renewable energy into the power system will become an important technical prerequisite for low-carbon development and energy transition (Tor et al., 2010; Xu et al., 2020). As one of the decisive factors of future power system network framework, accurate assessment of investment demand of the power system will provide technical support for high quality development of the power system. In order to adapt to a high proportion of renewable energy access system which is confronted by the lack of network transmittability and flexibility (Huang et al., 2021), existing assessment methods need to be improved accordingly. In this paper, the network transmittability and flexibility enhancement are brought into the scope of assessment for renewable-dominated power system planning.
Widely used assessment methods for investment demand can be divided into two categories, namely, time series prediction method (Li et al., 2019) and neural network prediction (Ma et al., 2020) method. Through the unit root test and Johansen cointegration test, the long-term equilibrium relationship model between power grid investment demand and maximum power load is presented, and the error correction model is further proposed to improve the short-term forecasting accuracy (Goude et al., 2014). Since the development trend of investment demand of power system planning is related to many influencing factors and has the possibility of abrupt change (Yang et al., 2016; Liu et al., 2017), the forecasting results will have a large deviation when the forecasting model is constructed only from the perspective of time and combined with the maximum power load. Therefore, the accuracy of time series prediction model in predicting investment demand of a power system needs to be improved. At present, there is a lot of research on investment demand assessment of power systems using the neural network prediction method (Ma et al., 2020). By using the analytic hierarchy process (AHP) which screens the key influential factors of investment demand of power system (Zhao et al., 2021) to forecast the trend of each factor, the investment demand is evaluated combined with the weight of each factor. Since the structure of the neural network has a great influence on the forecasting accuracy, the complex mapping relationship between each index and investment demand cannot be obtained, and the assessment results cannot be quantitatively analyzed when a certain parameter changes, so that the accuracy of the neural network prediction method to predict the investment demand of the power system needs to be further discussed. In general, the existing measurement methods of the investment demand only take the power transmission and transformation infrastructure as the principal target, and the investment to solve the problems that threaten the safe and stable operation of the power system has not become the core component of the assessment scope (Li et al., 2021). Besides, these measurement methods lack an accurate quantitative database, and the complex mapping relationship of key factors within the power system planning framework is ignored, making the results of the assessment unreliable (Zhang et al., 2021; Li et al., 2018).
In this paper, a multi-level investment demand assessment model is designed for renewable-dominated power system planning which satisfies the growth of load and enhances network transmittability and flexibility. The key contributions of this study are twofold:
1) A multi-level investment demand assessment model for renewable-dominated power system planning is presented. The power transformation infrastructure, network transmittability, and flexibility enhancement are taken as the principal entities of investment demand. The model quantifies the mapping relationship among infrastructure indexes of power system hierarchically and effectively, which is adapted to renewable-dominated power system.
2) A forecasting model of the amount of unit investment for source-network-load infrastructure capacity based on least square generation adjunctive network and support vector machine (LSGAN-SVM) algorithm is proposed. The historical data of infrastructure investment of each investment entity is used to enhance the generalization of the input samples. The extensional sample and the key influencing factors are input into the SVM algorithm to provide a reliable database for assessing investment demand.
Modeling of Multi-Level Investment Demand Assessment
Assessment Sub-model for Power Transformation Infrastructure
Investment Demand for Power Transformation Infrastructure
Considering the annual load growth, the infrastructure investment for load-side is mainly concentrated in the construction of 500 kV substations, 220 kV substations, 110 kV substations, and 10 kV distribution transformers, so the assessment sub-model for the amount of infrastructure investment for load-side is as follows:
where
The transformer capacity for 500, 220, and 110 kV substations are calculated on an annual basis, which are obtained by multiplying the maximum load of the corresponding voltage level by the composite capacity-load ratio, and it is formulated as follows:
where
Generally, the 10 kV transformers are distribution transformers and there is no concept of the composite capacity-load ratio. Therefore, the transformation capacity of 110 kV and the transformation capacity ratio are used to calculate the capacity variation of 10 kV distribution transformers, and it is assessed as follows:
where
Composite Capacity-Load Ratio
The capacity-load ratio (CLR) is a macro technical indicator reflecting the power source capacity in power system planning. The CLR within a reasonable range can sufficiently accommodate the load growth under a certain reliability level while maintaining a reasonable investment level. The CLR is formulated as follows:
where
In reality, the power grid may have the problem of unbalanced power source capacity and load distribution among substations, the transformer capacity of substations at the same voltage level is reasonable. However, the load rate of some substations is too high, even heavy load operation. In this case, CLR cannot reflect the severe shortage of power supply in some areas, thus the load ratio of individual substations is referenced and formulated as follows:
where
Due to the differences in reasonable CLR and degree of substations overload at different voltage levels under different load growth rates, the composite CLR is obtained by reasonably assigning the weights of CLR and load ratios, and is formulated as follows:
where
Assessment Sub-Model for Network Transmittability Enhancement
Considering that a high proportion of renewable energy is connected to the renewable-dominated power system, the infrastructure investment demand of transmittability enhancement is necessary, and it is assessed as follows:
where
Assessment Sub-model for Network Flexibility Enhancement
Due to the proportion of renewable energy in the system is increasing, the problems of operating efficiency and safety performance caused by insufficient system flexibility need to be improved urgently (Xiong et al., 2020). Flexible transmission infrastructure can quickly adjust line parameters and reduce the network congestion and transmission losses. The investment demand of flexible transmission infrastructure is assessed as follows (De Oliveira et al., 2000):
where
Forecasting Model of the Amount of Unit Investment for Infrastructure Capacity
Considering the data bases of
Noise data is input into generating network and generated data is obtained. The generated data and real data serve as the input of discriminant network. The output of discriminant network is the probability that the input data belongs to real data. Then, the least square loss function is calculated according to the probability, and the parameters of the networks can be updated by using the back propagation algorithm. Generative network and discriminant network establish dynamic game, both approach the optimal state in iterative training, and the generative model can produce reliable generated data.
The amount of unit investment for source-network-load infrastructure capacity is affected by a small number of key factors, such as the time difference of forming production capacity, the scope of infrastructure investment, the difference of investment intensity, the proportion of new expansion projects, equipment purchases cost, and installation cost. Therefore, this paper uses the SVM algorithm which avoids the over-fitting problem when dealing with small data prediction to predict the investment of unit infrastructure capacity to enhance the prediction accuracy. The forecasting model of the amount of unit investment for source-network-load infrastructure capacity based on LSGAN-SVM is presented in Figure 1.
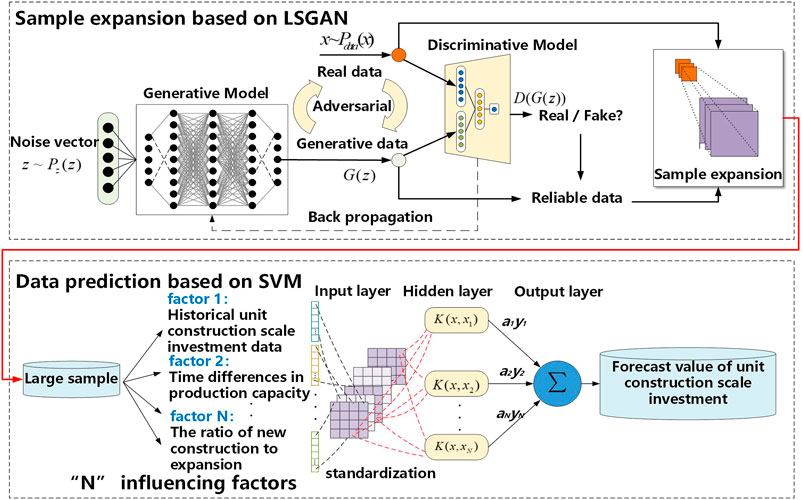
FIGURE 1. Forecasting model of the amount of unit investment for infrastructure capacity.
Multi-Level Investment Demand Assessment Model
The investment demand of renewable-dominated power system includes the investment in power transformation infrastructure for satisfying the growth of load, network transmittability, and flexibility enhancement, therefore, the multi-level infrastructure investment demand assessment model is as follows:
where
Overall Model Process
The multi-level investment demand assessment model can be divided into three modules. First, the multi-level investment demand assessment model for renewable-dominated power system planning is constructed. Then, all parameters are calculated and input to modules. Finally, the investment demand for power transformation infrastructure, network transmittability, and flexibility enhancement are assessed hierarchically. The overall assessment procedure of the model is presented in Figure 2.
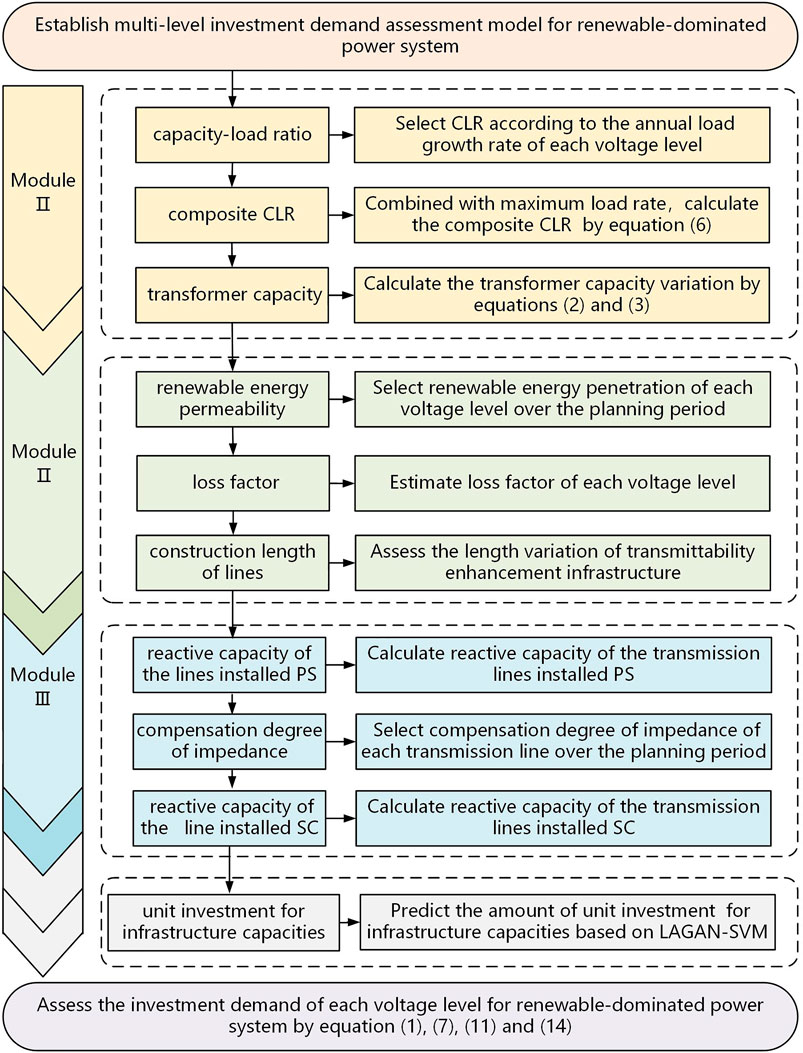
FIGURE 2. Multi-level investment demand assessment model process for power system.
Case Studies
Experimental Data and Settings
In this section, a renewable-dominated power system investment demand issue in a certain province is presented. Taking 2021 as an example, according to the annual load growth rate of 500 kV, 220 kV, and 110 kV voltage levels in 2021, the CLRs are selected as 1.7, 1.8, and 2.0, respectively. The ratio of the transformation capacity between 110 kV and 10 kV is 0.84. Renewable energy permeability of 500, 220, 110, and 10 kV are 0.5, 0.5, 0.4, and 0.6, respectively. The degree of series compensation are 0.3, 0.2, 0.2, and 0.4, respectively.
Results Analysis Based on Comparing with Existing Model
In order to reflect the higher accuracy of the multi-level investment demand assessment model proposed in this paper, it is compared with the existing power system investment demand assessment model. The existing model of the first type adopts the time series prediction method, which does not need to establish a causal relationship in modeling and can be modeled only with historical data. Basically, the future development can be predicted by referring to the past change trend of the power system investment demand. The existing second model adopts the neural network prediction method, which takes macroeconomic, power demand, grid size, grid benefit, and other influential factors of power system investment demand as well as historical data of investment demand as input, mining data characteristics and forecasting power system investment demand. The following are referred to as model I and model II, respectively.
Three models are, respectively, used to assess the investment demand of the province from 2012 to 2021, and the results are analyzed as follows. Taking 2021 as an example, based on the multi-level investment demand assessment model, the assessment results of the provincial power system in 2021 is shown in Table 1. The following are referred to as model III.
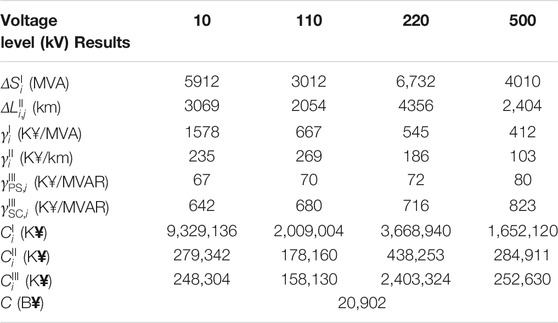
TABLE 1. The assessment results based on multi-level investment demand assessment model
Based on the two existing models, the investment demand assessment results of the province’s power system from 2012 to 2021 are shown in Figure 3, including comparison of the assessment results of the three models.
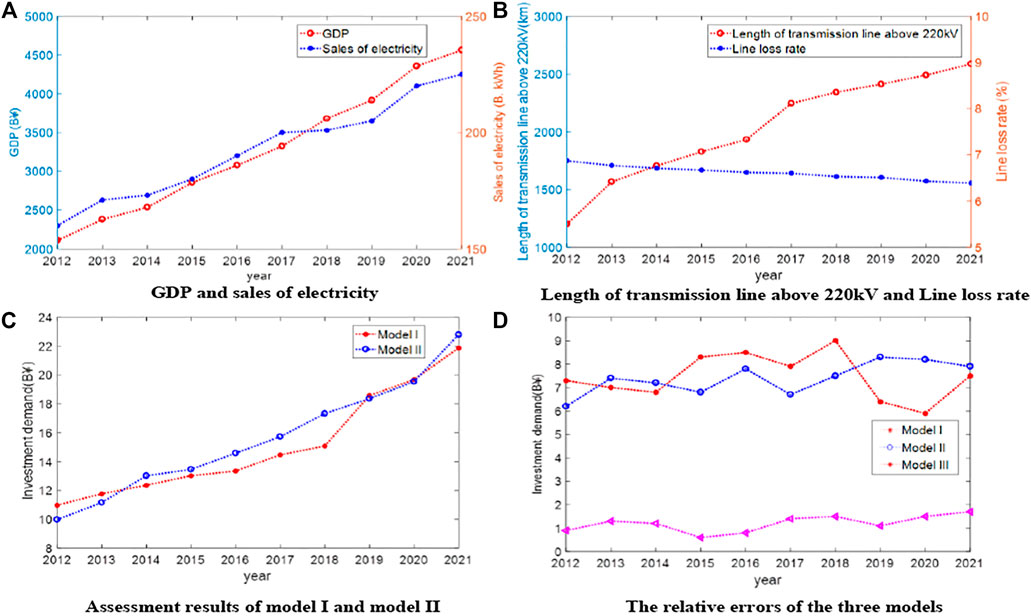
FIGURE 3. Input parameters and comparative results of three assessment models.
Based on the existing model I and II, the investment demand assessment results in 2021 are 21.861 B¥ and 22.782 B¥, respectively. The total investment of actual infrastructure in the province in 2021 is 20.899 B¥. The relative error of the assessment result of the existing model Ⅰ and model Ⅱ are 7.5 and 7.9%, respectively. The relative error of the evaluation result of the model proposed in this paper is 1.7%. Meanwhile, in Figure 3D, comparing the relative error curves of the assessment results of the three models from 2012 to 2021, the model proposed in this paper is more accurate.
Conclusion
In this paper, first, annual load growth rate and load ratio are selected to calculate the transformer capacity variation. Considering the reasonable ratio of renewable energy permeability and loss factor, calculate the extensional transmittability capacity. Then, the capacity demand of flexible transmission lines for power grid flexibility enhancement is also estimated. In view of various key influencing factors, combined with the historical data, the amount of unit investment for source-network-load infrastructure capacities are forecasted based on the LSGAN-SVM forecasting model. Finally, the investment demand of each voltage level for renewable-dominated power system is assessed by the multi-level investment demand assessment model. The results of case studies show that, compared with the existing assessment methods, the multi-level investment demand assessment model for renewable-dominated power system clarifies the complex and fuzzy mapping relationship of various investment demands, which verify its effectiveness and feasibility.
Data Availability Statement
The original contributions presented in the study are included in the article/Supplementary Material. Further inquiries can be directed to the corresponding author.
Author Contributions
Conceptualization, CL and XL; data curation, KS and BW; formal analysis, HX; methodology, HX and QY; software, HX and QY; visualization, WZ; writing—original draft, HX and CL; writing—review and editing, XL.
Funding
This work is supported by the State Grid Science and Technology Project (No.5100-202123009A).
Conflict of Interest
Authors XL, CL, and BW were employed by State Grid Hunan Electric Power Company Limited Economic; Technical Research Institute. Authors XL, CL, KS and BW were employed by State Grid Hunan Electric Power Company Limited.
The remaining authors declare that the research was conducted in the absence of any commercial or financial relationships that could be construed as a potential conflict of interest.
Publisher’s Note
All claims expressed in this article are solely those of the authors and do not necessarily represent those of their affiliated organizations, or those of the publisher, the editors, and the reviewers. Any product that may be evaluated in this article, or claim that may be made by its manufacturer, is not guaranteed or endorsed by the publisher.
References
De Oliveira, E. J., Marangon Lima, J. W., and De Almeida, K. C. (2000). Allocation of FACTS Devices in Hydrothermal Systems. IEEE Trans. Power Syst. 15 (1), 276–282. doi:10.1109/59.852133
Goude, Y., Nedellec, R., and Kong, N. (2014). Local Short and Middle Term Electricity Load Forecasting with Semi-parametric Additive Models. IEEE Trans. Smart Grid 5 (1), 440–446. doi:10.1109/tsg.2013.2278425
Huang, S., Wu, Q., Liao, W., Wu, G., Li, X., and Wei, J. (2021). Adaptive Droop-Based Hierarchical Optimal Voltage Control Scheme for VSC-HVDC Connected Offshore Wind Farm. IEEE Trans. Industry Inform. 17 (12), 8165–8176. doi:10.1109/TII.2021.3065375
Li, D., Yang, S., Huang, W., He, J., Yuan, Z., and Yu, J. (2021). Optimal Planning Method for Power System Line Impedance Based on a Comprehensive Stability Margin. IEEE Access 9, 56264–56276. doi:10.1109/access.2021.3071463
Li, J., Chen, L., Xiang, Y., Li, J., and Peng, D. (2018). Influencing Factors and Development Trend Analysis of China Electric Grid Investment Demand Based on a Panel Co-integration Model. Sustainability 10 (1), 256. doi:10.3390/su10010256
Li, Y., Liu, R. W., Liu, Z., and Liu, J. (2019). Similarity Grouping-Guided Neural Network Modeling for Maritime Time Series Prediction. IEEE Access 7, 72647–72659. doi:10.1109/access.2019.2920436
Liu, J., Gao, J., and Wang, Y. (2017). "Research on the Principles and Strategies of Power Grid Investment under the New Situation of Power Industry Reform," in 2017 Chinese Automation Congress (CAC). Jinan, China: IEEE, 6274–6278. doi:10.1109/CAC.2017.8243908
Ma, Y., Han, R., and Wang, W. (2020). Prediction-Based Portfolio Optimization Models Using Deep Neural Networks. IEEE Access 8, 115393–115405. doi:10.1109/access.2020.3003819
Tor, O. B., Guven, A. N., and Shahidehpour, M. (2010). Promoting the Investment on IPPs for Optimal Grid Planning. IEEE Trans. Power Syst. 25 (3), 1743–1750. doi:10.1109/tpwrs.2009.2039947
Xiong, L., Liu, X., Liu, Y., and Zhuo, F. (2020). Modeling and Stability Issues of Voltage-Source Converter Dominated Power Systems: a Review. Csee Jpes, 1–18. doi:10.17775/CSEEJPES.2020.03590
Xu, D., Wu, Q., Zhou, B., Li, C., Bai, L., and Huang, S. (2020). Distributed Multi-Energy Operation of Coupled Electricity, Heating, and Natural Gas Networks. IEEE Trans. Sustain. Energ. 11 (4), 2457–2469. doi:10.1109/tste.2019.2961432
Yang, F., Zhang, D., and Sun, C. (2016). China׳s Regional Balanced Development Based on the Investment in Power Grid Infrastructure. Renew. Sust. Energ. Rev. 53, 1549–1557. doi:10.1016/j.rser.2015.09.066
Zhang, K., Zhou, B., Or, S. W., Li, C., Chung, C. Y., and Voropai, N. I. (2021). Optimal Coordinated Control of Multi-Renewable-To-Hydrogen Production System for Hydrogen Fueling Stations. IEEE Trans. Ind. Applicat., 1. doi:10.1109/TIA.2021.3093841
Keywords: renewable energy, power system planning, investment demand, composite capacity-load ratio, least square generation adjunctive network
Citation: Li X, Liu C, Sheng K, Wen B, Xie H, Zhao W and Yang Q (2022) A Multi-Level Investment Demand Assessment Model for Renewable-Dominated Power System Planning. Front. Energy Res. 9:807590. doi: 10.3389/fenrg.2021.807590
Received: 02 November 2021; Accepted: 18 November 2021;
Published: 10 January 2022.
Edited by:
Liansong Xiong, Nanjing Institute of Technology (NJIT), ChinaReviewed by:
Bo Yang, Kunming University of Science and Technology, ChinaXian Zhang, Harbin Institute of Technology, China
Huaizhi Wang, Shenzhen University, China
Copyright © 2022 Li, Liu, Sheng, Wen, Xie, Zhao and Yang. This is an open-access article distributed under the terms of the Creative Commons Attribution License (CC BY). The use, distribution or reproduction in other forums is permitted, provided the original author(s) and the copyright owner(s) are credited and that the original publication in this journal is cited, in accordance with accepted academic practice. No use, distribution or reproduction is permitted which does not comply with these terms.
*Correspondence: Haodong Xie, MTc0MzQ2NTU5NkBxcS5jb20=