- 1School of Energy and Power Engineering, Xihua University, Chengdu, China
- 2Huaneng Mingtai Electric Power Co. Ltd., Mianyang, China
- 3International Center on Small Hydro Power, Hangzhou, China
To study the influence of the blade entropy production range on the efficiency of a tubular turbine under coassociated conditions, the renormalization group K–ε turbulence model was used to simulate the full flow passage of the tubular turbine based on the Navier–Stokes equation, and the blade interface was analyzed using the eddy analysis method and entropy production theory. The results reveal that there is a strong correlation between the size of the high-entropy production area and the level of association. If the level of association is high, the size of the high-entropy production is small, and the turbine efficiency is high. Furthermore, if the level of association is low, the size of the high-entropy production area is large, and the turbine efficiency is low. Under small opening and small flow conditions, the blade entropy generation is due to the sharp change in the velocity gradient caused by the vortex on the blade. Under large opening and large flow conditions, the blade entropy production is mainly due to the friction loss caused by the impact of high-speed water flow.
Introduction
Greenhouse gas emissions have led to global warming, and energy conservation and emission reductions have become a global consensus (Lu, 2021). Therefore, the Ninth Meeting of the Central Finance Committee proposed incorporating carbon peaking and carbon neutrality into the overall layout of ecological civilization construction and recommended the construction of a clean, low-carbon, safe, and efficient energy system (Hongchun, 2014). Hydropower energy has the advantages of being clean, low carbon, and highly efficient, and as the most widely applicable energy source, hydropower is a key area for green development (Jin-Ling et al.,2019).
The flow pattern inside a turbine consists of laminar, turbulent, and turning flows. Under the effect of turbulent flow, the fluid microclusters exhibit vortex motion, resulting in viscous dissipation, which leads to a reduction in unit efficiency. In order to investigate the relationship between spin flow and energy loss inside the turbine, various approaches have been utilized. Wentao (2014) used the large eddy simulation method and the calculation method of the evaporation/condensation cavitation model to conduct numerical simulations of the mixed-flow turbine and concluded that there was no strong swirl at the runner outlet under the rated opening, which could effectively improve the flow at the inlet of the tailpipe and reduce the pressure pulsation. Zhengwei et al. (2004) analyzed the flow field of the entire passage of the bulb tubular turbine and found that the active guide vane was the supplier of the inlet ring quantity of the runner and that the guide vane shape and runner association had a significant influence on the total loss of the turbine. Jie (2005) conducted numerical simulations of impact turbines and found that the diameter of the base circle and maximum outer diameter of the runner directly affected the energy conversion efficiency of the runner; furthermore, they found that the flow state of the water bucket on both sides was not completely consistent owing to the water film boundary disturbance. Tong et al. (2021) closed the Reynolds-averaged Navier–Stokes (RANS) equation using a k-w turbulence model and verified the performance simulation results by comparing the model results with experimental results. To explore the energy loss mechanism of the PAT under different flow conditions, the proposed energy dissipation method was used to calculate the energy loss of each part of the PAT, which not only accurately calculated the energy loss, but also could diagnose the location and mode of hydraulic loss occurrence. However, none of the above scholars analyzed the corresponding parts of the turbine from the perspective of entropy production.
When the fluid microclusters pass through the blade surface, because of the viscous force effect, boundary layer detachment occurs, resulting in fluid microclusters having rotational motion; furthermore, the center of the vortex and downstream fluid produce differential pressure resistance owing to pressure differences, which results in energy loss and an entropy increase (Ni et al.,2018). Entropy gain increases the disorder in a system, and entropy generation means that energy is lost from the system; therefore, energy loss can be studied using the entropy production theory. Many scholars have applied the entropy production theory to the study of the energy loss generated inside the hydraulic turbine and achieved many results, mostly for pump turbines and mixed-flow turbine energy. Deyou (2017) used the wall entropy yield equation to successfully solve the entropy yield loss of a wall, which had not been solved by previous scholars and verified the accuracy of the experimental data. Wang et al. (2021) studied a pump turbine with a full-flow three-dimensional (3D) numerical simulation of the turbine interior. They concluded that the entropy production of the guide vane and worm housing was small and that the runner and tail pipe were large; therefore, the tail pipe produced large pressure pulsations. Wei et al. (2021) applied the entropy production theory to the optimal design of two-dimensional leaf grilles and established a method for the automatic optimization of leaf grilles based on the second law of thermodynamics using the vortex viscosity model for the entropy production analysis of the leaf grille flow field. Ning and Zhenlin (2020) similarly used the second law of thermodynamics to analyze the energy loss in the hydraulic turbine flow field and concluded that the entropy production of the runner is related to the velocity distribution of the internal flow field and that the entropy production theory has obvious advantages in the evaluation of hydraulic losses. Ruzhi et al. (2013) used the entropy production theory to study the energy dissipation of Francis turbines and concluded that the entropy production theory can effectively infer the location and magnitude of energy dissipation. Ghorani et al. (2020) simulated a 3D incompressible steady-state flow within a pump turbine using the entropy production theory and the second law of thermodynamics by solving the RANS equation by solving for the pump turbine. The numerical results reveal that the turbulence term is the main factor influencing entropy generation within the pump turbine (Qifan, 2018). The cross-flow turbine is a horizontal unit that is suitable for low-head and high-flow conditions, in which the viscous force plays a significant role. However, most scholars have focused on pump turbines and Francis turbines, and few scholars have analyzed the entropy production of cross-flow turbines. To improve the output efficiency of the cross-flow turbine, the energy loss at its blades was analyzed using the entropy production theory.
The optimality of the coassociated conditions for the bulb cross-flow turbine unit is related to the efficiency and stability of the turbine unit (Zhenggui, 2014; Can et al., 2016) (Figure 1). Owing to the operation parameters, the hydraulic turbine’s guide vane and paddle openings vary. Furthermore, the upstream and downstream water levels and reservoir operation and scheduling affect the efficiency of the turbine. The coassociated conditions can ensure the most efficient and stable operation. At present, the blades of the cross-flow turbine are worth studying. Although the tail pipe and blades are the main sources of energy loss, research on the energy loss of the blades of the cross-flow turbine is limited. Therefore, this study considers the Chaijiaxia cross-flow turbine unit as the research object and conducts numerical simulations to obtain the magnitude of turbine efficiency under the coassociated conditions of different flow rates. The flow analysis was carried out at the runner blade interface of the hydraulic turbine, and the vortex dynamics analysis method was used to identify the internal flow state. Moreover, the entropy yield theory was applied to analyze the location of the energy loss and the size of the loss to determine the connection between the colinkage relationship and the size of the entropy yield. It is expected that the results herein will help to improve the overall operating efficiency of the cross-flow hydraulic turbine and increase its dispatching efficiency.
Calculation Model and Grid Division
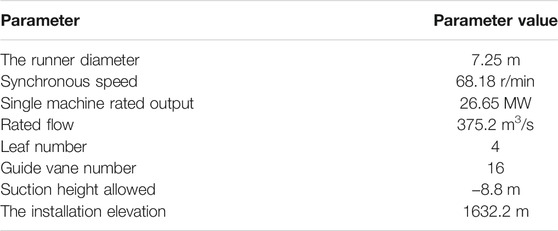
The Chaijiaxia tubular turbine unit was selected for this study, and its basic design parameters are listed in Table 1.
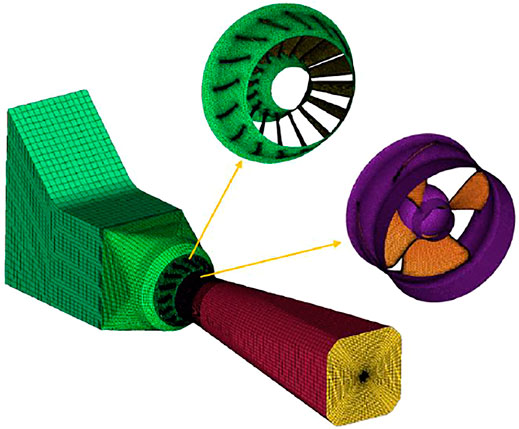
The mesh drawn by ANSYS-ICEM software has been shown to be highly accurate, and the calculation results are more precise; therefore, this study uses ANSYS-ICEM software to mesh the model (Zhang et al., 2019). To guarantee the accuracy of the calculation, a combination of structural and nonstructural meshes was used for the division. The inlet section and bulb body section were more regular; therefore, a structural mesh was used to ensure accuracy. The overall mesh of the fluid domain is illustrated in Figure 2.
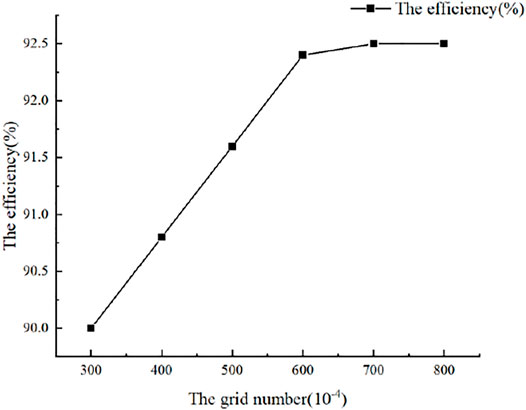
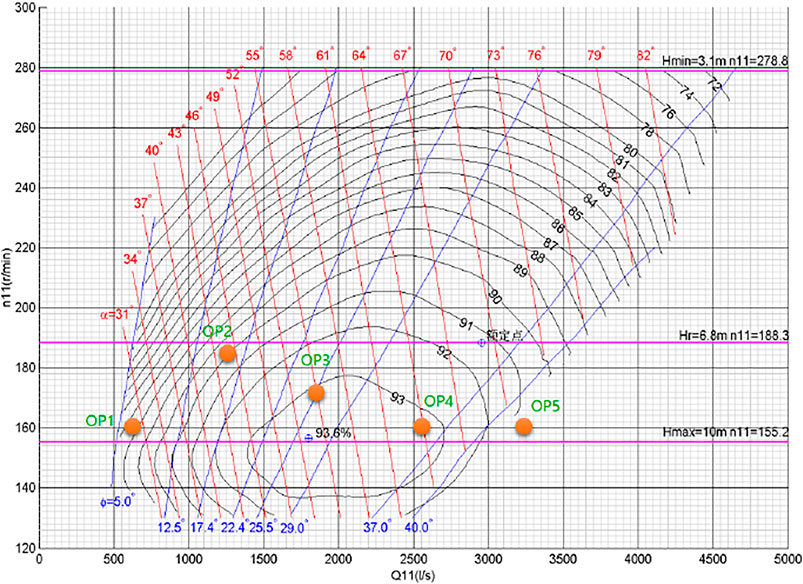
To reduce the influence of the number of grids on the calculation, grid independence verification was carried out for the design working conditions, as shown in Figure 3. After grid independence verification, the number of grids was 8,846,777, and the number of nodes was 1,973,260. The inlet boundary condition was set to mass flow, the outlet was set as the pressure outlet, the solid boundary surface was a nonslip wall surface, and the runner speed was set to 68.18 r/min. The rated flow rate Q was 375.2 m3/s. A water head of 8 m was selected; a fixed paddle opening was chosen for this head. To identify the optimal guide vane opening at a fixed paddle opening, which is the coassociated working condition at this opening, a numerical calculation was performed with a range of guide vane openings. Then, five propeller opening and guide vane opening conditions common to the operation of the Chaijiaxia Hydropower Station were selected on the runner integrated characteristic curve, as shown in Figure 4: 7°–29.2° (OP1), 16°–44.8° (OP2), 25°–54.8° (OP3), 31°–60.5° (OP4), and 41°–70.8° (OP5), which are the five coassociated conditions with high coassociation degrees. These conditions were used for efficiency calculations, and the flow patterns and entropy production distributions were studied (Figure 5).
Control Equations and the Turbulence Model
For the calculation model, the RNG k–ε model was chosen because it can give accurate near-wall parameters. In the calculation of the constant condition of the cross-flow turbine, the compressibility of the fluid has a large influence on the flow field and affects the calculation results; therefore, an incompressible fluid was used in the fluid domain. For a homogeneous incompressible fluid, the continuity equation and equation of motion are
where
To solve the control equations, a turbulence model needs to be developed. From the perspective of engineering applications, the Reynolds-averaged simulation is the most widely used. Two-sided equation models are the most frequently applied. These include the k–ε model, the improved RNG k–ε model, and the realizable k–ε model. The k-ε model is derived from the transport equation, which is suitable for fully turbulent flows and is widely used. The RNG k-ε model improves the accuracy and correctly gives the near-wall parameters, possessing a higher confidence level, whereas the realizable k-ε model adds new transport equations that can model the expansion angle of cylindrical and flat jets. In summary, the RNG k-ε model with high accuracy was selected considering the need for near-wall studies in this study.
Vortex Dynamics Theory
In viscous fluid mechanics, vortices are one of the main causes of fluid energy loss (Zhou, 2014). For fluid machinery, the additional stresses due to vortex motion lead to energy loss, which results in a decrease in the efficiency of the fluid machinery. The study of vortex motion can clarify the interaction between vortex generation and flow, and second, control means can be used to limit the development of vortices. The eddy analysis methodology applied in this study was as follows.
Levy et al. (1990) first proposed the regularized helicity (Hn) in 1990, which was used to locate the vortex kernel using the following formula:
Within the flow field, it is a scalar field with an interval of [−1, 1], which is meaningful when both the velocity V and the vorticity ω are not zero. The closer a region is to the vortex core, the more the direction of velocity V and vortex ω will tend to be parallel, and the more the value of Hn will tend to ±1. The positive and negative signs of Hn represent the direction of vortex rotation (Shengyang, 2020). Where the flow direction is positive, Hn is positive, and the direction of vortex rotation is counterclockwise; when Hn is negative, the direction of vortex rotation is clockwise. In this study, we used the regularized helicity method to analyze the vorticity of the runner blades of cross-flow hydraulic turbines (Shengyang, 2020).
Entropy Production Theory
In an actual fluid system, when the entropy increases, the fluid in the system moves in a more disordered direction. The mechanical energy of the fluid is converted into internal energy dissipation due to the Reynolds stress and viscous forces within the boundary layer as the fluid flows, resulting in an increase in entropy production. The entropy yield is defined as follows:
where
where
The wall area was used to calculate the entropy production using the wall area equation of Li (2017):
where
The total entropy yield is defined as
where
In this study, the entropy production theory was used to analyze the energy loss of the blade working surface and backside under five concurrent working conditions.
Test Verification
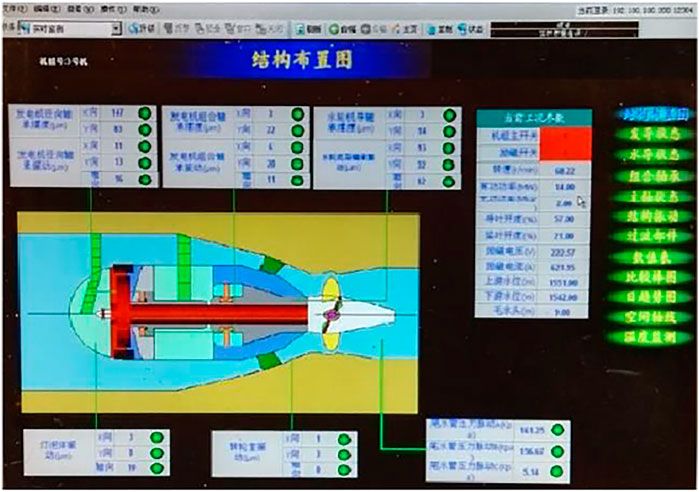
On the Chaijiaxia cross-flow turbine unit, the efficiency of the unit was tested on a real machine under different concurrent operating conditions at 8-m head. The test system collects the required physical quantities, such as the flow rate, head, and speed, by feeding the electrical signals from the sensors into a digital signal collector and processing the data.
The test parameters are defined as follows:
(1) Hydraulic turbine input power:
where Q is the hydraulic turbine flow rate (m3/s), and P is the total differential pressure at the measurement point at the inlet (kPa).
(2) Hydraulic turbine output power:
where F is the load sensor reading (KN), and
(3) Efficiency:
Because the spiral case differential pressure method is a simple and effective flow measurement method that works on the principle that the fluid passing through the spiral case produces a pressure difference, the water flow rate has an effect on the pressure difference, and the turbine flow rate at the same interface is proportional to the flow rate, the spiral case differential pressure method was chosen for flow rate measurement in the flow rate test (Biao, 2016). Table 2 lists the instruments and models used in the test.
Figure 6 shows a comparison of the calculated output and the real machine output force under the five coassociated working conditions. It can be seen that the calculated output and the actual machine output both increase as the opening degree is increased, and the calculated results fit the test curve well; the maximum relative error is approximately 10%, which proves that the calculated results are reliable.
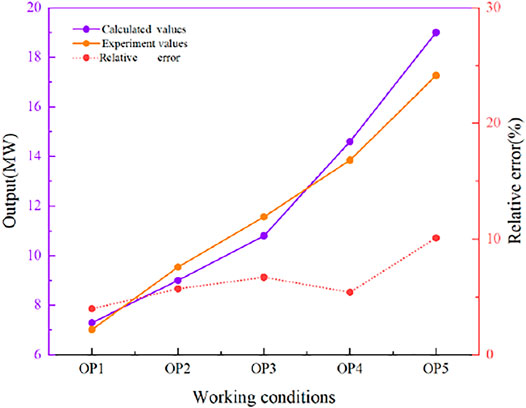
FIGURE 6. Comparison of the calculated output and actual machine output under five coassociated working conditions.
Figure 7 shows a comparison between the efficiency test results and the calculated results under five coassociated working conditions. As can be seen from the figure, the curves of the test simulation results have the same trend as the numerical simulation curves, and the efficiency calculated from the numerical simulation results is generally higher than that of the test calculation results, as there will be more hydraulic losses in the turbine runners under actual test conditions. It can be seen that the efficiency difference under the OP4 condition is the largest, but its value is only 1.2%, which indicates that the numerical simulation results are more reliable.
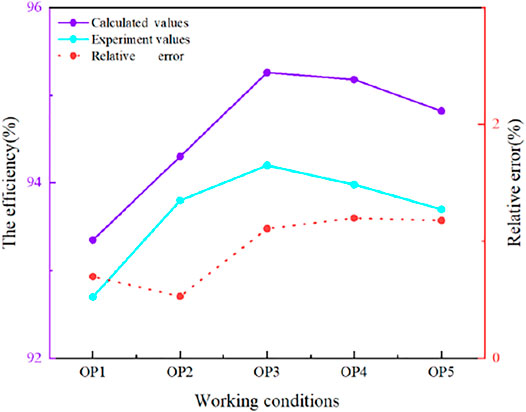
FIGURE 7. Comparison of efficiency test results and calculated results under five coassociated working conditions.
Analysis of the Results
Efficiency of the Calculation Results
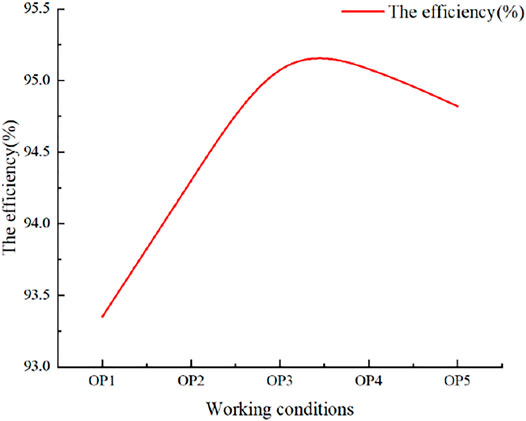
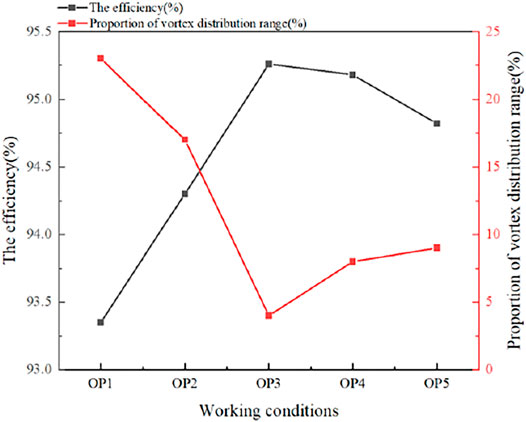
A numerical calculation of the coassociated efficiency curve at the 8-m head revealed that the optimal coassociated working conditions were 25°–54.8° (OP3) with the highest turbine efficiency of 95.26%, indicating the best hydraulic conditions were achieved under this condition. The overall curve first increases and then decreases, and the lowest efficiency (93.35%) is obtained under the 7°–29.2° (OP1) condition. OP1 and OP2 were the small-flow–coassociated conditions, and OP4 and OP5 were the large-flow–coassociated conditions.
Blade Vortex Dynamics Analysis
The regularized helicity method accurately captures the location of the vortex cores. Figure 8 shows the distribution of blade Hn under the five concurrent working conditions (the left side is the working surface, and the right side is the back side; (a), (b), (c), (d), and (e) are OP1, OP2, OP3, OP4, and OP5 working conditions, respectively). As shown in the figure, there is a counterclockwise vortex at the junction of both the hub and blade working surfaces. For OP1, the inlet edge of the front edge of the distribution of a small vortex, and backward development, so that the blade by the clockwise rotation of the large vortex dominated by the middle part of the blade back mainly by a clockwise vortex dominated, and near the water out of the edge of a counterclockwise vortex, the back of the inlet edge of the front edge of part of the fine broken vortex. Owing to the OP1 working condition, the guide blade opening and paddle opening are small; the impact angle is small, in the blade into the leading edge and out of the leading edge to form a fine, discrete vortex. For the OP2 working condition, because of the increase in the blade opening, blade working surface, and back of the fine vortex compared with the OP1 working condition to less, the back vortex core area range reduced; OP3 blade working surface only close to the hub has a counterclockwise rotation outside the vortex, and there is no discrete small vortex. There is a clockwise vortex on the back of the blade, and the location of the vortex kernel is not concentrated, compared with the first two working conditions. The guide blade and paddle association relationship is better, and the vortex distribution is more stable. For the OP4 working condition, the blade working surface of the inlet side and the outlet side of the vortex appeared broken, and the flow pattern gradually worsened. This is because, as the opening degree continues to increase, the flow rate increases, and the negative impulse angle of the paddle inlet increases. For OP5, unlike OP4, a fine discrete vortex continues to develop, the number of inlet side and outlet side in the working surface increases, near the junction of the wheel edge and inlet side with counterclockwise rotation of the vortex, the vortex nucleus at the back of the blade gradually reduces, and the absolute value also decreases.
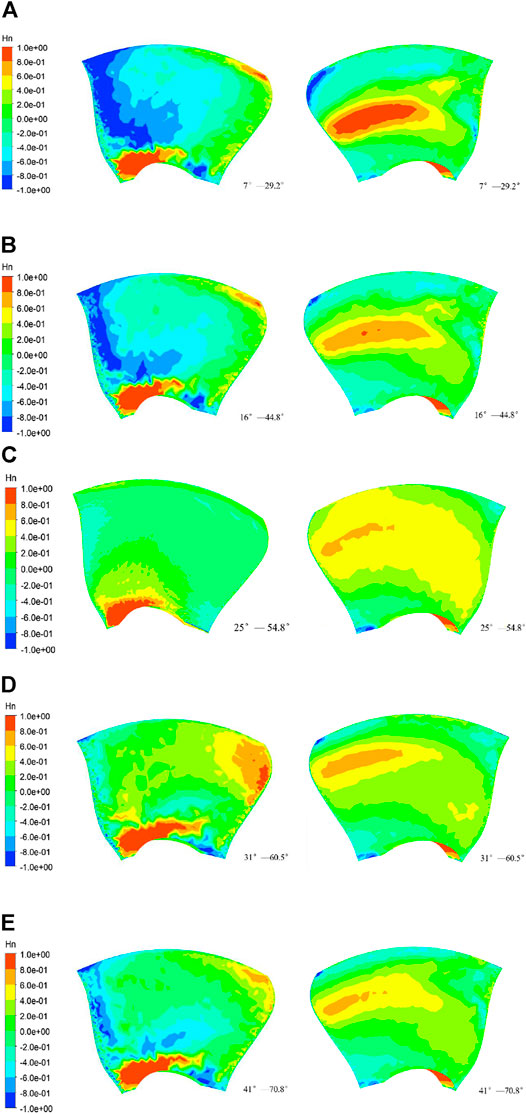
FIGURE 8. Hn distribution of the blade under the five coassociated working conditions. The left side is the working surface, and the right side is the back side. (A–E) are OP1, OP2, OP3, OP4, and OP5, respectively.
In summary, it can be seen that, for this cross-flow turbine, the guide vane and paddle opening have a certain degree of influence on the flow pattern at the blade interface. The OP3 condition has the lowest number of vortices of the five coassociated working conditions. Furthermore, as the opening increases, the overall flow pattern develops in a better direction, which is more obviously reflected by the back of the blade. From the regularized helicity, it can be concluded that the number of vortices on the blade decreases, and the range decreases as the blade opening is increased under the small-flow–coassociated working condition. As the opening degree continues to increase, the negative impulse angle of the blade inlet increases, and the number of vortices on the inlet and outlet sides of the blade working surface increases with the flow rate under the large flow rate condition.
Figure 9 shows the relationship between the vortex distribution range and efficiency. The ratio of the area occupied by the value of −1 and 1 in the Hn distribution diagram to the overall blade is the vortex distribution range ratio. It can be seen that the vortex distribution of the blade and the efficiency of the cross-flow turbine are negatively correlated; the larger the vortex distribution range ratio, the lower the efficiency (Binggang et al., 2009).
Entropy Production Distribution
Generally speaking, there are two main factors affecting the hydraulic losses in the runner section: local losses such as impact and vortex losses related to the runner inlet impulse angle, and friction losses related to the flow rate. Figure 10 shows the distribution of the entropy production of the blade under the five colocated working conditions (the left side is the working surface, and the right side is the back side; (a), (b), (c), (d), and (e) are OP1, OP2, OP3, OP4, and OP5 working conditions, respectively). It can be seen, in OP1 working conditions, as the opening degree is small, that the blade working surface into the leading edge and trailing edge has high-entropy production of the strip area, out of the leading edge gathered different size, different rotation direction of the vortex impact, fusion caused by flow velocity gradient changes. At this time, the vortex on the blade is the main cause of entropy production. For the OP2 working conditions, blade working surface compared with OP1 working conditions high-entropy production area relatively reduced, two working conditions blade back entropy production value of the larger area concentrated in the range near the hub, may be the blade back vortex blockage flow caused by. For the OP3 working condition, the overall entropy production range is significantly lower than those of the first two working conditions; moreover, the velocity gradient change is not large. For the OP4 and OP5 conditions, the working surface of the blade is out of the leading edge and has a small range of entropy-producing areas, back near the hub area, into the leading edge, and the rim intersection interface has part of the entropy production. A comparison with Figure 11 shows that the blade back Hn distribution can be seen; at this time, the vortex distribution is almost the same, but the OP5 back entropy production is larger than that for OP4 due to an increase in opening. As a result, the flow rate increases, and the impact velocity accelerates at the back of the blade, increasing the friction loss; on the other hand, because of increased flow velocity, the tail pipe at the return flow interference hub increases the shear rate of the water at the hub, increasing the entropy production range.
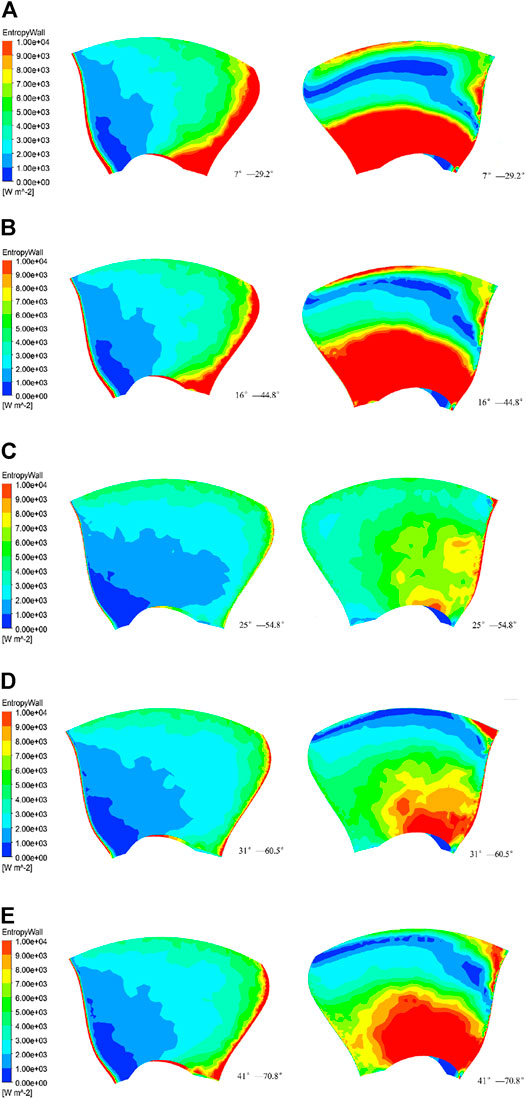
FIGURE 10. Entropy wall distribution of the blade under the five coassociated working conditions. The left side is the working surface, and the right side is the back side. (A,B,C,D,E) are the OP1, OP2, OP3, OP4, and OP5 working conditions, respectively. The entropy production values over
Overall, the entropy yield distribution map of the leaf has a corresponding correlation with the Hn distribution. The OP3 condition is the best overall flow condition with the smallest range of high-entropy production areas. Before the coassociated opening reaches the OP3 condition, the guide vane opening is small, the flow rate is low, and the entropy production is mainly due to the hydraulic loss caused by the velocity gradient change, which is caused by the vortex. This phenomenon decreases as the opening of the guide lobe increases and the range of entropy production decreases, indicating that the vortex judged by the regularized helicity dominates the flow in this region, increasing energy losses. After the coassociated opening reaches the OP3 working condition, the flow rate increases; the blade on the main entropy production from the water in the blade friction loss. The larger the opening, the greater the negative impulse angle, and the greater the hydraulic loss. At the same time, the water flow and tailpipe backflow collide on the blade interface to produce a larger velocity gradient that will increase the back of the blade entropy production range.
It can be seen in Figure 12 that the coassociated optimal condition (OP3) is the condition with the smallest high-entropy production area, and the coassociated worst condition (OP1) condition is the condition with the largest high-entropy production area. From the graph, it can be seen that the turbine efficiency tends to decrease as the entropy-producing area increases, indicating that the high-entropy–producing range has an inverse relationship with the turbine efficiency; furthermore, the larger the high-entropy–producing area, the lower the turbine efficiency. Therefore, compared with the calculation of turbine efficiency, the change in the entropy production area is more intuitive.
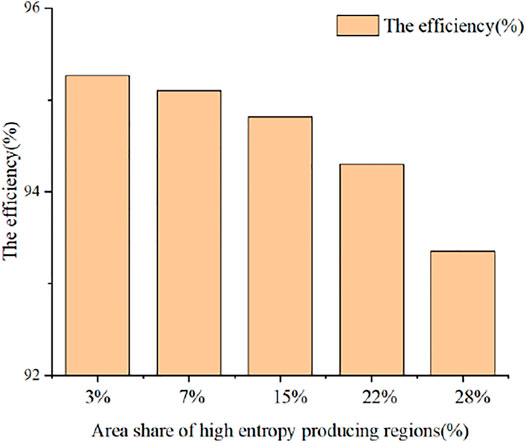
FIGURE 12. Relationship between the area share of the high-entropy production area and the efficiency of the hydraulic turbine.
Discussion
Many scholars have studied the internal flow and energy loss of hydraulic turbines. Wentao (2014) found that the mutual interference between the movable guide vane and runner blade of a mixed-flow hydraulic turbine would affect the turbulent kinetic energy change and performed many analyses on the flow stability. In terms of energy loss, however, less research has been conducted, and the relationship between stability and energy loss has not been integrated. Zhengwei et al. (2004) conducted an energy loss analysis on the coassociated degree of a cross-flow turbine but did not investigate the effect of flow state on energy loss. Ghorani et al. (2020) used the entropy production theory for pump turbines to demonstrate that turbulence is the main source of entropy production. However, compared with cross-flow turbines, the main source of entropy production requires more theoretical analysis and experimental verification and requires a complete system combining fluid stability and energy loss analysis. Therefore, to study the efficiency of a cross-flow turbine unit, the authors found, through an investigation and a literature review, that the efficiency of the cross-flow turbine has a great degree of correlation with the coassociation degree of the blades and guide vanes. A theoretical analysis of the entropy production of the runner blade interface of a cross-flow turbine under coassociation conditions was carried out and effectively combined with its internal flow pattern and energy loss.
It was found that there is a strong correlation between the size of the high-entropy production area and the level of association. If the level of association is high, the size of the high-entropy production area is small, and the turbine efficiency is high. If the level of association is low, the size of the high-entropy production area is large, and the turbine efficiency is low. Under small opening and small flow conditions, the blade entropy generation is due to the sharp change in the velocity gradient caused by the vortex on the blade. Under large opening and large flow conditions, the blade entropy production is due to the friction loss caused by the impact of high-speed water flow. This study provides practical guidance for the scheduling and adjustment of Chaijiaxia, as well as other cross-flow turbine power plants.
However, owing to the limitations of the experimental period, this study has the following shortcomings.
1) The numerical simulation uses clear water conditions, which are affected by many factors in the actual test process, such as the presence of a certain amount of sediment in the water. As a result, the simulation results are bound to deviate from the actual results.
2) In the actual dispatch of the power station, the upstream and downstream heads are bound to change in different seasons. However, this study only utilizes an 8-m head; thus, the results are not generalizable to other heads
3) The working conditions can be investigated more extensively; however, owing to the limitation of the test, not all working conditions can be investigated, and only some trends can be analyzed.
In future research, more research efforts will be focused on in-depth experimental studies and providing more reference information for power plant scheduling and adjustment.
Conclusion
This study used numerical simulations to analyze the vortex and entropy production at the blade interface of a cross-flow turbine under five different coassociated operating conditions at an 8-m head. The following conclusions can be drawn:
1) From the regularized helicity distribution diagram, it can be seen that the blade vortex distribution is correlated with the efficiency diagram. The highest efficiency at optimal and fewer vortices on the blades is obtained at the optimal coassociated conditions. Under small-flow–coassociated conditions, the vortex on the blade is mainly concentrated on the working surface into the leading edge, trailing edge, and the middle of the back of the blade. With an increase in the opening of the guide vane and an increase in the paddle, the impact angle increases, and the blade vortex volume gradually decreases. Under these conditions, the vortex distribution on the blade is similar to that under low-flow–coassociated conditions than that under high-flow–coassociated conditions; however, the range is reduced, and the vortex increases with the increase in the negative impulse angle of the water flow.
2) From the blade entropy yield distribution, it can be seen that the entropy yield distribution and vortex distribution have a positive correlation; the greater the number of vortices, the greater the range of the entropy yield. As few vortices form under the optimal coassociated working conditions, the entropy production value is the smallest. Small open-angle coassociated condition, high-entropy production range concentrated in the blade working surface out of the leading edge and the back of the blade root, which is basically the same as the vortex distribution range. It means that, for this working condition, the vortex on the blade is the main cause of entropy production; under the large opening and large-flow–coassociated working condition, compared with the small opening coassociated working condition, the entropy production at the back root of the blade is not related to the vortex distribution, which means that the friction loss generated by a high flow rate is the main cause of entropy production in this working condition.
3) Overall, the size of the high-entropy production area of this cross-flow turbine is strongly correlated with the degree of coassociation. The higher the degree of coassociation between the guide vane and paddle, the lower the range of the high-entropy production area; furthermore, the lower the degree of coassociation, the larger the range of the high-entropy production area. Therefore, to ensure a small high-entropy production area and high-turbine-efficiency working conditions, it is necessary to operate the unit under an optimal coassociated relationship between the guide vane and paddle, which is the coassociated working condition with an opening degree of 25°–54.8° under an 8-m head.
Data Availability Statement
The original contributions presented in the study are included in the article/Supplementary Material, further inquiries can be directed to the corresponding author.
Author Contributions
CC wrote and improved the paper, ZL provided guidance and advice on writing the paper, SP guided the analysis of the paper, BM helped with the test apparatus, and SY provided guidance on the test.
Funding
The work was supported by the National Natural Science Foundation of China (Grant No. 52079118), the Science and Technology Department of Sichuan Province (Grant No. 2020YFH0135), Open Fund of Sichuan Provincial Key Laboratory of Fluid Machinery and Engineering (Grant No. szjj 2019-023), and Project of Sichuan Science and Technology Department (Grant No. 202573), Grant No.202573 changed to Grant No.2020YFSY0029.
Conflict of Interest
Author SP was employed by the company Huaneng Mingtai Electric Power Co. Ltd.
The remaining authors declare that the research was conducted in the absence of any commercial or financial relationships that could be construed as a potential conflict of interest.
Publisher’s Note
All claims expressed in this article are solely those of the authors and do not necessarily represent those of their affiliated organizations, or those of the publisher, the editors and the reviewers. Any product that may be evaluated in this article, or claim that may be made by its manufacturer, is not guaranteed or endorsed by the publisher.
References
Biao, M. (2016). Study on Stability of Bulb Tubular Turbine Generator Set [D]. Lanzhou: Lanzhou University of Technology.
Binggang, T., Xieyuan, Y., and Keqin, Z. (2009). Vortex Motion Theory. Hefei: University of Science and Technology of China Press.
Can, K., Li-ting, L. I., and Guo-hui, L. (2016). Influence of Guide Vane Opening on Performance and Flow Characteristics of Tubular Turbine. J. Drain. Irrig. Mach. Eng. 34, 406–413.
Deyou, L. (2017). Study on Flow Mechanism and Transient Characteristics of Pump Turbine in Hump Region [D]. Harbin: Harbin Institute of Technology.
Ning, H., and Zhenlin, L. (2020). Application of Entropy Production Theory in Flow Field Analysis of Hydraulic Turbines[J]. Pet. Sci. 5 (2), 269–276.
Ghorani, M. M., Sotoude, H. M. H., Maleki, A., and Riasi, A. (2020). A Numerical study on Mechanisms of Energy dissipation in a Pump as Turbine (PAT) Using Entropy Generation Theory[J]. Renew. Energy 162.
Hongchun, Z. (2014). Thinking on the Principle of China’s Carbon Peak Action Plan. China Bus 2021 (09), 36–37. CNKI:SUN:JSGZ.0.2021-09-009.
Jie, L. (2005). Numerical Simulation and Performance Research on Internal Flow of Impact Turbine [D]. Huazhong: Huazhong University of Science and Technology.
Jin-Ling, L., Li-ke, W., Wei-li, L., Ya-Ping, Z., and Qing-Feng, J. (2019). J. Hydraul. Eng. 50, 233–241. doi:10.13243/j.cnki.slxb.20180762
Levy, Y., Degani, D., and Seginer, A. (1990). Graphical Visualization of Vortical Flows by Means of Helicity. AIAA J. 28, 1347–1352. doi:10.2514/3.25224
Lu, C. (2021). To Open a Major Reform of China’s Energy System and a new era of Clean and Renewable Energy Innovation and Development—A Profound Understanding of the Historical Significance of Carbon Peak and Carbon Neutrality [J/OL]. People’s BBS Acad. frontier 2021 (14), 1–14. doi:10.16619/j.cnki.rmltxsqy.2021.14.004
Mahdi, G. M., Hadi, S. H. M., Ali, M., and Alireza, R. (2020). A Numerical Study on Mechanisms of Energy Dissipation in a Pump as Turbine (PAT) Using Entropy Generation Theory. Renew. Energ. 2020, 162.
Ni, D., Yang, M., Gao, B., Zhang, N., and Li, Z. (2018). Experimental and Numerical Investigation on the Pressure Pulsation and Instantaneous Flow Structure in a Nuclear Reactor Coolant Pump. Nucl. Eng. Des. 337, 261–270. doi:10.1016/j.nucengdes.2018.07.014
Ning, H., and Zhenlin, l. (2020). Application of Entropy Production Theory to Analysis of Flow Field in Hydraulic Turbine. Pet. Sci. Bull. 5, 269–276. CNKI:SUN:SYKE.0.2020-02-010.
Qifan, C. (2018). Analysis of Flow Field Entropy Production Rate in S-Zone of Mixed-Flow Pump Turbine [D]. Beijing: Tsinghua University.
Ruzhi, G., Hongjie, W., LiXia, C., DeYou, L. I., HaoChun, Z., and Xianzhu, W. (2013). Application of Entropy Production Theory to Hydro-Turbine Hydraulic Analysis. Sci. China (Technol. Sci. 56, 1636–1643.
Shengyang, P. (2020). Numerical Simulation of Solid–Liquid Two-phase Flow in Tubular Turbine Based on Vortex (Xihua University) Analysis [D]. Chengdu: Xihua University.
Tong, L., Xiaojun, L., Zuchao, Z., Jing, X., Yi, L., and Hui, Y. (2021). Application of Enstrophy Dissipation to Analyze Energy Loss in a Centrifugal Pump as Turbine. Renew. Energ. 2021, 163.
Wang, W., Lin, Z., Wang, J., and Lin, Z. (2021). Optimization Design on Cascade Profile Based on Entropy Generation Theory[J]. J. Huazhong Univ. Sci. Technol. Med. Sci. (Natural Science Edition) 49 (9), 52–58.
Wei, W., Zhi-ang, L., Jun, W., and Zhi-liang, L. (2021). Cascade Type Based on the Theory of Entropy Production Line Optimization Design [J/OL]. J. Huazhong Univ. Sci. Technol. (Nat. Sci. Ed. 49 (9), 1–8. doi:10.13245/j.hust.210910
Wentao, S. (2014). Study on Internal Flow Stability of Large Scale Francis Turbine (Harbin Institute of Technology) Model [D]. Harbin: Harbin Institute of Technology.
Zhang, H., Fu, J. F., Wang, N., Yang, R., and Huang, P. T. (2019). Selection of Meshing Method for Cross-Pipe Flow Field Based on ICEM CFD. China Water Transport(Second Half) 10, 230–231. CNKI:SUN:ZSUX.0.2019-10-105.
Zhenggui, L. (2014). Research on CoassociatedRelation and Performance of Bulb Tubular Turbine [D]. Lanzhou: Lanzhou University of Technology.
Zhengwei, W., Lingjiu, Z., Yanguang, C., Ming, D., and Guodong, C. (2004). Hydraulic Loss Analysis of Bulb Tubular Turbine. Large Electr. Mach. Technol. 05, 40–43. CNKI:SUN:DJDJ.0.2004-05-011.
Keywords: tubular turbine, efficiency, vortex analysis, entropy production theory, coassociated working conditions
Citation: Li Z, Cheng C, Yan S, Peng S and Ma B (2021) Theoretical Analysis of Entropy Generation at the Blade Interface of a Tubular Turbine Under Cooperative Conditions. Front. Energy Res. 9:788416. doi: 10.3389/fenrg.2021.788416
Received: 02 October 2021; Accepted: 29 October 2021;
Published: 07 December 2021.
Edited by:
Cong Qi, China University of Mining and Technology, ChinaReviewed by:
Xiuli Mao, Northwest A and F University, ChinaJun Wang, Huazhong University of Science and Technology, China
Copyright © 2021 Li, Cheng, Yan, Peng and Ma. This is an open-access article distributed under the terms of the Creative Commons Attribution License (CC BY). The use, distribution or reproduction in other forums is permitted, provided the original author(s) and the copyright owner(s) are credited and that the original publication in this journal is cited, in accordance with accepted academic practice. No use, distribution or reproduction is permitted which does not comply with these terms.
*Correspondence: Zhenggui Li, bHpoZ3VpQG1haWwueGh1LmVkdS5jbg==
 Zhenggui Li1*
 Chuang Cheng