 Deyu Yang1
 Ke Luo
- 1Inner Mongolia Power Research Institute, Huhhot, China
- 2School of Information and Electrical Engineering, Shandong Jianzhu University, Jinan, China
- 3Faculty of Electric Power Engineering, Kunming University of Science and Technology, Kunming, China
To solve the problems of environmental pollution and energy consumption, the development of renewable energy sources becomes the top priority of current energy transformation. Therefore, distributed power generation has received extensive attention from engineers and researchers. However, the output of distributed generation (DG) is generally random and intermittent, which will cause various degrees of impact on the safe and stable operation of power system when connected to different locations, different capacities, and different types of power grids. Thus, the impact of sizing, type, and location needs to be carefully considered when choosing the optimal DG connection scheme to ensure the overall operation safety, stability, reliability, and efficiency of power grid. This work proposes a distinctive objective function that comprehensively considers power loss, voltage profile, pollution emissions, and DG costs, which is then solved by the multiobjective particle swarm optimization (MOPSO). Finally, the effectiveness and feasibility of the proposed algorithm are verified based on the IEEE 33-bus and 69-bus distribution network.
Introduction
With the rapid development of the world’s electric power industry, the total amount of social electricity consumption has risen sharply over the last decade (Yang et al., 2016; Yang et al., 2017; Zhang et al., 2021). Under the traditional grid framework, the power sector mainly builds large centralized power sources such as nuclear power stations, large hydropower stations, and coal-fired power stations and then expands into a large-scale power system (Yang et al., 2019a; Yang et al., 2019b; Yan, 2020). However, its disadvantages are also increasingly prominent (Li et al., 2020; Xi et al., 2020), in particular, highly centralized power supply is gradually difficult to meet the flexibility requirements of power grid operation, and the failure of important power supply nodes seriously affects the overall reliability of power grid’s power supply. Moreover, long-distance transmission is also under serious power loss and security problems (Mehleri et al., 2012; Wang et al., 2014; Yang et al., 2018).
To overcome the negative impact of the aforementioned problems, the concept of distributed generation (DG) was put forward in the 1980s (GopiyaNaik et al., 2013; Yang et al., 2015). DG has an extremely important influence on the planning and operation of the distribution network (Sara et al., 2020; Yang et al., 2020; Ali and Mohammad, 2021). Also, proper access of DG in distribution network can effectively enhance the power quality, reduce the active power loss, improve the voltage distribution, and boost the overall economy and flexibility of the power network operation (Abdurrahman et al., 2020; Bikash et al., 2020; Suresh and Edward, 2020). As the end of power network, the stability and efficiency of distribution network directly affect its overall efficiency (Surajit and Parimal, 2018; Bikash et al., 2019). Therefore, the location and sizing of distributed power generation have become an important research content of power grid planning.
The problem of location and sizing of DG is to optimize its installation point and sizing to maximize the benefits under the constraints of satisfying the given investment and system operation (Kumar et al., 2019; Nagaballi and Kale, 2020). With the increasing requirements for power system reliable operation, the problem of DG location and constant sizing has developed from a single-objective problem that only considers the minimum network loss to a multiobjective optimization problem that comprehensively considers voltage quality, current quality, and environmental factors. Quadratic programming method, genetic algorithm, and other methods have been applied to solve such multiobjective location and constant volume problem. These methods all need to set weights to transform the multiobjective problem into a single-objective problem for proper solutions (Murty and Kumar, 2015); however, these weights are often difficult to determine in actual operation.
Besides, the solution of a large number of planning models is relatively complicated, while the selection of the algorithm directly affects the choice of planning schemes (Aman et al., 2014; Nezhadpashaki et al., 2020; Zeng and Shu, 2020). At present, the solving algorithms mainly include mathematical optimization and metaheuristic algorithm (Doagou-Mojarrad et al., 2013; Satish et al., 2013; Sultana et al., 2016). However, mathematical optimization algorithm owns relatively low computational efficiency and is only suitable for small-scale distribution networks. Thus, metaheuristic algorithm has received much attention and application in recent years (Aman et al., 2012; Pabu and Singh, 2016; Iqbal et al., 2018). Literature (Chandrasekhar and Sydulu, 2012) adopts genetic algorithm (GA) to optimize the new load nodes for expansion plan of distribution network, and then simulated annealing algorithm is utilized to optimize the generated single plan, which considerably reduces the load size of DG connected to the distribution network and the influence of power flow of the distribution network. Literature (Aman et al., 2013) proposes an improved particle swarm optimization algorithm based on hybrid simulated annealing method to optimize the location and sizing of distributed power sources. However, the convergence speed of the aforementioned algorithms is relatively slow, and the result is prone to local optimal solutions.
Therefore, an objective function comprehensively considering power losses, voltage profile, pollution emission, and DG cost is proposed in this work, and MOPSO is utilized to solve it. Finally, the proposed method is validated via an IEEE 33-bus and 69-bus distribution network to verify its effectiveness. Then, the Pareto front result is given.
The remaining of this paper is organized as follows: Mathematical Optimization Model of DG Planning develops the objective function. In Multiobjective Particle Swarm Optimization Algorithm, multiobjective particle swarm optimization (MOPSO) is described. Comprehensive case studies are undertaken in Case Studies. At last, Conclusion summarizes the main contributions of the paper.
Mathematical Optimization Model of DG Planning
Load and DG Power Output Timing Model
Wind Turbine Output Timing Model
The output power of wind turbine mainly depends on wind speed, which can be expressed by the following piecewise function (Velasquez et al., 2016):
where
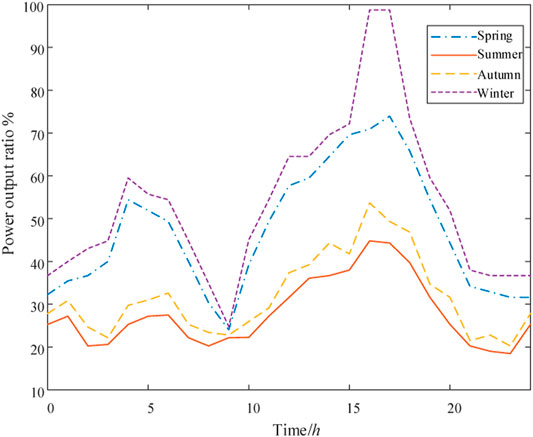
FIGURE 1. Annual output curve of wind turbine.
Photovoltaic System Output Timing Model
The output power
where
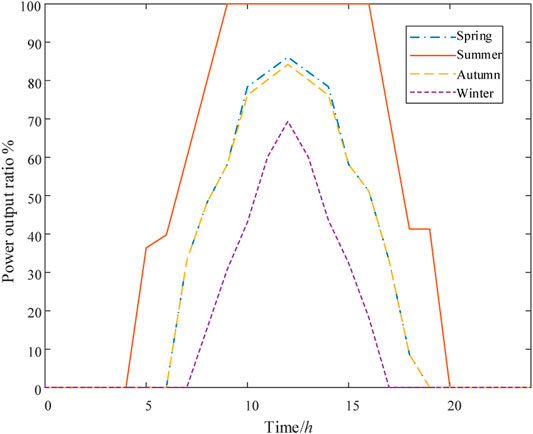
FIGURE 2. Annual output curve of PV system.
Load Timing Model
The load size shows certain regularity due to people’s living habits. Figure 3 shows the typical load curve of residents in all seasons (Velasquez et al., 2016).
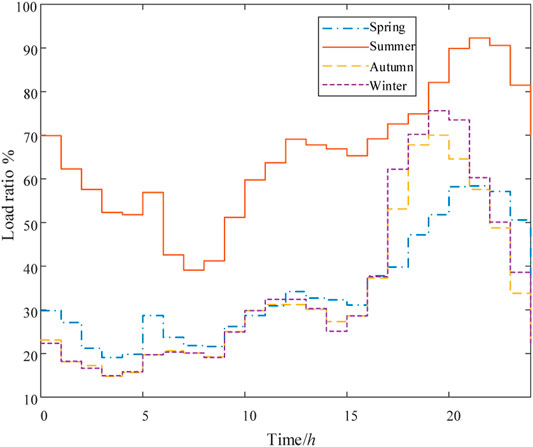
FIGURE 3. Annual load curve of residents.
Objective Function
Power Losses
The power losses index takes into account the total active power loss of 96 h in four typical days, which is established as follows (Velasquez et al., 2016):
where
Voltage Profile
Reasonable access of DG to the distribution network can effectively improve the voltage profile. Therefore, this work adopts the total voltage deviation of 96 h in four typical days to measure the optimization effect, and the voltage profile index is established as follows (Ali and Mohammad, 2021):
where
Pollution Emission
In order to reduce the emission of polluting gases, this work adopts the pollution emission considering carbon dioxide, sulfur dioxide, and nitrogen compounds as follows (Ali and Mohammad, 2021):
where
Economic Indicators
The economic cost of DG planning determination includes the investment cost and average operation and maintenance cost of all units, which can be expressed by the following formula (Ali and Mohammad, 2021):
where
Constraints
In order to ensure the safe and stable operation of the system, the following constraints are designed (Bikash et al., 2020; Ali and Mohammad, 2021):
Power Balance Constraints
where
Power Constraints of Transmission Lines
where
Voltage Constraint
The voltage of the jth node after DG configuration can be calculated by (Abdurrahman et al., 2020)
where
Distributed Power Supply Sizing Constraints
where
MOPSO Algorithm
Particle Swarm Optimization Algorithm
Particle swarm optimization is a heuristic algorithm that mimics bird foraging, which can conduct intelligent guidance optimization through cooperation and competition among particles (Doagou-Mojarrad et al., 2013).
Suppose a population has m particles, each particle has an N-dimensional variable, and the position and flight speed of the ith particle in the kth iteration are
where
where K is the maximum number of iterations;
MOPSO Algorithm
In order to constantly update a set of Pareto optimal solutions obtained by MOPSO during iterations, this work designs the historical Pareto optimal solution set and the global Pareto optimal solution set during iterations with the help of archiving technology. Global Pareto optimal solution set holds all Pareto optimal solutions generated during the current iteration.
Assuming that a population contains m particles and each particle has Nobj objective function value, the global Pareto optimal solution set generated by each iteration is found by the following (Doagou-Mojarrad et al., 2013):
1) Let i = 1.
2) Compare particle
3) If j exists so that particle
4) If i > m, turn to 5). Otherwise, let i = i + 1 and turn to (2).
5) Remove all marked solutions, and the remaining solutions constitute the global Pareto optimal solution set of this iteration.
Historical Pareto optimal solution set: this solution set is used to hold the Pareto optimal solution throughout the iteration. Update the historical Pareto optimal solution set in each iteration: the global Pareto optimal solution set generated in this iteration is merged into the historical Pareto optimal solution set, and noninferior solutions are found according to the Pareto dominant condition, while all inferior solutions are deleted.
With the increase of iteration numbers, the number of solutions in the historical Pareto optimal solution set increases rapidly. To improve the running speed of the algorithm, the number of solutions in the historical Pareto optimal solution set is limited to the present value NC. When the number of solutions in the historical Pareto optimal solution set exceeds NC, the sparsity ranking method based on crowding distance is adopted to reduce the number of solutions in the solution set to NC (Nagaballi and Kale, 2020).
In MOPSO, the individual optimal solution and the global optimal solution of the population need to be redefined. In this work, the individual optimal solution and global optimal solution of MOPSO algorithm are defined as follows.
Individual optimal solution: if the particle generated during this iteration dominates the individual optimal solution of the previous iteration, the individual optimal solution of the particle is updated to the particle generated during this iteration. Otherwise, the individual optimal solution of the particle remains.
Global optimal solution: the global optimal solution is selected from the historical Pareto optimal solution set. According to the sparsity of each particle in the solution set, the particle with the largest sparsity was selected as the global optimal solution of the current iteration.
So far, the filtering mechanism of Pareto is described as follows (Doagou-Mojarrad et al., 2013):
where
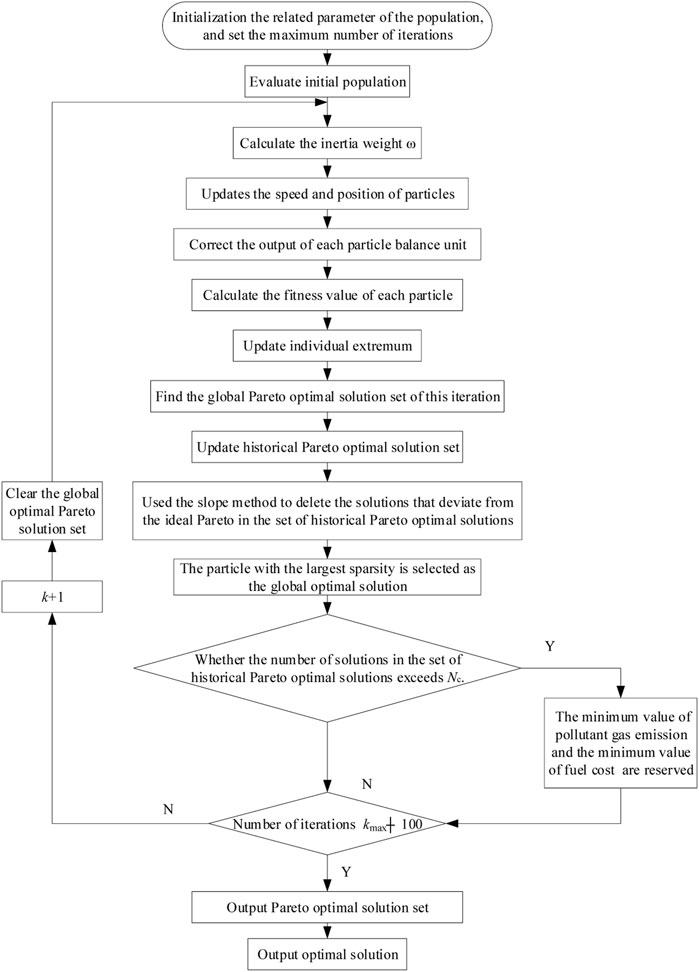
FIGURE 4. Computational flowchart of the proposed method.
Case Studies
As shown in Figure 5 and Figure 6, DG planning research on an IEEE 33-bus and 69-bus distribution network is carried out to verify the effectiveness of the proposed method, including PV system (two nodes installed), wind turbine (two nodes installed), fuel cell (one node installed), and microturbine (one node installed). It is worth noting that fuel cell and micro-gas turbine can carry out power output stably. When PV system and wind turbine are used together, the defect of fluctuating output power can be well compensated. In addition, in four typical days, the total active power loss of the network is 4061.87 kW, while the total voltage deviation is 66.1991 p.u. and the proposed method was coded in MATLAB 2017b.
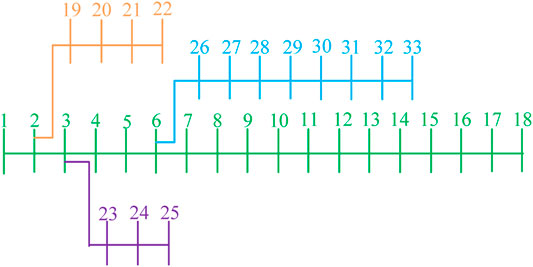
FIGURE 5. IEEE 33-bus distribution network.
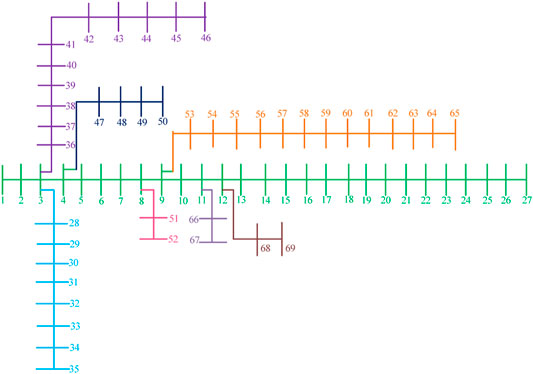
FIGURE 6. IEEE 69-bus distribution network.
IEEE 33-Bus Distribution Network
The simulation results obtained by MOPSO and the voltage distribution of the optimized IEEE 33-bus distribution network are shown in Table 1 and Figure 7, respectively. It can be seen from Table 1 that, after MOPSO optimization, the power losses and voltage profile of the distribution network are significantly improved after different types of DG are configured because DG is always installed near the load. It is worth noting that the voltage distribution of the whole system is improved, although the addition of the fan makes the voltage of some nodes deteriorate. In addition, the Pareto front obtained by MOPSO properly distributes the weight of the objective function under the improved ideal point decision method, which effectively carries out the tradeoff optimization of each objective function and avoids the influence brought by the subjective setting of the weight coefficient. Besides, the multiobjective decision-making method described in literature (Zeng and Shu, 2020) is adopted in this work, while the weight coefficients of each objective function obtained are 0.31, 0.15, 0.28, and 0.26, respectively.
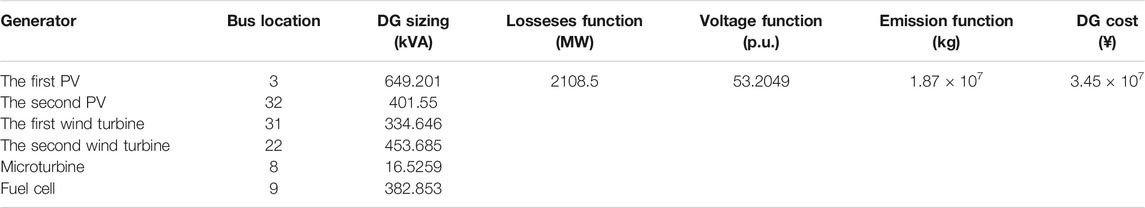
TABLE 1. Optimization results of MOPSO.
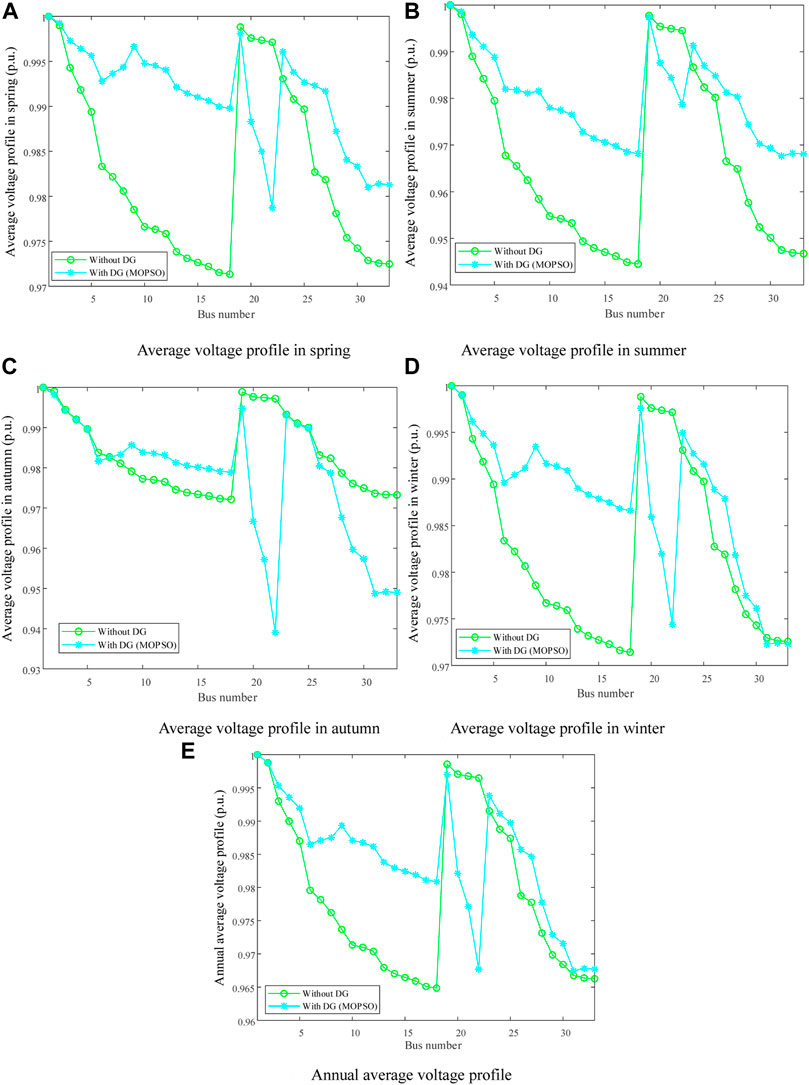
FIGURE 7. Voltage profile improvement of the IEEE 33-bus distribution network.
In addition, since four different indexes are optimized in this work, Pareto solution set graph cannot be drawn in the Cartesian coordinate system, so the method of mapping the Pareto solution set from the Cartesian coordinate system to a parallel lattice coordinate system is adopted. The Pareto solution set obtained after MOPSO runs 10 times is given in Figure 8. Different optimization objectives are mapped to different columns of the parallel lattice coordinate system. In addition, the ordinate represents the fitness function value after mapping, and the dotted line connects the parallel lattice coordinate components of the same objective vector in different columns. In general, MOPSO can show strong searching ability, as well as obtaining widely distributed and uniform Pareto fronts.

FIGURE 8. Pareto front results.
IEEE 69-Bus Distribution Network
The optimization results obtained by each algorithm and the voltage distribution of IEEE 69 node distribution network optimized by each algorithm are shown in Table 2 and Figure 9, respectively. It can be seen that, after MOPSO optimization, power loss and voltage distribution of distribution network with different types of DG are significantly improved. Pareto front results are given in Figure 10. The weight coefficients of each objective function obtained are 0.28, 0.11, 0.28, and 0.33, respectively.
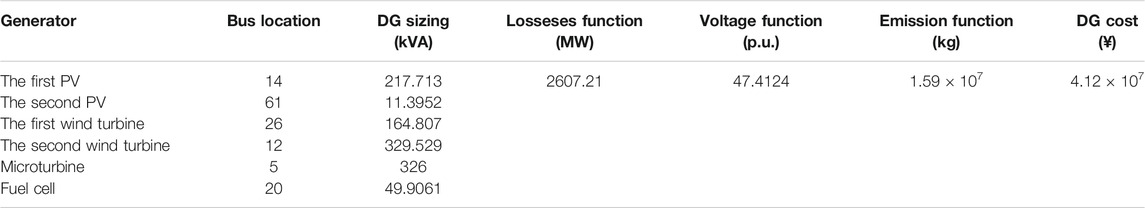
TABLE 2. Optimization results of MOPSO.
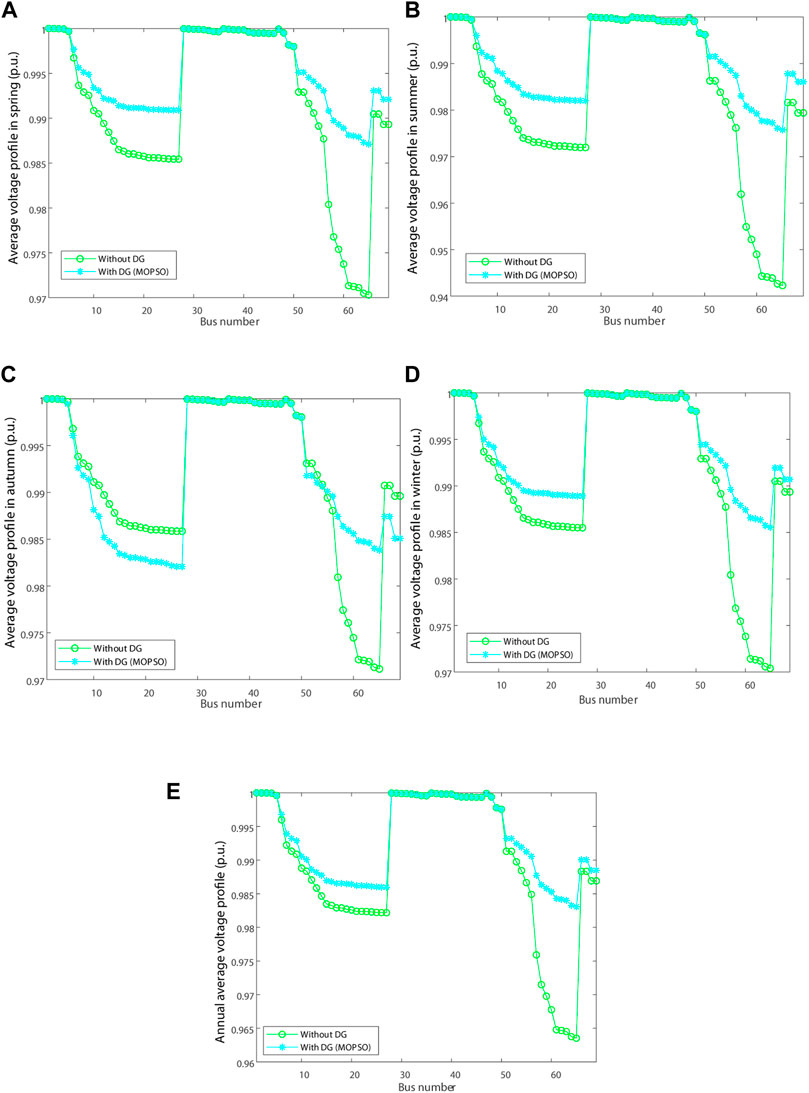
FIGURE 9. Voltage profile improvement of the IEEE 69-bus distribution network.
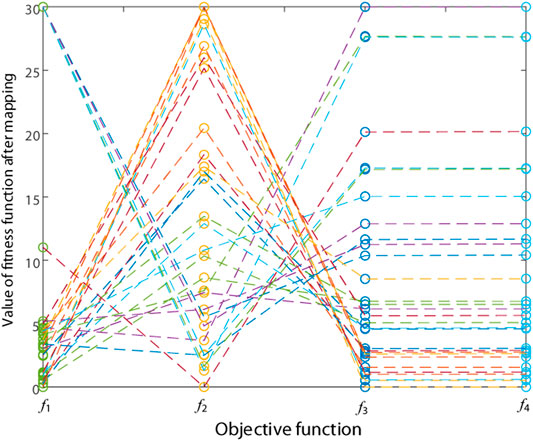
FIGURE 10. Pareto front results.
Conclusion
In this work, MOPSO is used to optimize the location and sizing of DG, which contributions are outlined as follows:
1. The objective function with four indexes of distribution network losseses reduction index, voltage profile index, environmental emission reduction index, and economic indicators is established to comprehensively optimize the distribution network.
2. Based on an IEEE 33-bus and 69-bus distribution network, it is effectively verified that MOPSO has strong global searching efficiency and high convergence speed. Also, it can effectively avoid falling into local optimum under complex objective function.
3. Four types of DG, PV station, wind turbine, fuel cell, and microturbine are installed, and the connection of microturbine and fuel cell can stabilize the instability of PV station and wind turbine. The experimental results show that the power losseses of the distribution network optimized by MOPSO decrease by 51.91%, and the voltage profile is also significantly improved.
In future studies, more advanced solution algorithms and multiobjective decision-making method will be devised to solve this problem.
Data Availability Statement
The original contributions presented in the study are included in the article/Supplementary Material; further inquiries can be directed to the corresponding author.
Author Contributions
DY: conceptualization and writing—reviewing and editing. JJ: writing—original draft preparation and investigation. WW: writing—reviewing and editing. WC: supervision. DA: supervision. KL: conceptualization and resources. BY: writing—reviewing and editing, software.
Funding
This work is supported by the Scientific Research Projects of Inner Mongolia Power (Group) Co., Ltd. (Internal Electric Technology (2021) No. 3).
Conflict of Interest
The authors declare that the research was conducted in the absence of any commercial or financial relationships that could be construed as a potential conflict of interest.
Publisher’s Note
All claims expressed in this article are solely those of the authors and do not necessarily represent those of their affiliated organizations or those of the publisher, the editors, and the reviewers. Any product that may be evaluated in this article or claim that may be made by its manufacturer is not guaranteed or endorsed by the publisher.
References
Abdurrahman, S., Sun, Y. X., and Wang, Z. H. (2020). Multi-objective for Optimal Placement and Sizing DG Units in Reducing Losses of Power and Enhancing Voltage Profile Using BPSO-SLFA. Energ. Rep. 6, 1581–1589. doi:10.1016/j.egyr.2020.06.013
Ali, A., and Mohammad, K. S. (2021). Optimal DG Placement in Power Markets from DG Owners’ Perspective Considering the Impact of Transmission Costs. Electric Power Syst. Res. 196, 107218. doi:10.1016/j.epsr.2021.107218
Aman, M. M., Jasmon, G. B., Bakar, A. H. A., and Mokhlis, H. (2013). A New Approach for Optimum DG Placement and Sizing Based on Voltage Stability Maximization and Minimization of Power Losses. Energ. Convers. Management 70, 202–210. doi:10.1016/j.enconman.2013.02.015
Aman, M. M., Jasmon, G. B., Bakar, A. H. A., and Mokhlis, H. (2014). A New Approach for Optimum Simultaneous Multi-DG Distributed Generation Units Placement and Sizing Based on Maximization of System Loadability Using HPSO (Hybrid Particle Swarm Optimization) Algorithm. Energy 66, 202–215. doi:10.1016/j.energy.2013.12.037
Aman, M. M., Jasmon, G. B., Mokhlis, H., and Bakar, A. H. A. (2012). Optimal Placement and Sizing of a DG Based on a New Power Stability index and Line Losses. Int. J. Electr. Power Energ. Syst. 43 (1), 1296–1304. doi:10.1016/j.ijepes.2012.05.053
Bikash, D., Mukherjee, V., and Debapriya, D. (2019). Optimum DG Placement for Known Power Injection from Utility/substation by a Novel Zero Bus Load Flow Approach. Energy 175 (15), 228–249. doi:10.1016/j.energy.2019.03.034
Bikash, D., Mukherjee, V., and Debapriya, D. (2020). Optimum Placement of Biomass DG Considering Hourly Load Demand. Energ. Clim. Change 1, 100004. doi:10.1016/j.egyr.2020.06.013
Chandrasekhar, Y., and Sydulu, M. S. M. (2012). Multiobjective Optimization for Optimal Placement and Size of DG Using Shuffled Frog Leaping Algorithm. Energ. Proced. 14, 990–995. doi:10.1016/j.egypro.2011.12.1044
Doagou-Mojarrad, H., Gharehpetian, G. B., Rastegar, H., and Olamaei, J. (2013). Optimal Placement and Sizing of DG (Distributed Generation) Units in Distribution Networks by Novel Hybrid Evolutionary Algorithm. Energy 54, 129–138. doi:10.1016/j.energy.2013.01.043
Gopiya Naik, S., Khatod, D. K., and Sharma, M. P. (2013). Optimal Allocation of Combined DG and Capacitor for Real Power Loss Minimization in Distribution Networks. Int. J. Electr. Power Energ. Syst. 53, 967–973. doi:10.1016/j.ijepes.2013.06.008
Iqbal, F., Khan, M. T., and Siddiqui, A. S. (2018). Optimal Placement of DG and DSTATCOM for Loss Reduction and Voltage Profile Improvement. Alexandria Eng. J. 57 (2), 755–765. doi:10.1016/j.aej.2017.03.002
Kumar, S., Mandal, K. K., and Chakraborty, N. (2019). Optimal DG Placement by Multi-Objective Opposition Based Chaotic Differential Evolution for Techno-Economic Analysis. Appl. Soft Comput. 78, 70–83. doi:10.1016/j.asoc.2019.02.013
Li, R. S., Wong, P., Wang, K., Li, B., and Yuan, F. (2020). Power Quality Enhancement and Engineering Application with High Permeability Distributed Photovoltaic Access to Low-Voltage Distribution Networks in Australia. Prot. Control. Mod. Power Syst. 5 (3), 1–7. doi:10.1186/s41601-020-00163-x
Mehleri, E. D., Sarimveis, H., Markatos, N. C., and Papageorgiou, L. G. (2012). A Mathematical Programming Approach for Optimal Design of Distributed Energy Systems at the Neighbourhood Level. Energy 44 (1), 96–104. doi:10.1016/j.energy.2012.02.009
Murty, V. V. S. N., and Kumar, A. (2015). Optimal Placement of DG in Radial Distribution Systems Based on New Voltage Stability index under Load Growth. Int. J. Electr. Power Energ. Syst. 69, 246–256. doi:10.1016/j.ijepes.2014.12.080
Nagaballi, S., and Kale, V. S. (2020). Pareto Optimality and Game Theory Approach for Optimal Deployment of DG in Radial Distribution System to Improve Techno-Economic Benefits. Appl. Soft Comput. 92, 106234. doi:10.1016/j.asoc.2020.106234
Nezhadpashaki, M. A., Karbalaei, F., and Abbasi, S. (2020). Optimal Placement and Sizing of Distributed Generation with Small Signal Stability Constraint. Sustainable Energ. Grids Networks 23, 100380. doi:10.1016/j.segan.2020.100380
Pabu, P. V., and Singh, S. P. (2016). Optimal Placement of DG in Distribution Network for Power Losses Minimization Using NLP & PLS Technique. Energ. Proced. 90, 441–454. doi:10.1016/j.egypro.2016.11.211
Sara, M., Ahmed, E., Tamou, N., and Badr, B. I. (2020). NA Direct Power Control of a DFIG Based-WECS during Symmetrical Voltage Dips. Prot. Control. Mod. Power Syst. 5 (1), 36–47. doi:10.1186/s41601-019-0148-y
Satish, K., Vishal, K., and Barjeev, T. (2013). Optimal Placement of Different Type of DG Sources in Distribution Networks. Int. J. Electr. Power Energ. Syst. 53, 752–760. doi:10.1016/j.ijepes.2013.05.040
Sultana, U., Khairuddin, A. B., Aman, M. M., Mokhtar, A. S., and Zareen, N. (2016). A Review of Optimum DG Placement Based on Minimization of Power Losses and Voltage Stability Enhancement of Distribution System. Renew. Sustainable Energ. Rev. 63, 363–378. doi:10.1016/j.rser.2016.05.056
Surajit, S., and Parimal, A. (2018). Maximization of System Benefits with the Optimal Placement of DG and DSTATCOM Considering Load Variations. Proced. Computer Sci. 143, 694–701. doi:10.1016/j.procs.2018.10.446
Suresh, M. C. V., and Edward, J. B. (2020). A Hybrid Algorithm Based Optimal Placement of DG Units for Loss Reduction in the Distribution System. Appl. Soft Comput. 91, 106191. doi:10.1016/j.asoc.2020.106191
Velasquez, M. A., Quijano, N., and Cadena, A. I. (2016). Optimal Placement of Switches on DG Enhanced Feeders with Short Circuit Constraints. Electric Power Syst. Res. 141, 221–232. doi:10.1016/j.epsr.2016.08.001
Wang, Z., Chen, B., Wang, J., Kim, J., and Begovic, M. M. (2014). Robust Optimization Based Optimal DG Placement in Microgrids. IEEE Trans. Smart Grid 5 (5), 2173–2182. doi:10.1109/tsg.2014.2321748
Xi, L., Wu, J., Xu, Y., and Sun, H. (2020). Automatic Generation Control Based on Multiple Neural Networks with Actor-Critic Strategy. IEEE Trans. Neural Netw. Learn. Syst. PP (6), 2483–2493. doi:10.1109/TNNLS.2020.3006080
Yan, X. (2020). A Review of Cyber Security Risks of Power Systems: from Static to Dynamic False Data Attacks. Prot. Control. Mod. Power Syst. 5 (3), 8–19. doi:10.1186/s41601-020-00164-w
Yang, B., Jiang, L., Wang, L., Yao, W., and Wu, Q. H. (2016). Nonlinear Maximum Power point Tracking Control and Modal Analysis of DFIG Based Wind Turbine. Int. J. Electr. Power Energ. Syst. 74, 429–436. doi:10.1016/j.ijepes.2015.07.036
Yang, B., Jiang, L., Yao, W., and Wu, Q. H. (2015). Perturbation Estimation Based Coordinated Adaptive Passive Control for Multimachine Power Systems. Control. Eng. Pract. 44, 172–192. doi:10.1016/j.conengprac.2015.07.012
Yang, B., Wang, J., Zhang, X., Yu, T., Yao, W., Shu, H., et al. (2020). Comprehensive Overview of Meta-Heuristic Algorithm Applications on PV Cell Parameter Identification. Energ. Convers. Management 208, 112595. doi:10.1016/j.enconman.2020.112595
Yang, B., Yu, T., Shu, H., Zhang, Y., Chen, J., Sang, Y., et al. (2018). Passivity-based Sliding-Mode Control Design for Optimal Power Extraction of a PMSG Based Variable Speed Wind Turbine. Renew. Energ. 119, 577–589. doi:10.1016/j.renene.2017.12.047
Yang, B., Yu, T., Zhang, X., Li, H., Shu, H., Sang, Y., et al. (2019). Dynamic Leader Based Collective Intelligence for Maximum Power point Tracking of PV Systems Affected by Partial Shading Condition. Energ. Convers. Management 179, 286–303. doi:10.1016/j.enconman.2018.10.074
Yang, B., Zhang, X., Yu, T., Shu, H., and Fang, Z. (2017). Grouped Grey Wolf Optimizer for Maximum Power point Tracking of Doubly-Fed Induction Generator Based Wind Turbine. Energ. Convers. Management 133, 427–443. doi:10.1016/j.enconman.2016.10.062
Yang, B., Zhong, L., Zhang, X., Shu, H., Yu, T., Li, H., et al. (2019). Novel Bio-Inspired Memetic Salp Swarm Algorithm and Application to MPPT for PV Systems Considering Partial Shading Condition. J. Clean. Prod. 215, 1203–1222. doi:10.1016/j.jclepro.2019.01.150
Zeng, F., and Shu, H. (2020). Memetic Salp Swarm Algorithm-Based Frequency Regulation for Power System with Renewable Energy Integration. Math. Probl. Eng. 2020, 1–11. doi:10.1155/2020/6661793
Keywords: distribution network, distributed generation, optimal sizing and placement, multiobjective particle swarm optimization, metaheuistic optimization
Citation: Yang D, Jia J, Wu W, Cai W, An D, Luo K and Yang B (2021) Optimal Placement and Sizing of Distributed Generators Based on Multiobjective Particle Swarm Optimization. Front. Energy Res. 9:770342. doi: 10.3389/fenrg.2021.770342
Received: 03 September 2021; Accepted: 20 September 2021;
Published: 30 November 2021.
Edited by:
Bin Zhou, Hunan University, ChinaReviewed by:
Yang Li, Northeast Electric Power University, ChinaXiaoshun Zhang, Shantou University, China
Copyright © 2021 Yang, Jia, Wu, Cai, An, Luo and Yang. This is an open-access article distributed under the terms of the Creative Commons Attribution License (CC BY). The use, distribution or reproduction in other forums is permitted, provided the original author(s) and the copyright owner(s) are credited and that the original publication in this journal is cited, in accordance with accepted academic practice. No use, distribution or reproduction is permitted which does not comply with these terms.
*Correspondence: Ke Luo, S2UuTHVvOTZAb3V0bG9vay5jb20=