 Yingxuan Zheng
 Zhen Wang
 Ping Ju
- College of Electrical Engineering, Zhejiang University, Hangzhou, China
To manage a large scale of distributed energy resources (DERs) dispersed geographically and reduce the impact of DER uncertainties, this paper proposes a distributed two-stage economic dispatch for virtual power plant (VPP) to track a specified VPP schedule curve. In the look-ahead stage, a distributed economic dispatch strategy is proposed to optimally allocate the scheduled power among DERs. In the real-time stage, a distributed VPP schedule curve tracking problem is modeled to balance the fluctuation of wind farms and/or PV stations. The two-stage distributed optimization problems are solved by an improved exact diffusion algorithm which is proved to be robust to local communication failure. Case studies validate the performance of the algorithm proposed.
Introduction
In recent years, the penetration rate of renewable energy especially for wind and solar power is rapidly increasing. However, the power fluctuation of wind and solar power pose great challenges for the operation and control of the evolving power system, such as frequency control and peak-load regulation (Bouffard and Galiana 2008). In reality, there are large number of DERs including wind farms and PV parks, micro turbine generator, storage, different types of flexible demand resources like EV, thermal pump load, air-conditioner, etc. (DING Yi 2016), dispersed geographically to provide flexible power supply. To manage these DERs, the virtual power plant (VPP) is introduced as an aggregator to manage and dispatch these DERs to achieve an resource sharing and overall benefit target, which has attracted great attention in power industry (Koraki and Strunz 2018).
Usually, VPP manages DERs in two modes: centralized and distributed. In centralized way, DERs in VPP are managed and dispatched by a central system operator (CSO). In this way, the most challenging issue for the CSO is how to manage uncertainties from various DERs. There have been massive efforts devoted to this issue. For example, in (Baringo, Baringo, and Arroyo 2019), a combination of scenario-based stochastic programming and adaptive robust optimization is developed for VPP to participate in the day-ahead energy and reserve electricity market, where the wind power uncertainty is represented by confidence bounds. In (Vahedipour-Dahraie et al., 2021) a two-stage risk-averse stochastic framework is proposed for optimal schedule of energy and reserve services for VPP, in which a Monte Carlo method is developed considering the probability distribution of the market prices, renewable energy power, flexible loads as well as the reserve requirement. In addition to the uncertainty issue, due to the user privacy, some DER information cannot be shared with CSO and thus how to model flexible loads with incomplete information and conduct decision-making is another issue in this centralized framework. To overcome this problem, in (Zhou et al., 2021) each DER is represented by an automatic response model based on Markov decision process and an event-driven stimulus-feedback control scheme is proposed to guide DERs with limited information via self-approaching optimization. However, since DERs are dispersed geographically, so in the centralized mode there always exist some risk of communication failure and transfer delay considering large scale of DER communication network.
On the other hand, in a distributed VPP each DER has limited information exchange with neighboring DERs and is less dependent on communication compared with the centralized VPP, and thus the VPP communication burden can be decreased. In distributed VPP, a basic issue is how to realize each DER’s distributed economic dispatch (DED) operation. In existing works, there are mainly three strategies to solve the DED problem (Yuan et al., 2019a): 1) the consensus strategy, 2) the diffusion strategy and 3) the alternating direction method of multipliers (ADMM). In these DED strategies, each DER exists an independent iteration process to approach its own optimal solution. The main differences are as follows: In the consensus strategy, in each iteration every DER will exchange information with neighboring DERs and then its incremental cost is updated, and finally all DERs will reach consensus with a common the incremental cost (Nedic and Ozdaglar 2009). In comparison, in the diffusion strategy, the incremental cost is first updated and then followed by the information exchange, i.e., the difference is mainly on the procedure order, which has proved to be more stable and effective (Tu and Sayed 2012). Furthermore, an improved diffusion algorithm called the exact diffusion algorithm (the standard EDA) is proposed in (Yuan et al., 2019a) which can accelerate the convergence speed and can approach to the exact optimal solution. A common point for the former two methods is that each DER will finally approach to the equal increment principle (EIP) consensus in mechanism. On the other hand, the algorithm mechanism of ADMM is different from the former two, in which the DER optimization problem is decomposed into several subproblems including some primal and dual problems, which are solved in sequence and coordinated to find a global solution (Boyd 2010). (Xia et al., 2019) presented a distributed hierarchical framework based on ADMM to manage multiple DERs in an economic way.
The main contribution of this paper is summarized as follows:
1) A distributed two-stage economic dispatch is proposed to track the generation schedule curve. During the economic dispatch, DERs make determinations independently only with the limited information from their neighboring DERs, which can protect user privacy. The proposed two-stage distributed economic dispatch can well adapt to the future power system dispatch framework considering the rolling ultra-short-term forecasting of renewable generation.
2) Local communication failure is carefully considered and the treatment proposed enables each agent to react to the communication failure independently and the algorithm can still converge to the optimal point without interrupting the optimization process. Compared with the existing works that consider the communication failure treatment in system-level, the treatment proposed is more practical in distributed optimization.
3) An improved EDA is developed to solve the distributed problem, which can accelerate the convergence speed with the penalty term and reduce the communication burden compared with the standard EDA. The penalty term only involves the information from neighboring DERs which doesn’t need extra effort to achieve global information and can increase convergence efficiency.
The remaining part of the paper is organized as follows: The Dispatch Framework of Virtual Power Plant introduces the framework of VPP’s dispatch framework and its topology; in The Two-Stage Distributed Economic Dispatch for VPP a distributed two-stage economic dispatch optimization model for VPP is formulated and an improved EDA is developed; Case Study includes the case study to validate the effectiveness of the algorithm proposed; Conclusion concludes the paper.
The Dispatch Framework of Virtual Power Plant
VPP is a network of decentralized, medium-scale DERs such as wind farms, PV stations, micro turbine and flexible loads (residential, commercial and industrial) and storage systems, etc. The objective of introducing VPP is to relieve the load requirement/capacity of the individual units during periods of power generation shortage. In short, VPP can aggregate DERs dispersed in various areas as a whole virtual generator unit dispatched by the power system.
VPP is responsible for the generation scheduling and benefit allocation among each DER. To reduce the impact of DER uncertainty, the following two-stage VPP dispatch is considered: 1) In the look-ahead dispatch, the initial VPP schedule curve will be determined by the VPP aggregator firstly and then be submitted to CSO. After executing the system-level economic dispatch, CSO will issue the corrected VPP schedule curve (considering transmission congestion, VPP capacity limits, etc.) to VPP. Finally, VPP will allocate the scheduled VPP power among all dispatchable DERs based on the forecasting wind and solar power; 2) In the real-time stage, VPP can further adjust each dispatchable DER power if there is any update of wind and solar power information from the ultra-short-term forecasting (i.e., the real-time forecasting) so that the look-ahead VPP schedule curve can be well tracked.
For the purpose of managing a large scale of DERs dispersed geographically and dealing with the uncertainty of DERs, in this study the DER power schedule will be determined by a distributed two-stage economic dispatch in a multi-agent communication framework.
Multi-Agent Communication Framework
The distributed optimization of DERs in VPP in this study is implemented in a multi-agent communication framework, as illustrated in Figure 1. Each DER is assigned to an agent who is responsible for communication with the other agent, controlling the DER power, and detecting the measurement changes (e.g., power deviation, changes in temperature). In this study, only five kinds of DER/agents are considered, but the proposed method can be easily extended to other DERs if any: wind power agent (WPA), photovoltaic agent (PVA), micro turbine agent (MTA), storage agent (SA), flexible load agent (FLA). What’s more, among the agents mentioned above, one agent with reliable communicate connection with CSO is specified as the connection agent who takes extra responsibility for external communication and internal information publishing.
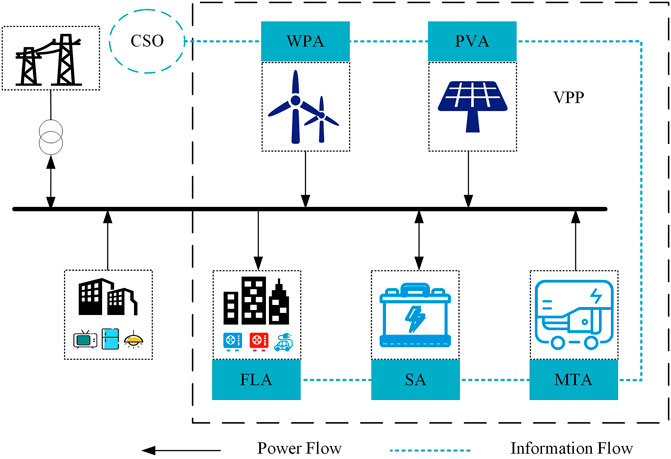
FIGURE 1. VPP system schematic diagram.
For simplicity, in this paper the agent index system is identical to the DER index system, i.e., each DER has the same index as its corresponding DER agent as described below. The communication network of the agents can be described using an undirected graph
where
In the communication framework above, the agents have the following characteristics (McArthur et al., 2007):
1) n agents in above definition means there are n DERs in VPP, vice versa.
2) Each dispatchable DER is a controlled unit and assigned to an agent that is responsible for communication and control. The agents of non-dispatchable DERs (wind farms or PV stations) only have the duty of communication.
3) Each agent has the functions of bidirectional communication, self-determination and sensing the environment. All the agents in VPP can coordinate and control DER through mutual communication to achieve the optimization goal of the whole system.
DER Economy Model
For the three typical dispatchable DERs in VPP mentioned above, the classic quadratic function is adopted to define the DER operation costs:
In above economy models, the variable subscripts “MT,” “S,” and “FL” denote the micro turbine, storage and flexible loads, respectively; C(
The Two-Stage Dispatch Framework
To accommodate renewable power integration and reduce the impact of prediction error, a multiple time-scale rolling dispatch framework is adopted (Li et al., 2015), which includes the following two stage process: 1) the look-ahead dispatch, which will execute VPP dispatch in a receding horizon every 1 h in the upcoming 4 h, with a time resolution of 15 min and 2) the real-time dispatch, which will perform in a receding horizon every 5 min in the upcoming 1 h, with a time resolution of 5 min.
The Two-Stage Distributed Economic Dispatch for VPP
According to the VPP framework discussed in The Dispatch Framework of Virtual Power Plant, a look-ahead and real-time two-stage distributed economic dispatch is developed in this section.
The Look-Ahead Economic Dispatch Model
In the look-ahead dispatch, VPP is responsible for allocating the 4 h VPP power schedule with a time resolution of 15 min issued by CSO to each DER based on the look-ahead forecasting wind and solar power.
The Look-Ahead CED Model
The wind and solar power are non-dispatchable DERs whose cost are regarded as constant, so only the overall VPP cost minimization of micro turbine, storage and flexible loads is considered:
where n is the number of DER;
The constraints in the look-ahead stage include:
(1) Flexible load power limits:
The minimum and maximum power limits of all flexible loads are considered constant values in this paper. It should be noted that the limits in Eq. 3b can be adjusted with the real environment parameters in different periods, such as temperature, air pressure, etc. (Lu 2012)
2) Storage power and SOC limits:
3) Micro turbine power limits:
4) Power flow limits:
where
where
where
(5) Power balance:
where
The optimization model (3a)–(3f) is called a typical centralized economic dispatch (CED) for VPP. To derive the DED model, the dual counterpart of (3a)–(3f) is further organized as:
where
The Look-Ahead DED Model
To transform the centralized model into the distributed model (Mateos-Nunez and Cortes 2017), the Lagrangian multiplier
where
For a communication-connected system, Eq. 5b means that all multipliers are equal, which makes (5a) holds. In Eq. 5a, since
The Real-Time Economic Dispatch Model
In the real-time stage, VPP will adjust DER power through rolling optimization if there is any update of wind and solar power information from the ultra-short-term/real-time forecasting to track the look-ahead VPP schedule curve in a receding horizon every 5 min in the upcoming 1 h.
The Real-Time CED Model
In the real-time stage, suppose at each timer interval t, the look-ahead VPP schedule curve can be completely tracked, the following minimum cost objective function is considered (3a)–(3f):
where
The Expected Regulation Correction
In reality, the expected regulation
where
The Real-Time DED Model
Like the look-ahead DED model, the real-time DED model is constructed as follows:
It is noted that Eq. 9 doesn’t mean the expected regulation of each DER is
The two-stage DED problems Eqs 6, 9 are convex optimization problems with equality constraint, which can be solved by the method explained below.
Solution Methodology Based on the Improved Exact Diffusion Algorithm
To solve the distributed optimization problems above, an improved EDA is developed.
The Standard Exact Diffusion Algorithm
In the distributed convex optimization problems Eqs 6, 9, the three Lagrangian multipliers
where for the ith DER at iteration k,
1) In Eq. 10a, usually the gradient at optimal point
2) In Eq. 10c, information exchange between the neighboring agents occurs. Each agent will exchange its
The Improved Exact Diffusion Algorithm
Convex Penalty Term
To increase the cost for the equality constraints violation of
where
The designed penalty term only involves the information from neighboring DERs which doesn’t need extra effort to achieve global information during the iterations and can increase convergence efficiency, while the ADMM need the information of the whole VPP (Xia et al., 2019).
Information Exchange Relief and Stop Criteria
Each agent will exchange the following information with its neighbors: 1)
To reduce the information exchange burden of communication during the distribution optimization process, the following conditional communication rule in Eq. 14 will be applied when there is minor incremental cost difference between consecutive iterations:
Thus, the conditional communication rule becomes:
If Eq. 13 is satisfied, then
When the conditional communication rule is satisfied with a pre-specified accuracy level
Local Communication Failure Treatment
In distributed communication network, the information transfer distance is short, and the impact of delay and bit errors is limited compared with communication failures. So, the treatment of local communication failures is studied in this paper.
When there is local communication failure happened (the dotted line in Figure 2) and provided that the communication network keeps connected, the proposed algorithm still works according to the following treatment Eqs 1–3:
1) If agent i and agent j cannot receive the next updated information from each other within the maximum data-transfer waiting time, they will set the agent status Failure.
2) Then in the next iteration, the number of the neighboring agents for the involved agent i and agent j (i.e., the shadowed agents in Figure 2) will be less one in Eq. 14 and then Eq. 1 will be recalculated to update
3) When the communication recovers, agent i and agent j can receive information from each other, and the agent status will be set to Normal, and update
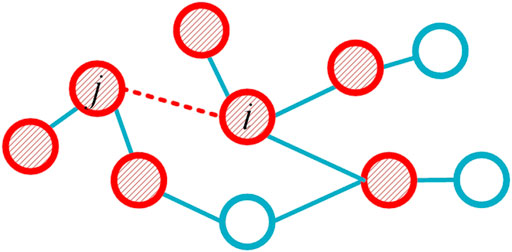
FIGURE 2. Local communication failure.
It is worth mentioning that the proposed algorithm also has some error tolerance for communication delay, when the data-transfer time exceeds the maximum waiting time, then the algorithm iteration will turn to above local communication failure treatment Eqs 1–3. In addition, the proposed improved EDA is robust to occasional bit errors. The false data due to bit errors can be regarded as another new initial data and the algorithm can still reach convergence as long as the remaining data is correct during the iterations, since one advantage of EDA is that its convergence performance is insensitive to the initialization setting (Yuan et al., 2019b).
The DED Solution Procedure
The Look-Ahead DED Procedure
For each agent, the look-ahead DED algorithm in pseudo-code form is summarized in Table 1, in which 2.2 represents the conditional communication strategy, 2.3 represents information exchange and 2.4 represents the communication failure treatment, respectively. The maximum data-transfer waiting time is set to 3 ms in the study.
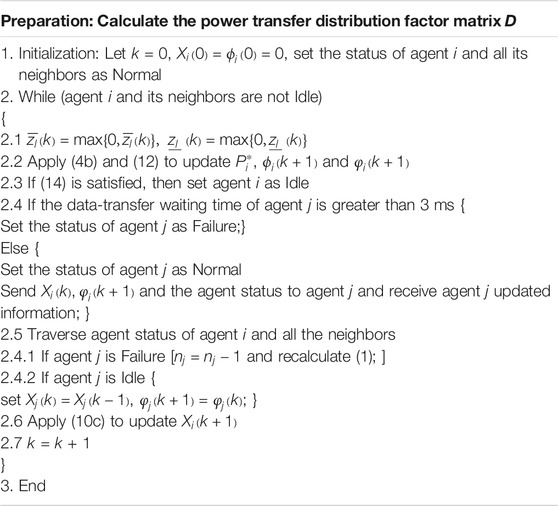
TABLE 1. Pseudo-code of the look-ahead DED for each agent.
The Real-Time DED Procedure
As mentioned in The Expected Regulation Correction, in the real-time stage how to evaluate the expected regulation
The information diffusion strategy in (de Azevedo et al., 2017) is adopted for each agent to get the global information in Eq. 8, which can be regarded as an algorithm preparation for the improved DEA to solve the real-time DED problem, here some important procedures are explained below.
1) Define the regulation vector
In (15b)–(15c), the information diffusion iteration can be regarded as a specific form of the standard EDA iteration where
2) When the algorithm converges and let
3) Each agent can achieve the average expected regulation of VPP
For each agent, the whole real-time DED algorithm including the expected regulation evaluation is summarized in Table 2, in which the details of the information exchange and communication failure treatment is similar to those in the look-ahead DED procedure, Step 1-3 represents the information diffusion strategy for algorithm preparation.
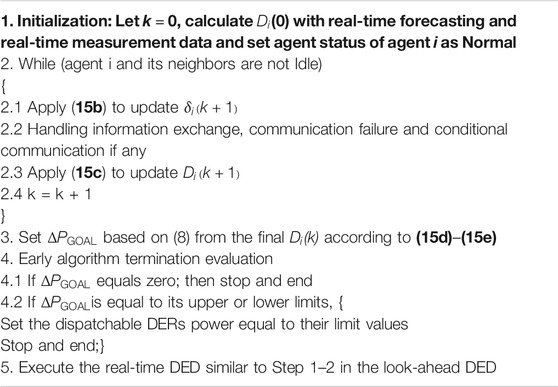
TABLE 2. Pseudo-code of the real-time DED.
Case Study
To validate the performance of the algorithm proposed above, we use a modified IEEE 14-bus topology to represent the VPP internal topology, as illustrated in Figure 3. There are 14 DERs deployed separately in the system. Two wind farms are deployed at bus 3 and bus 8, respectively, one PV station at bus 6 and the rest buses are deployed with dispatchable DERs. The dispatchable DERs data are given in Table 3, where the positive value means the power is injected and the negative value means the power is absorbed. The power flow constraints are excluded in the case. As mentioned in Multi-Agent Communication Framework, the bus indices in Table 3 are used to represent the DER indices and each DER agent has the same index as its corresponding DER; and the connection agent is located at bus 1 which is connected to the main grid. The communication network topology is identical to the physical network topology. The battery storage parameters and the improved EDA parameters are summarized in Table 4 and Table 5, respectively.
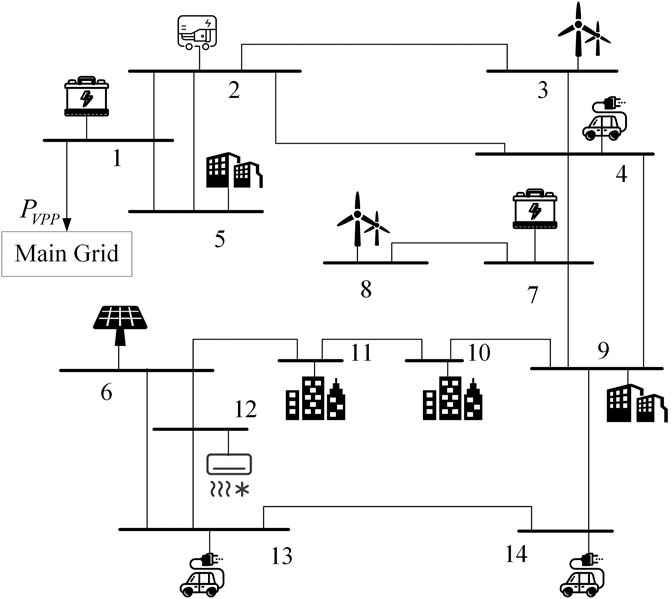
FIGURE 3. Diagram of the 14-DERs VPP.
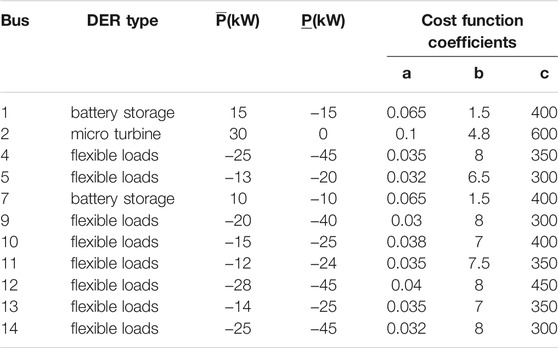
TABLE 3. DERs parameters.
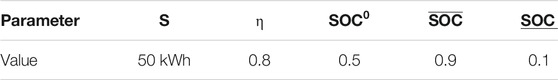
TABLE 4. Battery storage parameters.
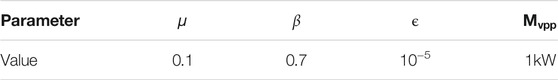
TABLE 5. Parameters in the algorithm.
Suppose the look-ahead VPP dispatch is executed at t = 8:00 and the corresponding real-time VPP dispatch is executed at t = 9:00. Figure 4A gives the 4 h look-ahead forecasting data from 8:00 to 12:00, including the wind power at bus 3 (PW3) and bus 8 (PW8), the solar power at bus 6 (PV6). Figure 4B shows the VPP schedule curve issued by CSO, in which the negative value means VPP need to absorb power, considering some specific operation scenario that the wind and solar power is low. Figure 4C gives the total baseline flexible loads profiles initially (before dispatch).
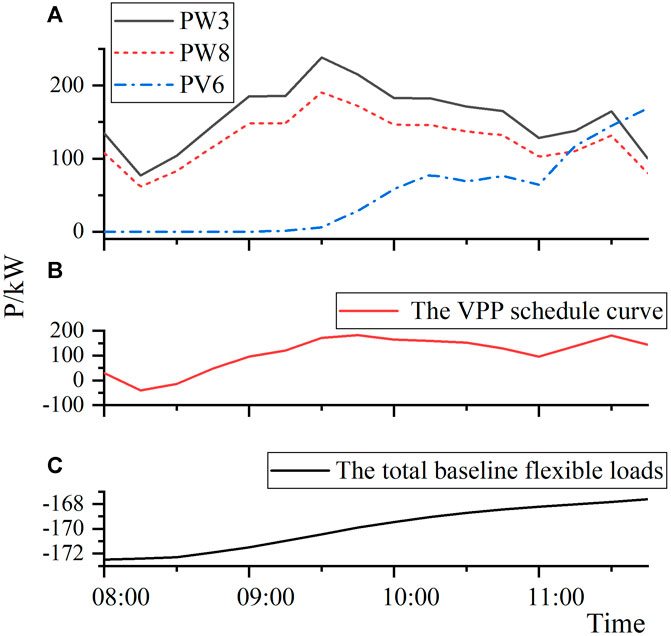
FIGURE 4. VPP data: (A) The look-ahead forecasting curve (B) The VPP schedule curve (C) The total baseline flexible loads.
Dispatch Results
The look-ahead DED is finished based on the improved EDA in Solution Methodology Based on the Improved Exact Diffusion Algorithm. For comparison purpose, the CED model (3a)–(3f) is also solved. The total cost of each dispatchable DER from the DED solution and the CED overall cost are presented in Figure 5A, it is very clear that the total DED cost is very close to the CED overall cost, which can confirm the effectiveness of the DED model. Further, the resultant time-series VPP power exchange with the main grid is plotted in Figure 5B which can well track the VPP schedule curve in Figure 4B. The resultant total battery storage power and the total flexible loads after the look-ahead dispatch is shown in Figure 5C. The micro turbine doesn’t provide any power output in the look-ahead dispatch due to its high cost.
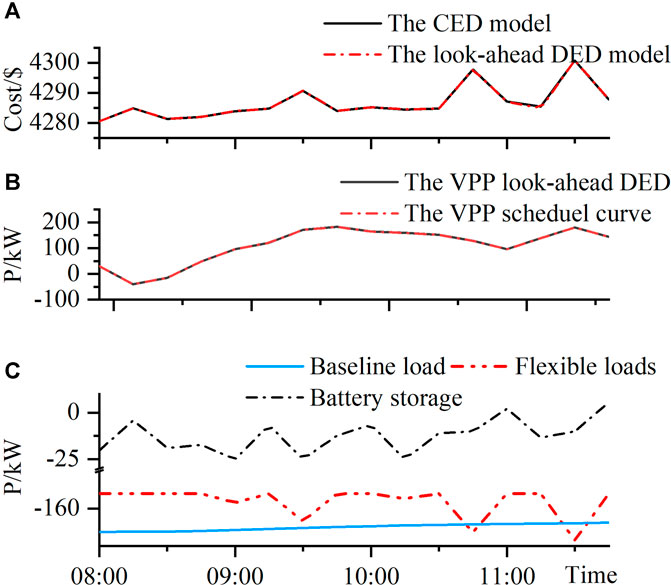
FIGURE 5. The look-ahead DED performance analysis (A) Total cost (B) Tracking performance (C) Flexible loads and battery storage power.
The real-time tracking performance of VPP from 9:00−10:00 is shown in Figures 6A,B. Due to the deviation between the look-ahead forecasting and the real-time forecasting, there exists obvious tracking errors, comparing the VPP power output (the dot dash line) with the VPP schedule curve (the solid line) in Figure 6B. In addition, the real-time DED can further correct the deviation (the dash line) and improve the tracking performance.
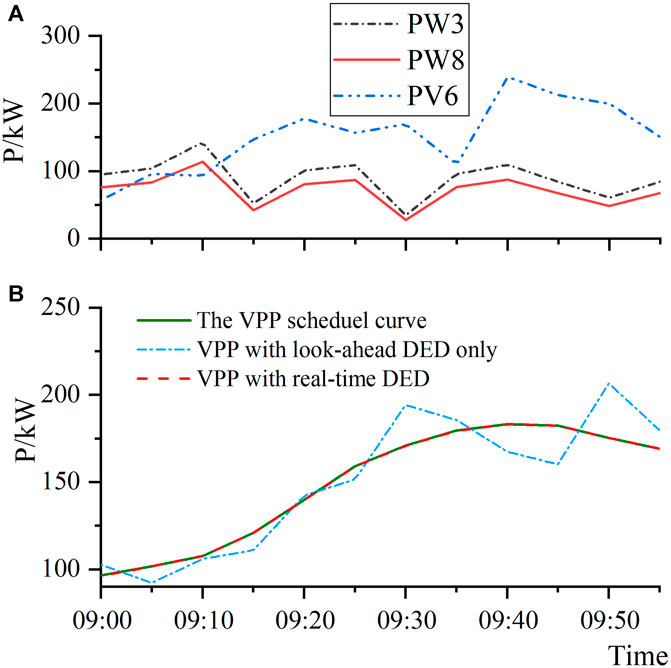
FIGURE 6. (A) The real-time forecasting power (B) The VPP real-time DED performance.
Analysis on the Effect of Prediction Error
To analyze the effect of prediction error on dispatch performance, the look-ahead dispatch according to four prediction error level, ± 10, ± 15, ± 20, and ±25% are presented in Figure 7, where the real-time wind and solar power data here is represented by the look-ahead prediction plus prediction error. Based on the above two-stage dispatch, the tracking standard deviation from the schedule curve during 9:00−10:00 is used to measure the tracking effect is presented in Table 6.
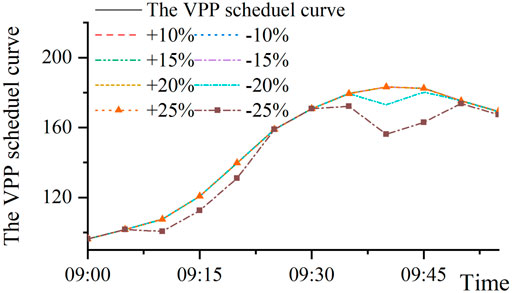
FIGURE 7. Look-ahead DED performance with prediction error.

TABLE 6. The mean absolute tracking error.
It is observed that when the prediction error is within ± 20%, the VPP power output in this test system can well track the schedule curve. Nevertheless, the tracking performance will become worse when the prediction error is enlarged, because the total up-regulation capacity is not enough in this case. On the other hand, the dispatch performance can be satisfied when there is enough adjustment capacity in the real-time stage to compensate for the deviation.
Communication Robustness
To verify the algorithm robustness, it is supposed that the communication line between agent 1 and agent 2 fails at 9:15 during the real-time DED. The whole convergence process of agent 1 (at bus 1) for the 9:15−9:20 time interval with and without communication failure is plotted in Figure 8:
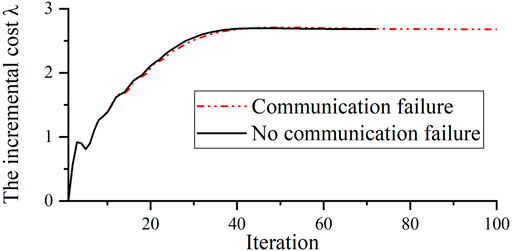
FIGURE 8. The convergence process of bus 1.
It can be seen from Figure 8, when the local communication failure occurs, the proposed improved EDA still has enough robustness to converge to the same optimal solution without communication-failure, only with the convergence speed lightly slowed down.
Algorithm Performance Verification
To measure the accuracy and convergence performance of the improved EDA, a power residual based performance index
where
For comparison purpose, here the look-ahead dispatch at 8:00 is performed using the proposed improved EDA, the standard EDA and the consensus-based algorithm (Tang, Hill, and Liu 2018). The results are given in Figure 9, where the convergence processes of all DERs are presented in Figure 9A and the power residual evolution comparison is presented in Figure 9B. It is very clear that the incremental cost of all DERs converge to the consensus value
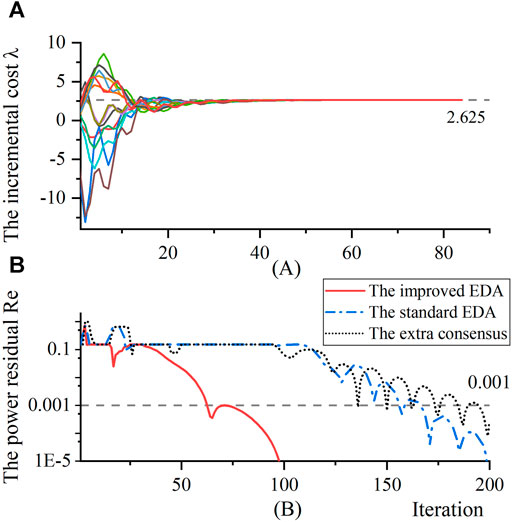
FIGURE 9. (A) The convergence process (B) The power residual evolution.
Conclusion
A distributed two-stage economic dispatch for VPP based on the improved exact diffusion algorithm is proposed in this paper to manage a large scale of DERs dispersed geographically and deal with the uncertainty of DERs. The centralized look-ahead dispatch and real-time tracking models are transformed to distributed ones by constructing dual problems and separating the Lagrange multipliers. The exact diffusion algorithm is improved by adding a convex penalty term and a conditional communication strategy. Case studies based on a modified IEEE 14-bus system validate that VPP power output can track the VPP schedule curve well and balance the power deviation using the improved exact diffusion algorithm with certain robustness against local communication failure.
Data Availability Statement
The original contributions presented in the study are included in the article/supplementary material, further inquiries can be directed to the corresponding author.
Author Contributions
YZ and ZW conceptualized the study; YZ and ZW performed the analysis; YZ, ZW, and HW performed investigations; ZW and PJ acquired resources; ZW and PJ acquired funding; YZ and ZW wrote the original draft; PJ and HW reviewed and edited the manuscript. All authors agree to be accountable for the content of the work.
Funding
This work was supported by the National Nature Science Foundation of China (No. 51837004).
Conflict of Interest
The authors declare that the research was conducted in the absence of any commercial or financial relationships that could be construed as a potential conflict of interest.
Publisher’s Note
All claims expressed in this article are solely those of the authors and do not necessarily represent those of their affiliated organizations, or those of the publisher, the editors and the reviewers. Any product that may be evaluated in this article, or claim that may be made by its manufacturer, is not guaranteed or endorsed by the publisher.
References
Baringo, A., Baringo, L., and Arroyo, J. M. (2019). Day-Ahead Self-Scheduling of a Virtual Power Plant in Energy and Reserve Electricity Markets under Uncertainty. IEEE Trans. Power Syst. 34 (3), 1881–1894. doi:10.1109/tpwrs.2018.2883753
Bouffard, F., and Galiana, F. D. (2008). Stochastic Security for Operations Planning with Significant Wind Power Generation. IEEE Trans. Power Syst. 23 (2), 306–316. doi:10.1109/TPWRS.2008.919318
Boyd, S. (2010). Distributed Optimization and Statistical Learning via the Alternating Direction Method of Multipliers. Foundations Trends® Machine Learn. 3 (1), 1–122. doi:10.1561/2200000016
Christie, R. D., Wollenberg, B. F., and Wangensteen, I. (2000). Transmission Management in the Deregulated Environment. Proc. IEEE 88 (2), 170–195. doi:10.1109/5.823997
de Azevedo, R., Mehmet Hazar, C., Tan, Ma., Osama, A., and Mohammed, (2017). Multiagent-Based Optimal Microgrid Control Using Fully Distributed Diffusion Strategy. IEEE Trans. Smart Grid 8 (4), 1997–2008. doi:10.1109/tsg.2016.2587741
Ding, Y., Jia, H., Song, Y., Li, Y., and Jin, W. (2016). Review of Reliability Evaluation Methods for the Smart Grid Considering the Interaction between Wind Power and Flexible Demand Resources. Proc. CSEE 36 (6), 1517–1526. (in Chinese). doi:10.13334/j.0258-8013.pcsee.2016.06.007
Koraki, D., and Strunz, K. (2018). Wind and Solar Power Integration in Electricity Markets and Distribution Networks through Service-Centric Virtual Power Plants. IEEE Trans. Power Syst. 33 (1), 473–485. doi:10.1109/tpwrs.2017.2710481
Li, Z., Wu, W., Zhang, B., and Wang, B. (2015). Adjustable Robust Real-Time Power Dispatch with Large-Scale Wind Power Integration. IEEE Trans. Sustainable Energ. 6 (2), 357–368. doi:10.1109/tste.2014.2377752
Lin, X., and Boyd, S. (2003). Fast Linear Iterations for Distributed Averaging.” in Proceeding of the 42nd IEEE International Conference on Decision and Control. Maui, HI: IEEE. December 9–12, 2003, Maui, HI, USA.
Lu, N. (2012). An Evaluation of the HVAC Load Potential for Providing Load Balancing Service. IEEE Trans. Smart Grid 3 (3), 1263–1270. doi:10.1109/tsg.2012.2183649
Mateos-Nunez, D., and Cortes, J. (2017). Distributed Saddle-Point Subgradient Algorithms with Laplacian Averaging. IEEE Trans. Automatic Control. 62 (6), 2720–2735. doi:10.1109/tac.2016.2616646
McArthur, S. D. J., Davidson, E. M., Catterson, V. M., Dimeas, A. L., Hatziargyriou, N. D., Ponci, F., et al. (2007). Multi-Agent Systems for Power Engineering Applications—Part I: Concepts, Approaches, and Technical Challenges. IEEE Trans. Power Syst. 22 (4), 1743–1752. doi:10.1109/TPWRS.2007.908471
Nedic, A., and Ozdaglar, A. (2009). Distributed Subgradient Methods for Multi-Agent Optimization. IEEE Trans. Automatic Control. 54 (1), 48–61. doi:10.1109/tac.2008.2009515
Šošić, D., Škokljev, N, and Pokimica, N., 2014. Features of Power Transfer Distribution Coefficients in Power System Networks, INFOTEH-JAHORINA 13, 86–90.
Tang, Z., Hill, Dd. J., and Tao, . (2018). A Novel Consensus-Based Economic Dispatch for Microgrids. IEEE Trans. Smart Grid 9 (4), 3920–3922. doi:10.1109/tsg.2018.2835657
Tu, S-Y., and Ali, S. (2012). Diffusion Strategies Outperform Consensus Strategies for Distributed Estimation over Adaptive Networks. IEEE Trans. Signal Process. 60 (12), 6217–6234. doi:10.1109/TSP.2012.2217338
Vahedipour-Dahraie, M., Rashidizadeh-Kermani, H., Shafie-Khah, M., and Catalão, J. P. S. (2021). Risk-Averse Optimal Energy and Reserve Scheduling for Virtual Power Plants Incorporating Demand Response Programs. IEEE Trans. Smart Grid 12 (2), 1405–1415. doi:10.1109/TSG.2020.3026971
Wang, B., Hu, X., Gu, W., Li, Y., and Kong, L. (2019). Hierarchical Control Architecture and Decentralized Cooperative Control Strategy for Large Scale Air Conditioning Load Participating in Peak Load Regulation. Proc. CSEE 39 (12), 3514–3528. (in Chinese). doi:10.13334/j.0258-8013.pcsee.172444
Xia, S., Bu, S., Wan, C., Lu, Xi., Chan, K. W., and Zhou, B. (2019). A Fully Distributed Hierarchical Control Framework for Coordinated Operation of DERs in Active Distribution Power Networks. IEEE Trans. Power Syst. 34 (6), 5184–5197. doi:10.1109/tpwrs.2018.2870153
Yuan, K., Ying, B., Zhao, X., and Sayed, A. H. (2019a). Exact Diffusion for Distributed Optimization and Learning—Part I: Algorithm Development. IEEE Trans. Signal Process. 67 (3), 708–723. doi:10.1109/tsp.2018.2875898
Yuan, K., Ying, B., Zhao, X., and Sayed, A. H. (2019b). Exact Diffusion for Distributed Optimization and Learning—Part II: Convergence Analysis. IEEE Trans. Signal Process. 67 (3), 724–739. doi:10.1109/tsp.2018.2875883
Keywords: distributed energy resources, virtual power plant, distributed economic dispatch, multi-agent, communication failure
Citation: Zheng Y, Wang Z, Ju P and Wu H (2021) A Distributed Two-Stage Economic Dispatch for Virtual Power Plant Based on An Improved Exact Diffusion Algorithm. Front. Energy Res. 9:734801. doi: 10.3389/fenrg.2021.734801
Received: 01 July 2021; Accepted: 23 September 2021;
Published: 21 October 2021.
Edited by:
Ningyi Dai, University of Macau, ChinaReviewed by:
Xiaoqing Bai, Guangxi University, ChinaXiaohe Yan, North China Electric Power University, China
Copyright © 2021 Zheng, Wang, Ju and Wu. This is an open-access article distributed under the terms of the Creative Commons Attribution License (CC BY). The use, distribution or reproduction in other forums is permitted, provided the original author(s) and the copyright owner(s) are credited and that the original publication in this journal is cited, in accordance with accepted academic practice. No use, distribution or reproduction is permitted which does not comply with these terms.
*Correspondence: Zhen Wang, ZWV6d2FuZ0BpZWVlLm9yZw==