- 1Yunnan Power Grid Co., Ltd., Kunming, China
- 2Electric Power Research Institute of Yunnan Power Grid Company Ltd., Kunming, China
- 3Kunming Power Supply Company of Yunnan Power Grid Co., Ltd., Kunming, China
For any power system, the reliability of measurement data is essential in operation, management and also in planning. However, it is inevitable that the measurement data are prone to outliers, which may impact the results of data-based applications. In order to improve the data quality, the outliers cleaning method for measurement data in the distribution network is studied in this paper. The method is based on a set of association rules (AR) that are automatically generated form historical measurement data. First, the association rules are mining in conjunction with the density-based spatial clustering of application with noise (DBSCAN), k-means and Apriori technique to detect outliers. Then, for the outliers repairing process after outliers detection, the proposed method uses a distance-based model to calculate the repairing cost of outliers, which describes the similarity between outlier and normal data. Besides, the Mahalanobis distance is employed in the repairing cost function to reduce the errors, which could implement precise outliers cleaning of measurement data in the distribution network. The test results for the simulated datasets with artificial errors verify that the superiority of the proposed outliers cleaning method for outliers detection and repairing.
Introduction
With the evolution of smart grids, the intelligent monitoring equipment and system are becoming an integral component of the distribution network, collecting a substantial volume of data in order to manage the status and provide timely updates in the network (Alimardani et al., 2015; Wang et al., 2018). Among them, the supervisory control and data acquisition (SCADA) system provides a large number of operation data and analysis results, which brings great convenience for operators to evaluate the planning and operation of distribution system. For instance, the data structure is complex, many types of the data, and the sampling period/frequency of data are also different. For distribution network dispatching control system, poor quality data may lead to wrong decisions, which will have a great impact on the stable operation of power grid. Hence, it is essential that to clean the outliers of measurement data in the distribution network.
The distribution network is an important part of production, transmission, and consumption, which plays a critical role in the delivery of electric power. In the planning and operation of distribution network, the availability of accurate measurement data has a considerable impact on dispatching operations and control of the distribution network. For instance, the analysis of measurement data in the distribution network can assist in taking action against fault detection, dispatching, load forecasting, power quality, tariff settings, and so forth. (Hayes et al., 2018; Cai et al., 2021; Wang et al., 2019). Moreover, it solves the problems that distribution networks frequently face in terms of integrated energy planning, distributed energy storage, and demand-side management, respectively (Thams et al., 2018; Liu et al., 2019). Generally, the majority of the researches in the distribution network, for the analysis and prediction of the measurement data, is focus on the feature selection or parametric optimization of the model (Liu et al., 2020). However, due to the complex topology features and communication disturbances, the accuracy of distribution network measurement data is not always satisfactory, making it susceptible to data anomalies such as outliers or missing data (Shi et al., 2019). To fill in missing data, denoise while detecting outliers, and repair inconsistencies, data cleaning is the first and most crucial step. Obviously, it has a decisive influence on the final result: if the dataset is incomplete in terms of data cleaning and preprocessing. This means that the established analysis and prediction model will not be accurate and efficient, which may no longer be suitable for the planning and operation of distribution system. For instance, due to external disturbances, data recorded in smart electric meters is abruptly modified because a transmission error for control commands, such as electric quantity or associated parametric information is reset to outliers, or even data missing (Nascimento et al., 2012). And in DC microgrids, the large-scale converters with inhomogeneous initial values are widely appeared due to soft-starting operation, which make the input-output maps error will be large (Wang et al., 2021). Under these circumstances, efficient preprocessing via data cleaning aids in improving the quality and accuracy of subsequent analysis and decision-making outcomes, which can successfully guide the planning and operation of the distribution network.
Researchers have extensively conducted many outliers cleaning studies to improve the data quality and decision-making results, including outliers detection and repairing. For outliers detection, with the rapid development of machine learning technology, many machine learning algorithms have been utilized to improve the accuracy in power systems. In literature (Nemati et al., 2018), a constraint and association rule-based current transmission capability forecasting method was proposed for outliers detection in substation metering equipment. However, this model is complex and computationally intensive, which is not suitable for the detection of bad data in a large number of transformer districts. In literature (Esmalifalak et al., 2014), support vector machine (SVM) has been investigated for detecting the outliers injected into the measurement data from power grid. Since SVM is a supervised learning method, it necessitates labeling the data in order to train the model. However, in practice, obtaining a considerable volume of tagged data is difficult. In literature (Thang et al., 2011), a density-based DBSCAN algorithm was used for detecting the network traffic outliers of electricity meters, which dataset may include multiple traffic types with different characteristics. It has a high level of outliers detection performance, but there are difficulties in finding its parameters (epsilon and minpts) when the multidimensional feature data is taken into account. In literature (Li et al., 2018), the isolation forest (IF) algorithm was proposed to detect the outliers, and the backpropagation neural network (BPNN) algorithm was used for predicting and repairing the outliers. However, IF algorithm is usually suitable for detecting global outliers, but not for detecting local outliers.
Traditionally, researchers have concentrated more on a basic and easy to repair statistical estimate method for outliers repairing. Still, mining a deep relationship between data is difficult, and the repairing results are not ideal (Waal et al., 2001). By contrast, machine learning (also includes deep learning) methods is a very effective technology, which could easily recognize the outliers through the linear or nonlinear pattern relationships and the repairing results could more accurately. For instance, in literature (Qu et al., 2016), a hierarchical clustering algorithm based on the clustering using representatives (CURE) was proposed for the outliers detection the repairing, which could confirm the normal value boundary samples from historical data. However, when the volume of data is large, the time complexity is poor and precision is low with the hierarchical clustering algorithm, which make a challenge to determine the ideal boundary sample number. In literature (Hu et al., 2021) a data recovery method based on generative adversarial networks (GANs) was proposed for safe and efficient operation in the pipeline network, which could accurately recover incomplete pressure data caused by the device or communication aspect. But there are still some difficulties when the complete data pairs is no provided in the training process. On the other hand, to produce good repairing results, a metric learning and a cost functional model are proposed to estimate data repairing efficiency while taking sample distances into account (Li et al., 2019). Distance is a term that describes the dissimilarity of two input samples. Among them, the most frequently used technique is the Euclidean distance. However, the Euclidean distance takes neither the correlation of the features nor the different weights of features into account, which may not reflect the real nature of the problem, and distorts the true dissimilarity between samples. To address this issue, in literature (Maesschalck et al., 2000), the Mahalanobis distance idea was defined to use the similarity metric as a substitution to perform better. In another example (Yan et al., 2020), the adoption of the Mahalanobis distance improves the classic k-nearest neighbor (KNN) outliers identification method, resulting in increased accuracy and a lower false detection rate. However, the repair of outliers has not been considered in this model. Furthermore, most of the models stated above focus on specific application scenarios and do not process real-time data from the distribution network system. Moreover, most of the outliers cleaning methods aforementioned presumed the underlying population distribution before the step of data cleaning. However, in real-word data, a hypothesis about an underlying population is a statement that may be true or false.
In power grids, a huge amount of historical measurement data from various distribution stations is available, which could provide valuable information for detecting and repairing outliers. Furthermore, the association rules learning is a popular and well data mining method for discovering relations between variable features. Our motivation is to investigate how to capitalize on the historical data for outliers cleaning, including outliers detection and repairing, to achieve expected performance. An association rules-based method for outliers cleaning is given in this work to mine the information which whereas the assumptions of underlying population about the data is not required. In outliers detection, we adopt the density-based spatial clustering of application with noise (DBSCAN), k-means and Apriori technique to generate the association rules. After the outliers detection, the distance-based model is designed with Mahalanobis distance to repair to outliers. Various tests are carried out on data sets with simulated errors to evaluate the good performance of the proposed method. The test results indicate that the proposed method can effectively identify outliers in the distribution network’s measurement data while achieving accurate data repairing. The proposed method detects the outliers with a F1-Score (a metric combine precision and recall) of 96%, even in the condition with a high anomaly rate. The F1-Score indicates how well precision and memory are balanced. Furthermore, the correlation between features of measurement data is also computed to detect and repair the outliers, thus improving the method’s accuracy. The main contributions of this work could be summarized as follows two aspects:
1) This paper introduces an outlier detection and repairing technique based on association rule. The proposed technique uses the information provided from historical measurement data, whereas the assumptions of underlying distribution about the measurement data is not required.
2) The distance-based model is adopt for outliers repairing, which describes the similarity between outlier and normal data by the Mahalanobis distance. It estimates the outliers according to the normal data within historical data, which is employed to improve the estimation accuracy.
The remainder of the paper is organized in the following manner. Problem Statement discusses the measurement problems in the distribution network and data anomalies. The proposed methodology has been presented in Preliminaries and The Proposed Model for Outliers Detection and Repairing. Simulation results are provided in Experiment and Analysis, and the concluding remarks are summarized in Conclusion.
Problem Statement
Measurement Problems in Distribution Network
Through SCADA system, a large amount of operating data is continuously collected, uploaded, and formed into big data for the distribution network, which provides abundant data resources for big data analysis (Ye et al., 2010; Song et al., 2013). And the data collected by SCADA has the following characteristics: large amount, high dimensions, and complex data types. Then the most common problems encountered in measurement data are the absence of data (nulls values and zeros), change in level and spikes (points more than N times the standard deviations away from the series mean), and generally are called outliers. Therefore, in order to improve the accuracy of the analysis and decision-making results based on measurement data, how to clean and repair outliers form the measurement data in distribution network is a challenge faced by distribution system.
The Source of Abnormal Data in Distribution Network
The process of collecting measurement data from the distribution network involves many components such as metering equipment, metering centers, and communication systems. However, if a malfunction occurs in any measurement channel, it can lead to data anomalies (Chen et al., 2010). For example, the failure of smart electricity meters, noise interference, data transmission errors, and abnormal power consumption will cause these collected data to become outliers or data missing. Generally, there are three potential sources of data anomalies in distribution network measurement data:
1) Metering equipment. The measuring equipment from abnormal operating conditions may lead to errors in measurement (Yan et al., 2015; Chen et al., 2010). In particular, the magnetic bias phenomenon in potential transformers (PT) and current transformers (CT) equipment would cause measurement errors (Mccamish et al., 2016). Also, the non-synchronous problem on data collection could cause errors since the sampling time of some devices is asynchronous (Liu et al., 2020). In particular, all forms of metering and communication equipment are constantly exposed to unknown conditions. They are vulnerable to the effects of real-world circumstances, which typically have a high failure rate. Meanwhile, the operation in the monitoring and communication equipment can not be carried out smoothly when a fault occurs. In that situation, erroneous or missing data will be recorded.
2) Distribution network. Control operations and faults in the distribution network have a significant impact on the accuracy of measurement data. Temporary inrush current interference caused by switchgear such as circuit breakers may cause temporary outliers to appear in some measurements when adjusting the operation of the distribution network. In any fault event, the metering equipment may fail to function properly, resulting in measurement issues.
3) Communication systems. Due to the distribution network’s complex topology and geographical environment, local communication links usually use low-power and lossy networks in power distribution networks. This type of network is prone to data packet loss. Also, the reliability of distribution network data transmission is affected by the communication links. The way of communication will also affect the reliability of data transmission in the distribution network. Due to cost constraints, most distribution topologies use communication methods such as distribution carrier waves, Zigbee wireless technology, and industrial wiring (Pei et al., 2010). These communication methods are less reliable and often break codes when the channel is exposed to heavy electromagnetic interference, resulting in missing data.
All of the above issues may produce anomalous data, causing the quality of the data to be inconsistent and reduce usability. Therefore, it is necessary to clean the data before using it for analysis and utilization. The prominent data anomalies in the existing distribution network data are missing data and outliers. The term “data missing” applies when the collected value is null or contains an invalid value. In contrast, outliers occur when the collected value deviates from normal data. The value exceeds the acceptable range of change (data is too big or too small) and maintains a certain time pattern without repetition.
Figure 1 illustrates the distribution of abnormal voltage data in the distribution network for various purposes. Figure 1A shows the abnormality caused by the malfunction of the metering equipment. The characteristic feature of this phenomenon is that some observations are outliers or missing values, which do not last for a long time but occur frequently. Figure 1B shows the data abnormality caused by the failure of a terminal monitoring point. It is characterized by continuous data anomalies or single-point data anomalies occurring at a single point of observation. Figure 1C shows the data anomalies caused by excited inrush disturbances and automation equipment actions at controller monitoring points. This abnormality is characterized by short-term outliers in some observations, i.e., retained for a very small period of time. Figure 1D shows data anomalies caused by faults in the communication system of the sub-stations. It is defined by a partial loss of temporal data at various intervals and is typically retained for a short period of time.
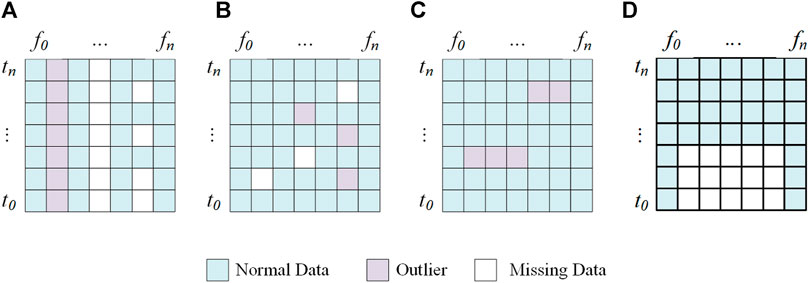
FIGURE 1. The distribution of abnormal voltage data for several reasons: (A) Abnormal voltage data cause by Metering equipment; (B) Abnormal voltage data cause by faults; (C) Abnormal voltage data cause by operation control; (D) Abnormal voltage data caused by the communication system.
Outliers Cleaning in Distribution Network
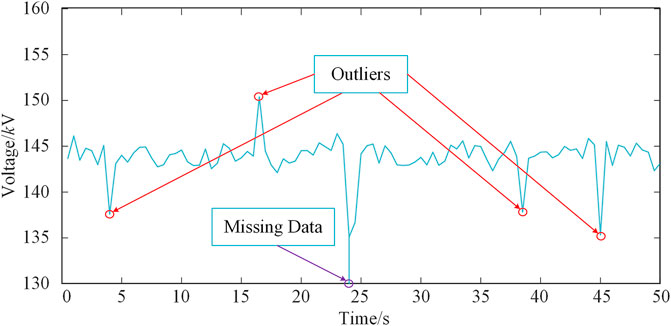
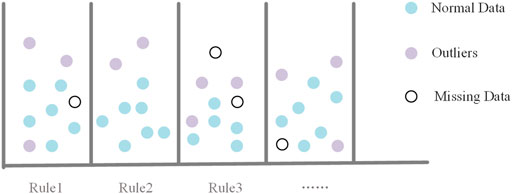
The above issues might pollute the measurement data, which make it not suitable used directly for distribution system planning and operation. Therefore, the data preprocessing is an essential process before using data for analysis and decision-making, and the outliers detection is the most important part of the process. Generally speaking, a good outlier detection algorithm should be able to identify outliers correctly, and would no have any response to the normal data. As shown in Figure 2, a dataset of the voltage amplitude, which received from sensors and contains four outliers and one missing data, and highlight it in the figure. The aim of the outliers detection is to find the highlight points and mark it with lables, which is the kernel of the data cleaning.
Association rules learning are a rule-based machine learning method, which is a research focus of the data mining and analysis. In an method for automatically generating association rules, it mainly includes three important steps: data denoising, data discretization and rule mining. Furthermore, how to select the sub-algorithm is a critical step. In this paper, the density-based algorithm, DBSCAN, is chosen in the data denoising step, which has a excellent result in denoising and high scalability. Then in the data discretization step, the distance-based algorithm, K-means is used since its precise classification result and high computation efficiency. And in the rule mining step, Apriori algorithm is selected because of its high stability and flexible extension ability. With that in mind, we presents an outliers cleaning method based on association rules, which could found the implicit relationship between features from the historical measurement data and pick up the valuable information on outliers detection and repairing. For the outliers detection, the DBSCAN, K-means and Apriori algorithm are chosen for generating the association rules from historical data, which make the detector more flexible and accurate. For the outliers repairing, the repairing cost is chosen with a distance-based model. And the Mahalanobis distance is chosen to use for constructing a data repairing cost function, which could reduce the errors.
Preliminaries
DBSCAN Clustering Algorithm
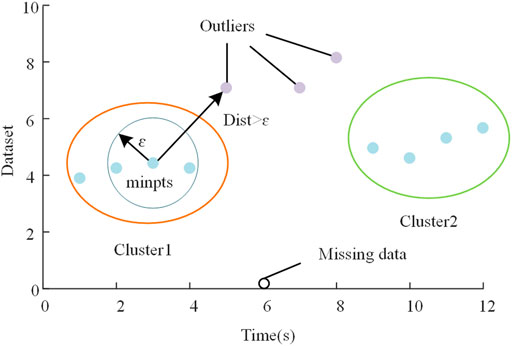
DBSCAN is an unsupervised machine learning clustering algorithm that could be used for data classification with a nonlinear density structure (Chen et al., 2021; Chipade et al., 2021). The algorithm treats the data as points in space and clusters them based on density magnitude, allowing clusters of arbitrary shapes to be found in a noisy space. The basic idea of DBSCAN is to introduce neighborhood and density connectivity concepts, explore the data points, and use density connectivity to grow clusters until outliers split them. The DBSCAN clustering algorithm can be adapted to any form of clustering. It can filter out noisy outliers in space, making it ideal for outliers detection in the distribution network.
Assume a historical measurements datasets
where fij represents the jth feature of the ith data.
Meanwhile, let
Then, for any point
where,
If a point
Algorithm 1: Density-based spatial clustering of applications with noise(DBSCAN).
Association Rules Mining
Association rule learning is a rule-based machine learning method used to mine frequent patterns, correlations, or causal structures between itemsets. It is intended to determine valuable rules based on the frequency of occurrence between itemsets in a database (Rauch, 2005; Chengyu et al., 2016). In data cleaning, the association rules algorithm is applied for mining the relationship between various features of the measurement data in the power system.
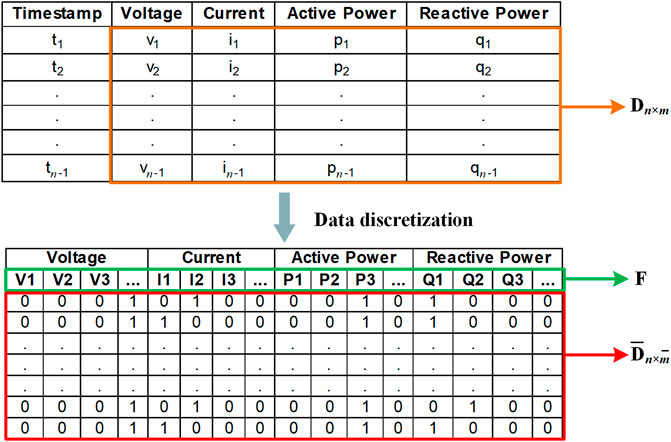
At first, the obtained features should be discretized to improve the robustness of association rules to outliers. After data discretization, a datasets D with size
Let
where
Since the magnitude of support and confidence value is commonly used to assess the effectiveness of an association rule. The following Eq. 5 represents a definition to support an association rule between
where count is the number of occurrences of an item in data
The confidence value indicates the reliability of the association rule. The confidence of an association rule between and can be defined as follows:
In this work, we use Apriori algorithm is employed to search for the itemsets frequency in the complete transaction set. In this approach, the ones with more than the minimum support and the minimum confidence are used as strong association rules. These rules give high confidence and strong support greater than or equal to a user-specified minimum confidence threshold and a minimum support threshold. The process of the algorithm is explained in Algorithm 2.
Algorithm 2: Association Rule Mining with Apriori. 
Mahalanobis Distance
The Euclidean distance is the most common metric of distance in data science, which describes the straight-line distance between two points in Euclidean space. Consider the case where two or more variables are linked. The axes are no longer at right angles in this situation, and measurements are no longer possible. The Euclidean distance cannot represent the real distance between feature vectors. To mitigate this issue, Mahalanobis distance is implemented. The Mahalanobis distance measures the distance between two points in multivariate space (Maesschalck et al., 2000). It calculates distances between points, including correlated points for multiple variables.
For a given sample set, in order to integrate the correlation between the sample points, the distance between numerical data features can be calculated using the Mahalanobis distance metric to measure the similarity between samples (Liu, et al., 2020). For a feature, the variation between two observations can be specified by Eq. 7.
where S is the covariance matrix, and M = S−1, if the two samples have similar or identical characteristics, the martingale distance should be small or even zero.
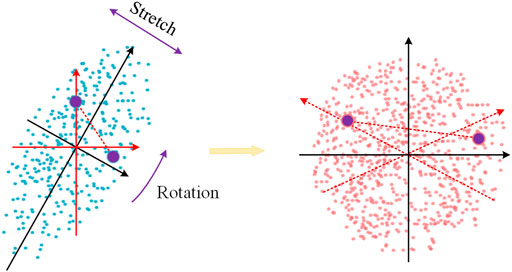
Figure 5 illustrates the transformation in the two-dimension space. Here, the blue and pink dots represent the original and transformed data. For presented data points, the correlation of the two features causes the oval shape of the original distribution. If we apply the Euclidean distance, it will not reflect the real dissimilarity of the data. While calculating Mahalanobis distance, the eclipse is first transformed to a standardized circle with a radius equal to 1, and then the Euclidean distance in the transformed space is calculated. Meanwhile, computing the distance, the influence of correlation is offset by the transformation.
The Proposed Model for Outliers Detection and Repairing
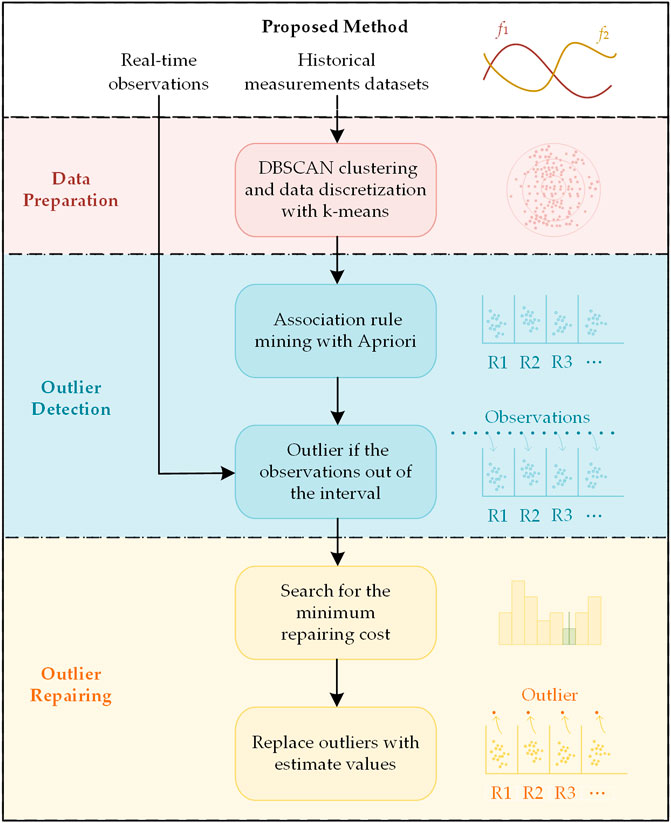
Since historical measurement data from SCADAS is required processing, using this information, the proposed model generates a list of association rules to evaluate the correlation between distinct variables. The overall flowchart of the proposed method is shown in Figure 6. The proposed model consists of three stages: data preparation, outliers detection and outliers repairing.
1) In the data preparation process, it has a task with DBSACN clustering algorithm to eliminate ineffective information, which purposes is to find the obvious abnormal data like null or missing values and so on. Then prepared dataset (D) will be discretized with k-means clustering algorithm, which purposes is to get the discrete dataset
2) In the outliers detection process, it is necessary to mine the association rules in historical data for detecting outliers. The association rules will be mined from the dataset
3) In the outliers repairing process, all the sample points would be mapped into a feature space, which determining by the association rules. Subsequently, a novel cost function is constructed and used for data repairing, and the outlier will be repaired with the value which have the minimum repair cost. In this paper, the distance metric is formed with Mahalanobis distance, and similar normal data related to the query outliers are retrieved.
Data Preparation
In practice, there are some anomalies in the historical measurement data from the distribution network, which may bring invalid/incorrect information. Therefore, it is necessary to process the historical data before mining the association rules. We employ the DBSCAN clustering algorithm as the noise detector and design a procedure to dispose of the anomalies in the historical measurement data. The DBSCAN algorithm divides these observations into several clusters and outliers. The parameter of and minpts is chosen based on the silhouette coefficient. Next, the data points in each cluster are labelled as 0, while the outliers are labelled as 1. Furthermore, to generate the association rules, we use k-means for data discretization.
Outliers Detection
The results from the association rules are used for detecting the outliers. In any case, the outliers detection of each feature is based on comparisons between the new real-time observations and the association rules generated from all historical measurement data. In the final analysis, if a real-time measurement mismatches the interval defined by the associated rule, it will be flagged as an outlier.
For example, assume association rules are generated as follows:
For a new observation
According to the association rule, the new observation is compared to previous observations that have the same features. The
Outliers Repairing
As shown in Figure 7, after outliers detection, for any point
For example, assume the presence of outliers for the voltage magnitude, and the following Rule1 are generated with the highest confidence:
According to this rule, the correct value of voltage magnitude should be in the range of [142.3809,144.0914). It means that after the outliers are repaired, the point is still in the original sub-RBS. This is because data repairing can be translated into searching for normal data with the highest similarity to it within the RBS.
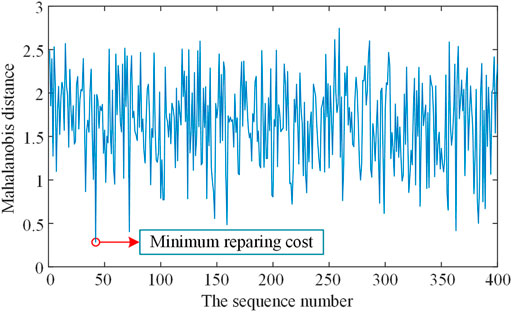
The Mahalanobis distance is used as a metric to account for the distributional differences between attributes. The repair results within this RBS are not unique, and each result has a corresponding repair cost. As shown in Figure 8, in outlier repairing, the objective is to minimize the repairing cost function as Eq. 8.
where x′ is the repairing result of the corresponding x.
However, in some cases, the minimum value of the cost function is more than one. In these cases, the abnormal observation will be replaced by
where
In addition, we consider the outliers repairing with the data feedback. When an outlier is cleaned to a normal value after outliers repairing, the observation would be updated in the RBS for a new outlier that needs repair. The accuracy of outliers repairing could be improved with data feedback.
Experiment and Analysis
The Metrics Used for Evaluating
Outliers detection of measurement data is an unbalanced binary classification problem. Data are classified as normal or abnormal. In this way, accuracy is not an appropriate metric for evaluating the performance of a method. The detection results could be classified into four types according to the label between actual and prediction values: true positive (TP), true negative (TN), false positive (FP) and false negative (FN). The confusion matrix of outliers detection is shown in Table 1. In general, the Precision, Recall and F1-Score are used as the metrics for evaluating of classification problem. Among them, the Precision is a metrics reflects the reliability of the detection results, while the Recall is a metrics reflects how many truly detection results are returned. And the F1-Score is the harmonic mean of precision and recall.
According to the confusion matrix of outliers detection, the Precision, Recall and F1-Score could be calculated by Eqs 10–12.
where TP is the count of outlier detected as an outlier, FP is the count of normal data detected as an outlier, FN is the count of outlier detected as normal data.
In addition, two metrics used for outliers repairing: the mean absolute error (MAE) and the root mean square error (RSME). They are defined as follow Eqs 13, 14 .
where N is the size of data,
The Simulated Dataset
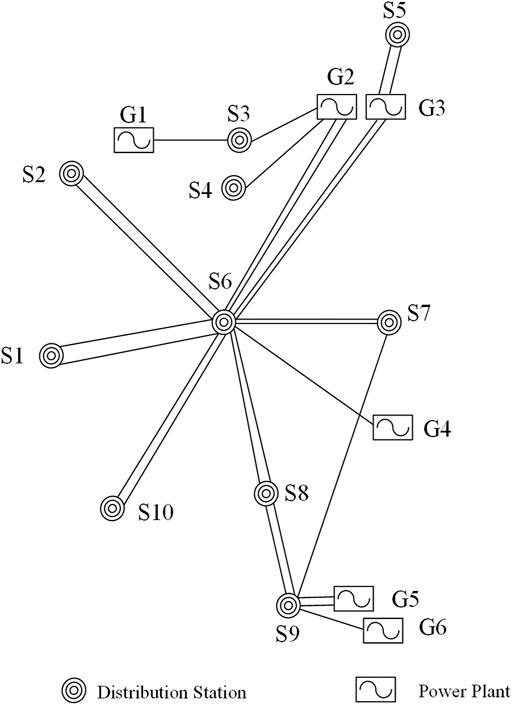
Unfortunately, the measurement datasets from real-world distribution networks are unlabeled. It means that it is not appropriate to use as a dataset for evaluating the proposed methods. Hence, we used the simulated datasets with artificial error. To verify the correctness and effectiveness of the proposed method, a test system (from a region in southwest China) is modeled in PSCAD/EMTDC to collect simulation data, as shown in Figure 9. The operational datasets contain 4000 samples (with a sampling rate of 40 frames per second) and four features (voltage magnitude V, current magnitude I, active power P, reactive power Q) for the distribution network. There are no outliers in these datasets. We added some synthetic errors to the simulated measurement data, in which outliers are generated and injected into the datasets using a normal-distributed random function as z = G(x). Table 2 shows that each bus data has 5–15% noise injected into it. As an example, if a data point has a voltage magnitude feature of 110kV, the noise is calculated as 110*105% + G(x). For each sample, three-fourths of the data is taken as input, and the trained algorithm predicts the rest of the real-time value.
Outliers Detection
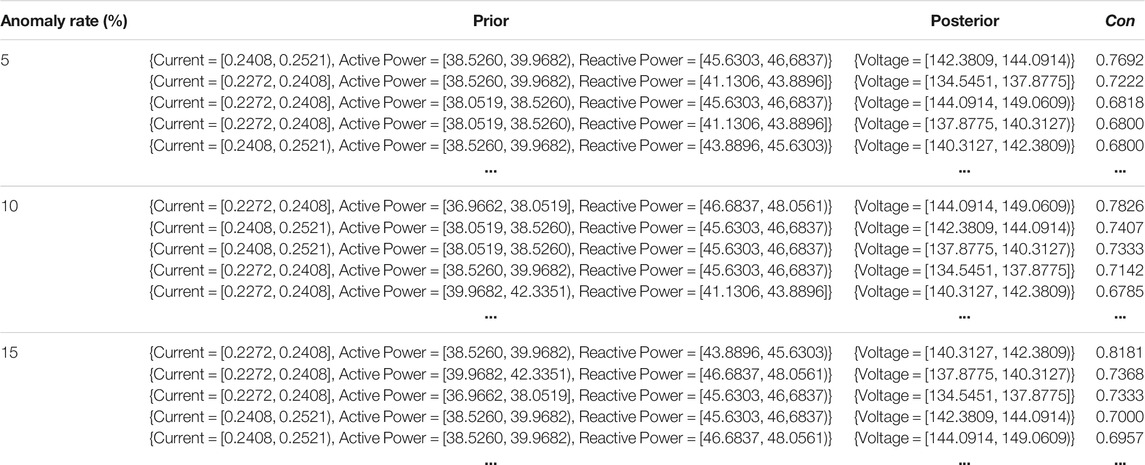
The discretization of the pre-processed datasets is performed using k-means clustering. The numerical attributes voltage magnitude, current magnitude, active power and reactive power are clustered into 8, 5, 6, and 5 categories, respectively. The clusters are selected based on the quality metric that is finally estimated. After data discretization, the Apriori algorithm generates the association rules in the test datasets with confidence greater than 60%. For each posterior feature, the association rules are generated separately. Then the rules are generated for prediction individuals. Some of these rules are shown in Table 3. If the observation is not within the interval determined by the rules, it will be marked as an outlier.
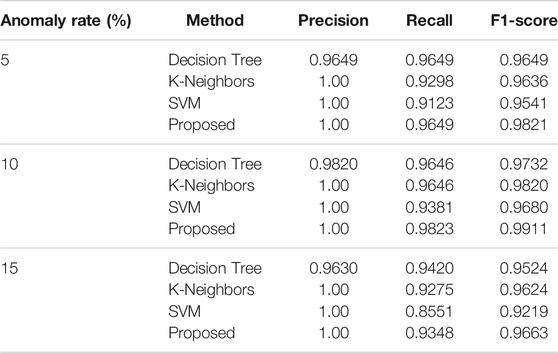
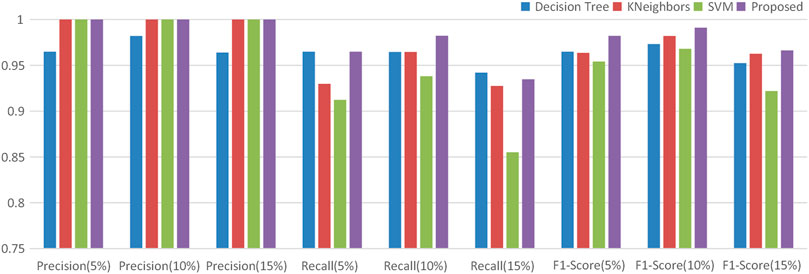
For evaluation, the proposed method is compared with other methods such as decision tree, k-neighbors, and SVM; all methods are using simulated datasets. The results are shown in Table 4 and Figure 10, and the comparison is based on Precision, Recall and F1-Score, respectively. For the Precision, considering the dataset with 5–15% noise, the above method have similar results, which means that the change of anomaly rate has little effect on the Precision. For the Recall, with the anomaly rate increases, the above method have worse results, which means that the change of anomaly rate mainly affects the Recall, resulting in the change of F1-score.
According to Table 4 and Figure 10, the result of decision tree is not satisfactory, which may mistakenly treats the normal data as an outlier. And for the datasets with highly contaminated (more than 15%), the SVM is leaving much to be desired, the Recall of it even less than 90%. For SVM, the reason may be that the high anomaly rate makes the training data extremely unbalanced. Therefore, in the training stage, the type of data may not meet the requirements of SVM, which limits the application of SVM in outliers detection. Under the same conditions, the Precision and Recall of k-neighbors is small than our proposed method. From the Figure 10, the proposed method play a good performance, whose F1-Score remains more than 96% for the datasets with different anomaly rate. The comparative case studies show that our proposed method outperformed the other three methods.
Outliers Repairing
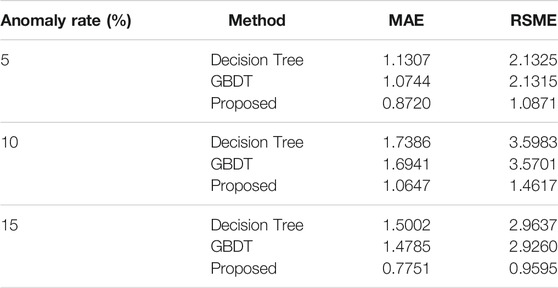
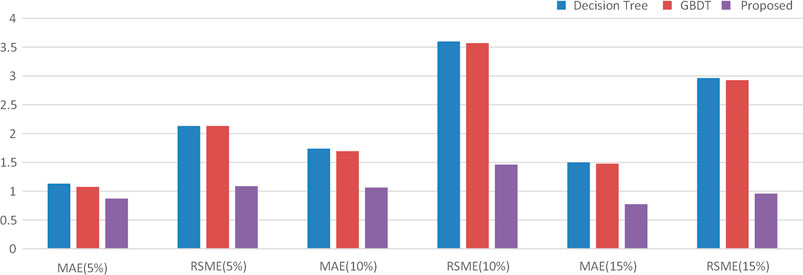
We employ two other widely-used data repairing methods to make a comparison, which includes decision tree and gradient boosting decision tree (GBDT). Table 5 and Figure 11 show the comparison result of the MAE and RSME at different anomaly rates. The accuracy indices of the decision tree and GBDT is close under different anomaly rates. And the GBDT algorithm is in a better position than the decision tree algorithm for each evaluation indices. The proposed method has been superior in all the accuracy indices in terms of aggregate, indicating model robustness.
In these cases, we only showed the result for detection and repairing the voltage, but the proposed method can also work for other features. In general, the proposed method outperforms the other methods in most cases. However, our approach’s performance may not be good in some situations, especially when used with little historical data. The reason for the problem is the insufficiency of association rules. The association rules can not include all the conditions, which cause by the value of confidence (more than 60%). One way to improve the accuracy of the proposed method is to increase the amount of historical data. So that more association rules can be generated to mine the correlation between features from the data.
Conclusion
In this paper, we developed a association rules-based method for outliers cleaning. To detect outliers, the association rules are generated from historical data in conjunction with DBSCAN, k-means and Apriori technique. For the outliers repairing, we took into account the repairing cost by a distance-based model. The Mahalanobis distance was used for constructing a data repairing cost function to reduce the errors. The proposed method achieves accurate detection as compared to decision tree, k-neighbors, and SVM algorithms. When outliers is taken into account, our model produces a smaller MAE and RSME, which has a better result than decision tree and GBDT. The results show that the work has a positive effect on improving data quality, which means our works could provide a reliable data base for distribution network planning and operation. Future work will focus on combining this approach with Spark parallel computing technology to improve the efficiency of the algorithm to satisfy the practical application needs of distribution network measurement outliers cleaning.
Data Availability Statement
The raw data supporting the conclusion of this article will be made available by the authors, without undue reservation.
Author Contributions
Conception and design of study: HK; Acquisition of data: MH, XH; Drafting the article: RQ, XH; Analysis and interpretation of data: HK, RQ, CG, and XM; Revising the article critically for important intellectual content: RQ, XM, and RD.
Funding
This work was supported by the Science and Technology Foundation of China Southern Power Grid (YNKJXM20191369).
Conflict of Interest
Author HK is employed by Yunnan Power Grid Co., Ltd., China.
The remaining authors declare that the research was conducted in the absence of any commercial or financial relationships that could be construed as a potential conflict of interest.
Publisher’s Note
All claims expressed in this article are solely those of the authors and do not necessarily represent those of their affiliated organizations, or those of the publisher, the editors and the reviewers. Any product that may be evaluated in this article, or claim that may be made by its manufacturer, is not guaranteed or endorsed by the publisher.
References
Alimardani, A., Therrien, F., Atanackovic, D., Jatskevich, J., and Vaahedi, E. (2015). Distribution System State Estimation Based on Nonsynchronized Smart Meters. IEEE Trans. Smart Grid 6 (6), 2919–2928. doi:10.1109/TSG.2015.2429640
Cai, Y., Xiao, X., Tian, H., Fu, Y., Wu, P., and He, H. (2021). A Multi-Source Data Collection and Information Fusion Method for Distribution Network Based on Iot Protocol. IOP Conf. Ser. Earth Environ. Sci. 651 (2), 022076. doi:10.1088/1755-1315/651/2/022076
Chen, J., Li, W., Lau, A., Cao, J., and Wang, K. (2010). Automated Load Curve Data Cleansing in Power Systems. IEEE Trans. Smart Grid 1 (2), 213–221. doi:10.1109/TSG.2010.2053052
Chen, K., Jiang, Y., Wu, Z., Zheng, N., Wang, H., and Hong, H. (2021). HTsort: Enabling Fast and Accurate Spike Sorting on Multi-Electrode Arrays. Front. Comput. Neurosci. 15, 657151. doi:10.3389/fncom.2021.657151
Chengyu, C., and Ying, X. (2016). Research and Improvement of Apriori Algorithm for Association Rules. Phys. Rev. A, 1–4. doi:10.1103/PhysRevA.94.042311
Chipade, V. S., Marella, V. S. A., and Panagou, D. (2021). Aerial Swarm Defense by StringNet Herding: Theory and Experiments. Front. Robot. AI 8, 640446. doi:10.3389/frobt.2021.640446
Esmalifalak, M., Liu, L., Nguyen, N., Zheng, R., and Han, Z. (2014). Detecting Stealthy False Data Injection Using Machine Learning in Smart Grid. IEEE Syst. J., 11, 1–9. doi:10.1109/JSYST.2014.2341597
Hayes, B. P., Gruber, J. K., and Prodanovic, M. (2018). Multi‐nodal Short‐term Energy Forecasting Using Smart Meter Data. IET Generation, Transm. Distribution 12 (12), 2988–2994. doi:10.1049/iet-gtd.2017.1599
Hu, X., Zhang, H., Ma, D., and Wang, R. (2021). Hierarchical Pressure Data Recovery for Pipeline Network via Generative Adversarial Networks. IEEE Trans. Automat. Sci. Eng. (99), 1–11. doi:10.1109/TASE.2021.3069003
Li, X., Cai, Y., and Zhu, W. “Power Data Cleaning Method Based on Isolation Forest and LSTM Neural Network,” in International Conference on Cloud Computing and Security, Haikou, China, 26 September 2018, 539–550. doi:10.1007/978-3-030-00018-9_47
Liu, J., Cao, Y., Li, Y., Guo, Y., and Deng, W. (2020). A Big Data Cleaning Method Based on Improved CLOF and Random Forest for Distribution Network. CSEE J. Power Energy Syst. (Early Access). doi:10.17775/CSEEJPES.2020.04080
Liu, S., Zhao, Y., Lin, Z., Ding, Y., Yan, Y., Yang, L., et al. (2019). Data-Driven Condition Monitoring of Data Acquisition for Consumers' Transformers in Actual Distribution Systems Using T-Statistics. IEEE Trans. Power Deliv. 34 (4), 1578–1587. doi:10.1109/TPWRD.2019.2912267
Liu, X., Zhang, X., Chen, L., Xu, F., and Feng, C. (2020). Data-driven Transient Stability Assessment Model Considering Network Topology Changes via Mahalanobis Kernel Regression and Ensemble Learning. J. Mod. Power Syst. Clean Energ. 8 (6), 1080–1091. doi:10.35833/MPCE.2020.000341
Maesschalck, R. D., Jouan-Rimbaud, D., and Massart, D. L. (2000). The Mahalanobis Distance. Chemometrics Intell. Lab. Syst. 50 (1), 1–18. doi:10.1016/S0169-7439(99)00047-7
Mccamish, B., Meier, R., Landford, J., Bass, R. B., Chiu, D., and Cotilla-Sanchez, E. (2016). A Backend Framework for the Efficient Management of Power System Measurements. Electric Power Syst. Res. 140 (nov), 797–805. doi:10.1016/j.epsr.2016.05.003
Nascimento, R. M. D., Oening, A. P., Marcilio, D. C., Alexandre, R. A., Júnior, E. P. R., and Schiochet, J. M. ““Outliers’ Detection and Filling Algorithms for Smart Metering Centers”,” in Proceedings of the 2012 IEEE PES Transmission and Distribution Conference and Exposition, Orlando, Florida, USA, May 2012, 7–10. doi:10.1109/tdc.2012.6281659
Nemati, H., Laso, A., Manana, M., Sant'Anna, A., and Nowaczyk, S. (2018). Stream Data Cleaning for Dynamic Line Rating Application. Energies 11 (8). doi:10.3390/en1101200710.3390/en11082007
Pei, Z., Li, F., and Bhatt, N. (2010). Next-generation Monitoring, Analysis, and Control for the Future Smart Control center. IEEE Trans. Smart Grid 1 (2), 186–192. doi:10.1109/TSG.2010.2053855
Qu, Z. Y., Wang, Y. W., Wang, C., Qu, N., and Yan, J. (2016). A Data Cleaning Model for Electric Power Big Data Based on Spark Framework. Adv. Sci. Technology 9, 137–150. doi:10.14257/astl.2016.121.74
Rauch, J. (2005). Logic of Association Rules. Appl. Intelligence 22 (1), 9–28. doi:10.1023/B:APIN.0000047380.15356.7a
Shi, X., Qiu, R., Ling, Z., Yang, F., Yang, H., and He, X. (2020). Spatio-Temporal Correlation Analysis of Online Monitoring Data for Anomaly Detection and Location in Distribution Networks. IEEE Trans. Smart Grid 11 (2), 995–1006. doi:10.1109/TSG.2019.2929219
Song, Y., Zhou, G., and Zhu, Y. (2013). Present Status and Challenges of Big Data Processing in Smart Grid. Power Syst. Technology 37 (4), 927–938. doi:10.3969/j.issn.1006-9402.2014.05.038
Thams, F., Venzke, A., Eriksson, R., and Chatzivasileiadis, S. (2020). Efficient Database Generation for Data-Driven Security Assessment of Power Systems. IEEE Trans. Power Syst. 35 (1), 30–41. doi:10.1109/TPWRS.2018.2890769
Thang, T. M., and Kim, J. The Anomaly Detection by Using DBSCAN Clustering with Multiple Parameters.” in Proceedings of the 2011 International Conference on Information Science and Applications, Jeju, Korea (South), April 2011, IEEE, 1–5. doi:10.1109/ICISA.2011.5772437
Waal, T. D., Pannekoek, J., and Scholtus, S. (2011). Handbook of Statistical Data Editing and Imputation. Hoboken, New Jersey, USA: John Wiley & Sons. ISBN:978-0-470-54280-4.
Wang, Q., Li, F., Tang, Y., and Xu, Y. (2019). Integrating Model-Driven and Data-Driven Methods for Power System Frequency Stability Assessment and Control. IEEE Trans. Power Syst. 34 (6), 4557–4568. doi:10.1109/TPWRS.2019.2919522
Wang, R., Sun, Q., Tu, P., Xiao, J., Gui, Y., and Wang, P. (2021). Reduced-order Aggregate Model for Large-Scale Converters with Inhomogeneous Initial Conditions in Dc Microgrids. IEEE Trans. Energ. Convers. 36 (99), 2473–2484. doi:10.1109/TEC.2021.3050434
Wang, Y., Chen, Q., Hong, T., and Kang, C. (2018). Review of Smart Meter Data Analytics: Applications, Methodologies, and Challenges. IEEE Trans. Smart Grid, 10, 1. doi:10.1109/TSG.2018.2818167
Yan, J. Z., Gao, Y., and Yu, Y. C. “Water Quality Data Outlier Detection Method Based on Spatial Series Features,” in Proceedings of the The 6th International Conference on Fuzzy Systems and Data Mining (FSDM), Xiamen, China, November 2020. doi:10.3233/FAIA200715
Yan, Y., Sheng, G., Chen, Y., Jiang, X., and Du, X. (2015). An Method for Anomaly Detection of State Information of Power Equipment Based on Big Data Analysis. Proc. Csee 35 (1), 52–59. doi:10.13334/j.0258-8013.pcsee.2015.01.007
Keywords: association rules, outliers cleaning, outliers detection, outliers repairing, measurement data, distribution network
Citation: Kuang H, Qin R, He M, He X, Duan R, Guo C and Meng X (2021) An Association Rules-Based Method for Outliers Cleaning of Measurement Data in the Distribution Network. Front. Energy Res. 9:730058. doi: 10.3389/fenrg.2021.730058
Received: 24 June 2021; Accepted: 27 September 2021;
Published: 13 October 2021.
Edited by:
Qiuye Sun, Northeastern University, ChinaReviewed by:
Zhijun Qin, Guangxi University, ChinaShunbo Lei, University of Michigan, United States
Xuguang Hu, Northeastern University, China
Copyright © 2021 Kuang, Qin, He, He, Duan, Guo and Meng. This is an open-access article distributed under the terms of the Creative Commons Attribution License (CC BY). The use, distribution or reproduction in other forums is permitted, provided the original author(s) and the copyright owner(s) are credited and that the original publication in this journal is cited, in accordance with accepted academic practice. No use, distribution or reproduction is permitted which does not comply with these terms.
*Correspondence: Risheng Qin, cWlucmlzaGVuZzIwMjBAMTI2LmNvbQ==
 Hua Kuang1
 Risheng Qin