 Long Shen
 Risheng Qin
- Electric Power Research Institute of Yunnan Power Grid Company Ltd., Kunming, China
With an increasing application of Phase Measurement Units in the smart grid, it is becoming inevitable for PMUs to operate in severe conditions, which results in outliers and missing data. However, conventional techniques take excessive time to clean outliers and fill missing data due to lacking support from a big data platform. In this paper, a flexible ensemble algorithm is proposed to implement a precise and scalable data clean by the existing big data platform “Apache Spark.” In the proposed scheme, an ensemble model based on a soft voting approach utilizes principal component analysis in conjunction with the K-means, Gaussian mixture model, and isolation forest technique to detect outliers. The proposed scheme uses a gradient boosting decision tree for each extracted feature of PMUs for the data filling process after detecting outliers. The test results demonstrate that the proposed model achieves high accuracy and recall by comparing simulated and real-world Phase measurement unit data using the local outlier factor algorithm and Density-Based Spatial Clustering of Application with Noise (DBSCAN). The mean absolute error, root mean square error and R2-score criteria are used to validate the proposed method’s data filling results against contemporary techniques such as decision tree and linear regression algorithms.
Introduction
Due to the increasing demand for accurate control and management in smart grids, many advanced online monitoring devices have been installed and provide abundant operating data resources using Phase Measurement Units (PMUs). The data preprocessing is an important step that transforms the raw operating data used in the load forecasting model, user clustering tool, equipment maintenance, and energy theft detection technique. The outcome of data preprocessing has a significant impact on the data modelling process. For instance, a prediction model fed by a raw dataset with noise and bad data will be inefficient and cause inaccuracy. PMU failures, such as communication errors and noises, cause irregular packet data and asymmetric magnitude spikes, which are particularly problematic for smart grid applications. As a result, PMUs’ data cleaning algorithm must maintain high speed and sensitivity to faulty data in order to deliver a highly reliable data mining model. However, designing a data cleaning algorithm that balances high speed and sensitivity is a technological challenge that needs to be addressed.
Data cleaning technologies are a heavily studied domain of data statistics and machine learning. The whole process of extensive data cleaning is illustrated as outlier detection and data filling. The outliers which do not follow the main of the data may be produced by inducing random errors and faulty measurements (Zhao et al., 2019). For outlier detection, with the recent advancement in machine learning techniques, both unsupervised and supervised methods have been investigated for better accuracy, speed, and computation cost. In supervised models, such as one-class support vector machine (SVM) (Ma and Perkins, 2003), decision forest (Reif et al., 2008), convolutional neural network (Ren et al., 2020), and the long short-term memory network (LSTM) (Wu et al., 2020) can achieve excellent performance by learning massive labeled data. However, labeling massive data is very time-consuming and needs great manual effort, which limits its application at an industrial scale. In comparison, unsupervised outlier detection does not need labeling and can achieve good accuracy in most cases. Even though some of their results are poor in complicated scenarios, unsupervised methods, namely Kmeans, Gaussian Mixture Model (GMM), CURE (Lathiya and Rani, 2016), Density-Based Spatial Clustering of Application with Noise (DBSCAN) (Manh and Kim, 2011), local outlier factor (LOF) (Pokrajac et al., 2007) and isolation forest (iForest) (Liu et al., 2008) are extensively used in real-world scenarios because they are easy to implement. Subsequently, there have been several attempts to use an unsupervised model to clean PMU data in the smart grid. For example, in (Mahapatra et al., 2016), principal component analysis (PCA) is used to detect outliers in PMU measurements. Likewise, PCA is incorporated with an artificial neural network (ANN) to improve detection accuracy (Mahapatra et al., 2017).
Meanwhile, researchers have been drawn to the drawbacks of stand-alone approaches, which produce inconsistent results in complex situations. As a result, various ensemble-based models have been designed to address deficiencies in real-world applications and improve their performance. For example, to improve accuracy, the local outlier factor (LOF) algorithm, correlation outlier probabilities, and single-linkage-based outlier detection methods are used (Kummerow et al., 2018). The DBSCAN, Chebyshev, and linear regression models are combined to predict PMU outliers (Zhou et al., 2019), but the approach cannot distinguish abnormal and regular operations. The Kmeans and local outlier probability methods are used to identify various types of anomalies based on the iForest anomaly score, such as fault detection, transient disturbance, etc. (Khaledian et al., 2020). In complex scenarios, these ensemble methods can present improved performance. However, the performance of extremely big data sets that may be computationally analyzed to discover patterns is rarely mentioned.
With the development and deployment of PMUs, the size of received data risen exponentially for a data center. (Khan et al., 2014; Yang et al., 2015). When dealing with vast amounts of data, conventional data processing methods can take days or weeks, which is insufficient time for data analysis. As a result, to ensure successful data processing, some attempts focus on big data technology. An adaptive hoeffding tree with a transfer learning approach is proposed (Mrabet et al., 2019) to detect the PMU data’s events. In another attempt, a feature generation system is well-designed via Apache Spark core, which successfully fits 400 PMUs from the North American power grid (Kumar et al., 2021). A streaming interface based on Apache Spark for the synchrophasor data stream is investigated (Menon et al., 2018). Despite this, the integration and expansion of detection algorithms on existing big data platforms have limitations.
Furthermore, data filling is often addressed in publications as an important step in avoiding missing values. Statistic techniques and machine learning methods can complete the data filling processing. For statistic techniques, an improved cubic spline interpolation method is used to recover the missing data in the transient state and static state of power systems (Yang et al., 2019). A feature component extraction-based approach is proposed to recover a single channel data of PMU, which accounts for more details of the data waveform (Gao et al., 2016), but the relationship between PMUs is ignored. By contrast, an extreme learning machine and a random vector functional link model are introduced to produce good filling results (Li et al., 2019). Besides, artificial neural network technologies are also developed to achieve a good performance against complex scenarios. For example, a least-squares generative adversarial network is adopted to generate adequate monitoring data (Wang et al., 2021). Except for developing a new method, the researchers utilize the potential information in power systems’ features to improve the accuracy, such as network topologies and operation mode. In (Ren and Xu, 2019), the network topologies are considered in a recovery program based on a generative adversarial network (GAN). Although the importance of topology in data recovery processing is investigated, publications seldom cover the whole data cleaning process, including outlier detection and data recovery.
Traditional bad data detection algorithms may underperform when dealing with complex scenarios and take a long time to run without big data technologies. Our motivation is to investigate how to apply the complete data cleaning process of PMUs, including outlier detection and data filling, to existing big data platforms to achieve expected performance. A flexible ensemble approach for data cleaning is given in this study to adapt to the failure of a single technique. In outliers detection, we adopt an ensemble method that includes three sub-detectors, the Kmeans combined with PCA, GMM, and iForest. A flexible voting mechanism then aggregates their results, and the aggregation is used to label outliers. After the outliers detection, the Gradient Boost Decision Tree (GBDT) is used and well designed to recover missing data and observed outliers. Apache Spark platform, Spark streaming system, Kafka and Hadoop distributed file system is selected to perform and test the proposed algorithm with massive datasets. In more detail, the contributions of this paper are listed as follows. First, a flexible data cleaning algorithm uses Apache Spark to automate the identification of outliers and retrieve missing data. Second, we propose a flexible voting mechanism for outlier detection to aggregate the outputs of PCA-Kmeans, GMM, and iForest in complex cleaning scenarios.
Problem Descriptions
The Framework of Proposed Data Cleaning via Spark
Figure 1 depicts a hierarchical data-cleaning framework proposed in this paper. The presented data cleaning algorithm is deployed in the Spark and Hadoop distributed file systems. Master nodes and worker nodes are included in the system (2 nodes, as shown in Figure 1). When the proposed algorithm interacts with the master node, the master node asks the cluster manager for computing resources. The cluster manager responds by allocating jobs to worker nodes, and the worker nodes perform tasks based on PMU data.
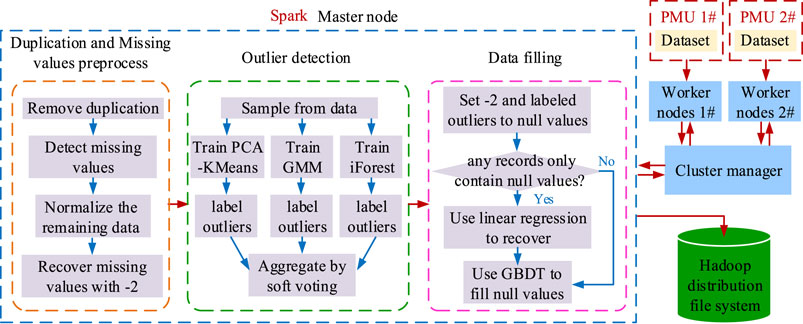
FIGURE 1. The framework of data cleaning in Spark.
The proposed data cleaning process is divided into three stages, as shown in Figure 1. The first step is to prepare the data. In this stage, the PMU data is uploaded to the worker nodes, preparing them for the next cleaning process. The cleaning procedure is preceded by a preprocess duplication and missing values. We remove duplication data and then find missing values. In this condition, the remaining data with noises are normalized. After that, the missing values labelled with “−2” and the normalized data are combined to form the dataset. Choosing −2 is to distinguish missing values from the normalized data (Liu et al., 2020). In the second stage, we randomly sample from the dataset to train PCA-KMeans, GMM, and iForest algorithms to predict outliers using a soft voting mechanism. Note that outliers include noise data. In the third stage, the outliers and missing values with “−2” are replaced with null values due to their abnormal features. If any record only contains null values, linear regression is used to recover this record.
Outlier Detection
In general, outlier detection algorithms should be unresponsive to normal data, resilient and robust to outliers, and capable of computation. However, only a few algorithms can meet the requirement in most cases, and the algorithm’s output can jeopardize the data analysis credibility. To be more specific, 1) the algorithm may be insensitive to one or more types of outliers, such as bad data or missing values. 2) the model with adjustable parameters generates a high computational cost when cleaning a large dataset and can result in overfitting. 3) The algorithm may be vulnerable to standard power system manual operations, such as network topology changes.
To demonstrate more clearly, we take a section of PMU data shown in Figure 2, where five points are identified as outliers and highlighted in the figure. The state-of-the-art detecting algorithms, Kmeans, GMM, iForest, DBSCAN, and LOF, are compared, with their parameters tuned. Most of the algorithms miss two outliers due to the topology change. However, only a small number of algorithms are capable of detecting all outliers.
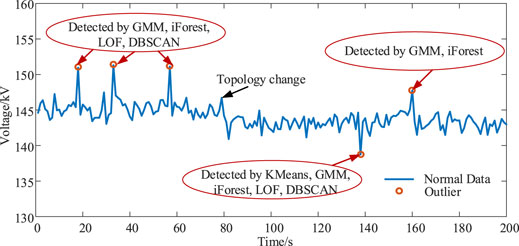
FIGURE 2. The framework of data cleaning in Spark.
To overcome these challenges, combining different findings from different detectors is necessary. The combining model can take advantage of every detector by aggregation and coherently achieve better performance. Its aggregation mechanism is the key to utilize the benefits fully. This paper investigates a flexible voting aggregation mechanism for the ensemble method to identify outliers.
Furthermore, in an ensemble algorithm, sub-detector selection is a critical step. In theory, any outlier detectors can be used for the ensemble, but since the compute resource is limited, the sub-detector number is limited. In the sub-detector selection, the detectors based on different methodologies are welcomed. In this paper, the density-based method, iForest, is chosen because of its high scalability and low memory use. The clustering-based methods, Kmeans and GMM, are used since the Kmeans ease of implementation in distributed computing. The GMM is selected because of its fuzzy clustering, which provides the probability of data points belonging to each cluster and is more flexible than Kmeans. While starting the cleaning process, three detectors are trained by the sampling data and then process the entire data separately and simultaneously using Spark’s pipeline mechanism which can improve computing efficiency.
Data Filling
Standard manual operations, such as network topology changes and line maintenance, often occur and cause PMU data to drift. Some filling algorithms, on the other hand, ignore the information and predict a significant error. As a result, such information should be considered when training a filling algorithm.
Furthermore, the filling algorithm’s accuracy should be given more consideration. As a famous filling algorithm, GBDT can reach a high accuracy than other filling algorithms. The GBDT is a classic ensemble learning method that creates a strong regression tree by combining weak regression trees (typically train classification and regression tree (CART)). Thereupon, GBDT handles nonlinear relationships well and achieves high accuracy in fragmented datasets. Therefore, we adopt the GBDT method against missing data packets.
Ensemble Modeling for Outlier Detection
Data Preparation
In this subsection, an ensemble method based on sub-detector PCA-Kmeans, GMM, and the iForest algorithm is proposed in order to obtain a more accurate detection of an outlier. To clearly illustrate the process, let
PCA-Kmeans Detector
The Kmeans is a classical classifying method that marks the data into several clusters. By analyzing and classifying the clusters, the clusters of outliers can be detected. However, given the potential vulnerability of the Kmeans on high dimensional data, the PCA approach is combined with Kmeans to reduce the dimension of the data, called the PCA-Kmeans detector. The PCA approach is one of the most popular dimensionality reduction techniques (Mahapatra et al., 2017), aiming to find an orthogonal subspace whose basis vectors correspond to the maximum-variance directions in the original space. By using the output of the PCA model, the Kmeans method can achieve better accuracy. For clarity, let take
where
After labeling each feature set in every iteration, the centroid in each step will be updated by Eq. 2.
Meanwhile, when the centroid difference in an adjacent iteration is less than
where
Gaussian Mixture Model-Based Detector
The GMM is a useful algorithm for detecting outliers based on a density function (De la Torre et al., 2012). Unlike Kmeans, the data is assumed to be modelled by several Gaussian density functions in this method. Each Gaussian density in the kth is given by a Gaussian function Eq. 4. The GMM model is the weighted sum of several Gaussian densities, illustrated by Eq. 5.
where
To determine the parameters such as π, μ, σ of the Gaussian functions, the maximum likelihood function given by Eq. 6 is used for help by using the Expectation-Maximization (EM Algorithm) (De la Torre et al., 2012). The log-likelihood is used as Eq. 7 to determine if a data point belongs to the Gaussian functions measured earlier. The GMM’s output is then assigned the weight of each data point to simple Gaussian density.
Zki contains 0 or 1 depending on whether the data di belongs to Gaussian function k.
The mean log-likelihood criterion is then used to determine if the incoming data in the next window matches with the current GMM or not (Diaz-Rozo et al., 2018); it is calculated using Eq. 8.
Isolation Forest Detector
In general, anomalies are less common than normal findings and have different values. The Isolation Forest algorithm takes advantage of this feature to measure a dataset’s anomaly ratings, which are then used to distinguish outlier points (Liu et al., 2008). In this subsection, isolation trees (iTree) and path lengths are introduced.
For clarification, let us take a random binary tree as an example; partitioning observations is repeated recursively until all the observations are isolated. As shown in Figure 3, the iTree that uses a binary tree structure is proposed to isolate observations.
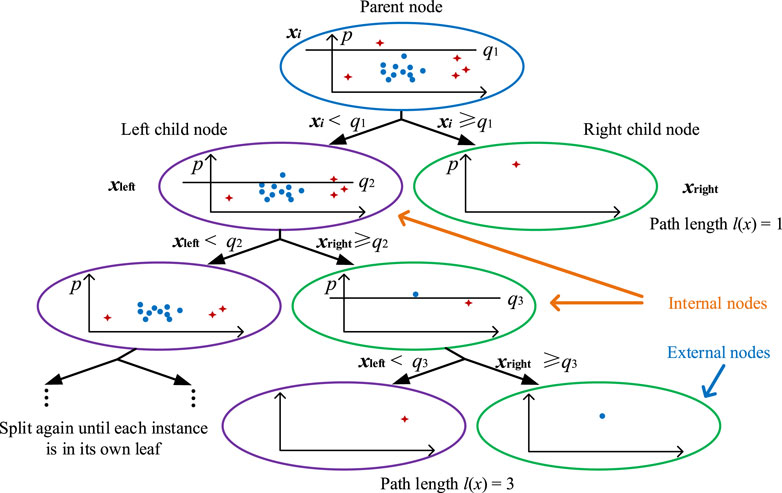
FIGURE 3. The mechanism of iTree.
Definition 1 (iTree): iTree is a random binary tree with no more than two children per node. As shown in Figure 3, internal nodes have exactly two children, while external nodes have none. Each internal node has a randomly chosen function q and a split value p, resulting in the node’s split into two child nodes according to the condition q < p. This process is repeated until all of the nodes have just one case.
We denote a training dataset with N instances by X = {x1, … , xN}. The subsampled set
Anomalies are isolated closer to the root node of an iTree and have short path lengths, as seen in Figure 3. On the other hand, standard points are isolated at the deep end of an iTree and therefore have long path lengths. As a result, anomaly scores are a function of path lengths. The length of the route is determined as follows.
Definition 2 (Path length): l(x) is the number of edges between the root node and the external node corresponding to an instance x in the iTree.
For the same dataset X, we can build multiple iTrees that are constructed by randomly selected features, split values, and subsampled datasets. To aggregate the results of iTrees and calculate the anomaly score, we first introduce an average path length
where e is the Euler constant; l(x) is the path length of each component x in the instance
Soft Voting Mechanism
To fully utilize the advantages of sub-detectors, a soft voting mechanism is used to combine the sub-detectors predictions and increase robustness to complex scenarios. In particular, compared to the outlier probability given by GMM and iForest, the prediction of Kmeans is “hard” and has less elasticity against the scenario because it only gives a cluster label to each data point. The Kmeans prediction should be combined with another “soft” approach with a similar mechanism to deal with the poor results. For example, GMM, a soft clustering method, is used to multiple the Kmeans results marked as
SKmeans, PGMM, and PiForest are the output of the PCA-KMeans, GMM, and iForest algorithms. SKmeans is a binary variable, and SKmeans = 0 addresses the normal data, while abnormal data is annotated as 1. PGMM is the probability of outliers for an observation, which is closed to 1, meaning outlier. PiForest is the anomaly score of the data point.
Data Filling Process and Data Cleaning Function
Gradient Boosting Decision Tree-Based Filler
As discussed in Problem Descriptions, data filling is an important part of data cleaning, and it is a regression problem by definition. For PMU data, it is possible to have missing values for each feature, which presents as single or continuous types in a dataset. To tackle different types of missing values, the GBDT model is trained for each feature of PMU data, respectively. In case of single missing value occurs in a feature, the GBDT model can easily fill it using the other features as input. By contrast, when facing the continuous missing values loss of all features, the topology is the first to be recovered using the last instance. Then, the variables strongly associated with time—such as active power—are recovered by the linear regression method. Next, the other features are retrieved by the GBDT method.
The GBDT is used as a filler and to model an approximation function f(X) of a specified result
The optimization can be effectively solved by a gradient descent algorithm, and the approximation function can be updated using the results of every iteration, illustrated via Eq. 14. In each iteration, the GBDT model uses the results in the last iteration and a classification and regression tree (CART), which is updated as Eq. 14. Especially in the initial iteration, f0(x) = 0.
where M is the length of iterations. m is the serial number of iteration.
By repeating the above interactive steps, the output of GBDT can be obtained by the final iteration.
The Proposed Processing of Data Cleaning
A flowchart of the proposed strategy is shown in Figure 4. Step 1: after eliminating duplication and detecting missing values, normalize the remaining data. Step 2: replace missing values with ‘-2’ and train PCA-KMeans, GMM, and iForest algorithms by sampling the normalized data. Step 3: detect the entire data by Eqs. 1–10 and combine PCA-KMeans, GMM, and iForest to eliminate outliers via a soft voting approach. Step 4: if any record only contains null values, using linear regression recovers the time-dependent features of records and then employing GBDT recovers the entire data. Step 5: otherwise, GBDT is used to recover the entire data.
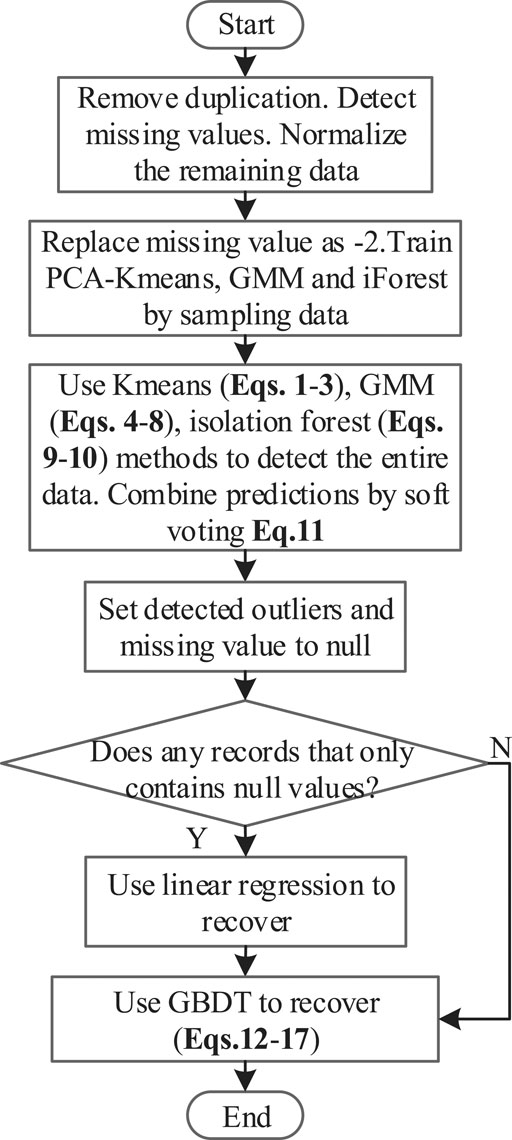
FIGURE 4. The flowchart of the proposed algorithm.
Numerical Simulation
Experimental Settings
In this simulation, the detailed experimental evaluation is presented with Spark 2.4.0, Kafka 0.10.1.0, Hadoop 2.4.7 under Ubuntu 16.04 operation system. Three scenarios are presented to demonstrate the feasibility of the proposed process. The outlier identification function of the proposed approach is firstly evaluated by an industrial dataset from the reference (Liu et al., 2008), considering precision and recall metrics. Secondly, the outlier detection function is examined using simulated PMU data and real PMU data. Finally, the mean absolute error and the root mean squared error are employed to evaluate the precision of the proposed approach in recovering data compared with the linear regression algorithm and the decision tree approach.
Outlier Detection of the Public Industrial Dataset
The proposed algorithm (FEA) is recommended in this scenario for detecting real-world datasets from outlier detection datasets and generating a score. Considering Satellite, Shuttle, Breastw, and Http datasets (Liu et al., 2008) illustrated in Table 1, a confusion matrix, which includes false positive (Fp), false negative (Fn), true positive (Tp), and true negative (Tn), is used to validate the performance of the proposed algorithm. Following that, we can use Eqs. 18, 19 to measure the recall and precision ratios for further discussion.
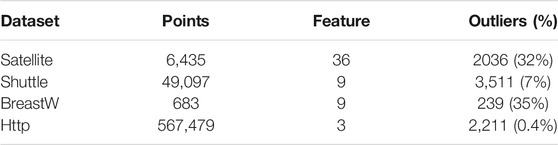
TABLE 1. The details of outlier detection datasets.
The number of outliers detected as outliers is TP, and the number of normal data detected as normal data is TN. At the same time, FP stands for the number of normal data points that have been identified as outliers. The number of outliers detected as normal data is given by FN.
As shown in Table 2, the proposed FEA can achieve good performance while cleaning all types of data with large and highly polluted information, although this recall is about 82% for Satellite.
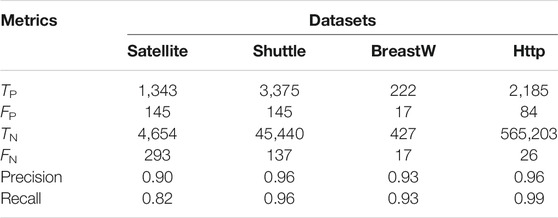
TABLE 2. The results of the proposed method with outlier detection datasets.
Outlier Detection of Synthetic PMU Dataset
Using PMU operational data, the proposed method and other methods are compared in this subsection. In PSCAD/EMTDC, simulation data is produced using a model IEEE 14-bus network system with PMUs installed on bus-2,6,9, as shown in Figure 5. The length of operation data of PMU is 4,000 points with a sampling rate of 40 frames per second. The data is polluted by outliers and missing values using a Gaussian-distributed random function as z = G(x). Table 3 shows that each PMU data has 5 percent -15 percent noise and 5 percent -15 percent missing values injected into it. As an example, if a data point has a voltage feature of 35kV, the noise is calculated as 35*105% + G(x). As illustrated in Figure 6, one segment of the synthetic data is added by a noise-5% PMU data.
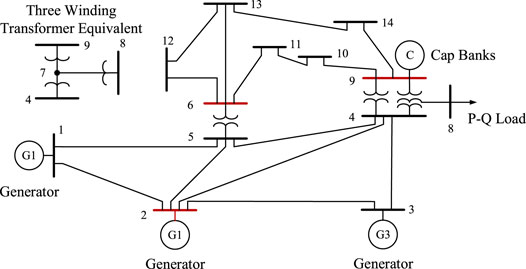
FIGURE 5. The testing IEEE 14-bus system.
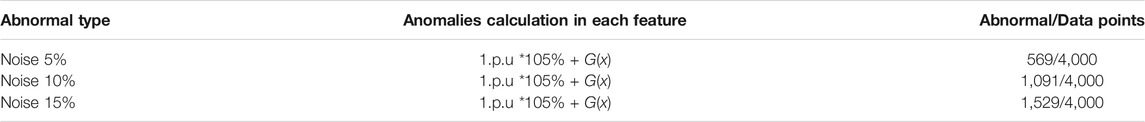
TABLE 3. The noises injection of simulated scenarios.
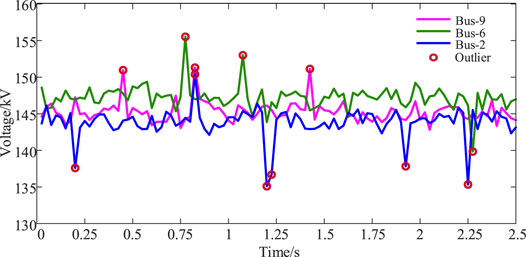
FIGURE 6. The segment of synthetic noise-5% PMU data.
Changing the ratios of white noises and null values, the proposed FEA can maintain an expected performance, as shown in Table 4. For instance, considering the dataset with 15% noise, DBSCAN and FEA have similar results. As illustrated in Figure 7A, the normal and abnormal data are used to predict the outliers. As shown in Figure 7B, DBSCAN has a little larger cover of normal data than FEA does, which means that DBSCAN can achieve slightly better precision than FEA.
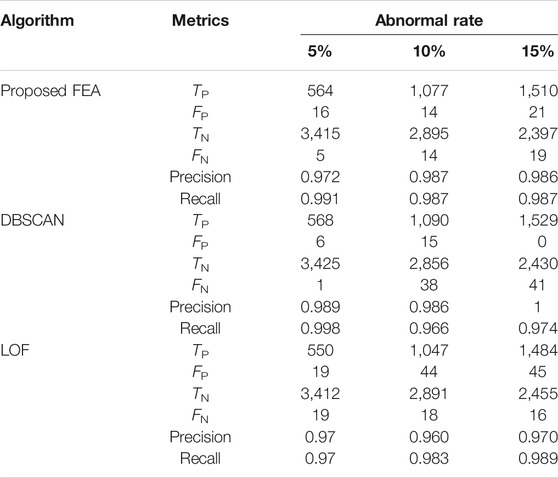
TABLE 4. The outlier detection results in simulated scenarios.
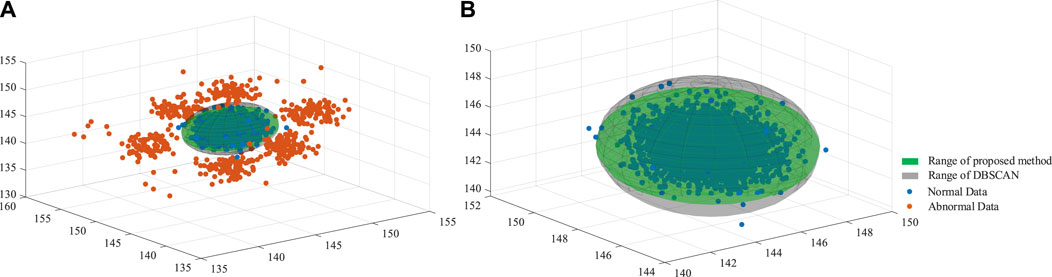
FIGURE 7. (A) The distribution of normal and abnormal data in noise-5% (B) The range of proposed FEA and DBSCAN.
Following that, Figure 8A illustrates the range of sub-detectors used in our ensemble method. The details indicate that the KMeans range is the largest but includes some abnormal data, indicating that this method detects more outliers than normal data (FN), as shown in Figure 8B iForest has a smaller range than KMeans but perfectly covers all normal data. GMM has a narrow range and may predict more normal data as outliers (FP). By combining the advantages of each sub-detector, the FEA can achieve a normal range size while maintaining a high level of outlier detection performance.
FIGURE 8. (A) The distribution of noise-5% data with a range of different detectors (B) The range of proposed FEA and GMM, KMeans and iForest.
Outlier Detection of Real-World PMU Dataset
For performance estimation, real-world PMU data from a specific region in southwest China is used, and domain experts label outliers and missing values in the dataset. FEA can detect outliers and missing values, as shown in Figure 9. As presented in Table 5, the FEA can efficiently clean data with a precision of 99.1 percent and a recall of 95.9 percent. The good performances in real-world PMU data again verify the proposed FEA’s effectiveness.
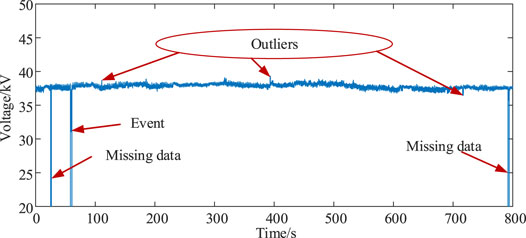
FIGURE 9. A feature of real-world PMU data.
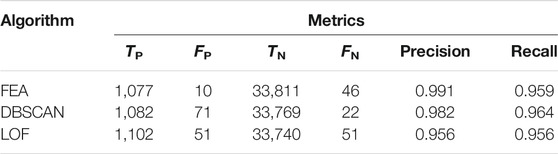
TABLE 5. The outlier detection results in real-world scenarios.
Data Recovery of Real-World PMU Dataset
The linear regression, decision tree, and GBDT algorithms are introduced in this sub-section to complete the regression training process and fill null values with real-world PMU data. The root squared measurement error (RSME), mean absolute error (MAE), and R2-score are respectively calculated to evaluate the performance of the proposed approach in Eqs. 20–22.
where N is the size of data, yi is data point, H(xi) is the prediction with the input xi, and
As illustrated in Table 6, the performance of the proposed FEA-GBDT is superior to that of the other algorithms because of lower MAE and RMSE and larger R2-score.

TABLE 6. The data recovery results in real-world scenarios.
Conclusion
This paper proposes a modular ensemble-based cleaning approach for PMUs to achieve outlier detection and data filling using big data technologies. The proposed approach considers and aggregates the advantages of different methods such as KMeans, GMM, and iForest for outlier identification, allowing it to perform better. Missing values due to system error are also investigated and retrieved using the proposed process. Notably, computational results show that the proposed approach can effectively process outliers, is resilient to a high percentage of bad data, and performs well with a large dataset. The proposed method achieves accurate prediction as compared to DBSCAN and LOF algorithms. The proposed approach, in particular, can handle large datasets deployed on Hadoop and Spark systems. When data filling is taken into account, our model produces a lower mean absolute error and root squared measurement error and R2-score. Furthermore, our algorithm results show that using big data technology, a single detector’s poor performance and low efficiency can be replaced by a high-efficiency ensemble approach. PMUs’ outlier detection and data filling functions have the potential to clean and use data in real-time for fault detection, data processing, and prediction.
Some factors, such as communication infrastructure and system maintenance, may have an impact on the proposed algorithm’s efficiency. As a result, our future work will focus on taking into account the aforementioned considerations and refining the proposed approach in these scenarios.
Data Availability Statement
The raw data supporting the conclusions of this article will be made available by the authors, without undue reservation.
Author Contributions
Conception and design of study: LS Acquisition of data: ML, XH Drafting the article: RQ, XH Analysis and interpretation of data: LS, RQ, ML, CG Revising the article critically for important intellectual content: RQ, XM, RD.
Funding
This work was supported by the Science and Technology Foundation of China Southern Power Grid (YNKJXM20191369).
Conflict of Interest
Authors LS, XH, ML, RQ, CG, XM, and RD were employed by the company Electric Power Research Institute of Yunnan Power Grid Company Ltd.
Publisher’s Note
All claims expressed in this article are solely those of the authors and do not necessarily represent those of their affiliated organizations, or those of the publisher, the editors and the reviewers. Any product that may be evaluated in this article, or claim that may be made by its manufacturer, is not guaranteed or endorsed by the publisher.
References
De la Torre, F. (2012). A Least-Squares Framework for Component Analysis. IEEE Trans. Pattern Anal. Mach. Intell. 34 (6), 1041–1055. doi:10.1109/TPAMI.2011.184
Diaz-Rozo, J., Bielza, C., and Larrañaga, P. (2018). Clustering of Data Streams with Dynamic Gaussian Mixture Models: An IoT Application in Industrial Processes. IEEE Internet Things J. 5 (5), 3533–3547. doi:10.1109/JIOT.2018.2840129
Gao, P., Wang, M., Ghiocel, S. G., Chow, J. H., Fardanesh, B., and Stefopoulos, G. (2016). Missing Data Recovery by Exploiting Low-Dimensionality in Power System Synchrophasor Measurements. IEEE Trans. Power Syst. 31 (2), 1006–1013. doi:10.1109/TPWRS.2015.2413935
Khaledian, E., Pandey, S., Kundu, P., and Srivastava, A. K. (2021). Real-Time Synchrophasor Data Anomaly Detection and Classification Using Isolation Forest, KMeans, and LoOP. IEEE Trans. Smart Grid 12, 2378–2388. IEEE Trans. Smart Grid (Early Access)in press. doi:10.1109/TSG.2020.3046602
Khan, M., Li, M., Ashton, P., Taylor, G., and Liu, J. (2014). “Big Data Analytics on PMU Measurements,” in 2014 11th International Conference on Fuzzy Systems and Knowledge Discovery (FSKD). Xiamen, China. August 19-21, 2014, 715–719.
Kumar, V. S., Wang, T., Aggour, K. S., Wang, P., Hart, P. J., and Yan, W. (2021). “Big Data Analysis of Massive PMU Datasets: A Data Platform Perspective,” in 2021IEEE Power & Energy Society Innovative Smart Grid Technologies Conference (ISGT). Washington, DC, USA. February 17-20, 2021, 1–5.
Kummerow, A., Nicolai, S., and Bretschneider, P. (2018). “Ensemble Approach for Automated Extraction of Critical Events from Mixed Historical PMU Data Sets,” in 2018 IEEE Power & Energy Society General Meeting (PESGM). Portland, OR. August 20-25, 2018, 1–5.
Lathiya, P., and Rani, R. (2016). “Improved CURE Clustering for Big Data Using Hadoop and Mapreduce,” in 2016 International Conference on Inventive Computation Technologies (ICICT). Coimbatore, India. August 26-272016, 1–5.
Li, Q., Xu, Y., Ren, C., and Zhao, J. (2019). “A Hybrid Data-Driven Method for Online Power System Dynamic Security Assessment with Incomplete PMU Measurements,” in 2019 IEEE Power & Energy Society General Meeting (PESGM). Atlanta, GA, USA. August 4-8, 2019, 1–5.
Liu, F. T., Ting, K. M., and Zhou, Z. (2008). “Isolation Forest,” in 2008 Eighth IEEE International Conference on Data Mining, December 15-19, 2008. Pisa, Italy, 413–422.
Liu, J., Cao, Y., Li, Y., Guo, Y., and Deng, W. (2020). A Big Data Cleaning Method Based on Improved CLOF and Random Forest for Distribution Network. CSEE J. Power Energ. Syst. 1 –10. doi:10.17775/CSEEJPES.2020.04080
Ma, J., and Perkins, S. (2003). “Time-series novelty Detection Using One-Class Support Vector Machines,” in Proceedings of the International Joint Conference on Neural Networks. PortlandUSA: OR. July 20-24, 2003, 1741–1745.
Mahapatra, K., Chaudhuri, N. R., and Kavasseri, R. (2016). “Bad Data Detection in PMU Measurements Using Principal Component Analysis,” in 2016 North American Power Symposium (NAPS), September 18-20, 2016. Denver, CO, USA, 1–6.
Mahapatra, K., Chaudhuri, N. R., and Kavasseri, R. (2017). “Online Bad Data Outlier Detection in PMU Measurements Using PCA Feature-Driven ANN Classifier,” in 2017 IEEE Power & Energy Society General Meeting (PESGM). July 16-20, 2017. Chicago, IL, USA, 1–5.
Manh, T. T., and Kim, J. (2011). “The Anomaly Detection by Using DBSCAN Clustering with Multiple Parameters,” in 2011 International Conference on Information Science and Applications. April 26-29, 2011. Jeju, Korea (South), 1–5.
Menon, V. K., Variyar, V. S., Soman, K. P., Gopalakrishnan, E. A., Kottayil, S. K., Almas, M. S., et al. (2018). “A Spark™ Based Client for Synchrophasor Data Stream Processing,” in 2018 International Conference and Utility Exhibition on Green Energy for Sustainable Development (ICUE). Phuket, Thailand. October 1-32018, 1–9.
Mrabet, Z. E., Selvaraj, D. F., and Ranganathan, P. (2019). “Adaptive Hoeffding Tree with Transfer Learning for Streaming Synchrophasor Data Sets,” in 2019 IEEE International Conference on Big Data (Big Data), December 9-12, 2019. Los Angeles, CA, USA, 5697–5704.
Pokrajac, D., Lazarevic, A., and Jan, L. L. (2007). “Incremental Local Outlier Detection for Data Streams,” in 2007 IEEE Symposium on Computational Intelligence and Data Mining. March 1-April 5.2007. Honolulu, HI, USA, 504–515.
Reif, M., Goldstein, M., Stahl, A., and Breuel, T. M. (2008). “Anomaly Detection by Combining Decision Trees and Parametric Densities,” in 2008 19th International Conference on Pattern Recognition, December 8-11, 2008. Tampa, FL, USA, 1–4.
Ren, C., and Xu, Y. (2019). A Fully Data-Driven Method Based on Generative Adversarial Networks for Power System Dynamic Security Assessment with Missing Data. IEEE Trans. Power Syst. 34 (6), 5044–5052. doi:10.1109/TPWRS.2019.2922671
Ren, H., Hou, Z. J., Vyakaranam, B., Wang, H., and Etingov, P. (2020). Power System Event Classification and Localization Using a Convolutional Neural Network. Front. Energ. Res. 8, 607826–607837. doi:10.3389/fenrg.2020.607826
Wang, C., Cao, Y., Zhang, S., and Ling, T. (2021). A Reconstruction Method for Missing Data in Power System Measurement Based on LSGAN. Front. Energ. Res. 9, 651807–651820. doi:10.3389/fenrg.2021.651807
Wu, D., jiang, Z., Xie, X., Wei, X., Yu, W., and Li, R. (2020). LSTM Learning with Bayesian and Gaussian Processing for Anomaly Detection in Industrial IoT. IEEE Trans. Ind. Inf. 16 (8), 5244–5253. doi:10.1109/TII.2019.2952917
Yang, B., Yamazaki, J., Saito, N., Kokai, Y., and Xie, D. (2015). “Big Data Analytic Empowered Grid Applications — Is PMU a Big Data Issue?,” in 2015 12th International Conference on the European Energy Market (EEM). May 19-22, 2015. Lisbon, Portugal, 1–4.
Yang, Z., Liu, H., Bi, T., Yang, Q., and Xue, A. (2019). “A PMU Data Recovery Method Based on Feature Component Extraction,” in 2019 IEEE Power & Energy Society General Meeting (PESGM). August 4-8. Atlanta, GA, USA, 1–5.
Zhao, J., Qi, J., Huang, Z., Meliopoulos, A. P. S., Gomez-Exposito, A., Netto, M., et al. (2019). Power System Dynamic State Estimation: Motivations, Definitions, Methodologies, and Future Work. IEEE Trans. Power Syst. 34 (4), 3188–3198. doi:10.1109/TPWRS.2019.2894769
Keywords: data cleaning, outlier detection (OD), data recovery, phase measurement unit(PMU), apache spark
Citation: Shen L, He X, Liu M, Qin R, Guo C, Meng X and Duan R (2021) A Flexible Ensemble Algorithm for Big Data Cleaning of PMUs. Front. Energy Res. 9:695057. doi: 10.3389/fenrg.2021.695057
Received: 14 April 2021; Accepted: 16 July 2021;
Published: 27 July 2021.
Edited by:
Dazhong Ma, Northeastern University, ChinaReviewed by:
Liang Chen, Nanjing University of Information Science and Technology, ChinaBiplob Ray, Central Queensland University, Australia
Copyright © 2021 Shen, He, Liu, Qin, Guo, Meng and Duan. This is an open-access article distributed under the terms of the Creative Commons Attribution License (CC BY). The use, distribution or reproduction in other forums is permitted, provided the original author(s) and the copyright owner(s) are credited and that the original publication in this journal is cited, in accordance with accepted academic practice. No use, distribution or reproduction is permitted which does not comply with these terms.
*Correspondence: Risheng Qin, cWlucmlzaGVuZzIwMjBAMTI2LmNvbQ==