- Electrical Engineering and Computer Science Department, Khalifa University of Science and Technology, Abu Dhabi, United Arab Emirates
An effective control system for the air supply in fuel cell systems (FCS) is required to prevent oxygen starvation and to maximize the net power. For this purpose, conventional feedback and adaptive controllers are designed using genetic programming (GP). To minimize the time required for the GP convergence, FCS models of different complexity are studied and a comparison between them is carried out. Guidelines on applying the GP approach based on data obtained from simulations are developed along with a specially designed cost function that promotes closed-loop linearization. The advantage of this design method lies in its applicability to complex nonlinear systems for which nonlinear control methods may not be applicable. Adaptation is added to the oxygen excess ratio (OER) regulation problem by training a neural network that provides the optimal OER reference based on the stack current and temperature. The performance of both the regulation and adaptive controllers is tested under noise in the compressor flow and the stack current measurements. The robustness of the GP controllers is observed through the frequency response analysis.
1. Introduction
Due to its high energy density and low pollution, hydrogen is considered as one of the most promising alternatives to fossil fuels. Polymer electrolyte membrane (PEM), also known as proton exchange membrane fuel cells (FCs) is one type of fuel cells that is fueled by hydrogen. PEMFCs are suitable for vehicular applications due to their low operating temperature and high efficiency. They use oxygen and hydrogen from air and pressurized tanks, respectively, to produce electricity, water, and heat.
The main focus of this paper is on the control of the reactants flow subsystem which is responsible for hydrogen and air supplies. The hydrogen flow is controlled using a valve, while the oxygen flow is controlled by manipulating the compressor speed. The flows must be controlled effectively to optimize the net power and avoid oxygen starvation during changes in the vehicle demand. For electric vehicles, a competitive performance requires the power response of the fuel cell to be quick and efficient without harming the membrane. The power response is limited by the fuel feeders, flows and pressure regulators, and water and heat management systems. With changes in acceleration, transients occur in the current drawn by the load. This depletes oxygen which could lead to starvation. It also generates heat and water which can reduce the efficiency of the fuel cell. A control system is required in order to ensure that the power demand is met, and losses are minimized without causing oxygen starvation.
Several linear controllers are presented in (Methekar et al., 2007). First, the average power density is controlled through a proportional-integral (PI) controller where the manipulated variable is the inlet molar flow rate of hydrogen. It was shown that the severe input dependent nonlinearity that is present in the dynamics causes a slow response with a settling time of 275 s. Another approach investigated involves the control of average power density along with the solid temperature. The resulting multiple-input multiple-output system settles down in 90 s. To avoid oxygen starvation, a ratio control strategy is proposed, which allows changing the inlet flow rate of oxygen such that a certain hydrogen to oxygen ratio is maintained. It also rejects step disturbances in coolant temperature.
Nonlinear control schemes including gain scheduling and fuzzy control are studied in (Al-Durra et al., 2010). Feedback linearization (FBL) is used in (Chen et al., 2018) to track an optimal oxygen excess ratio (OER), also known as oxygen stoichiometry. On the other hand, FBL is used in (Ki Na and Gou, 2008), (Abbaspour et al., 2019), (Sankar and Jana, 2018) with the objective of minimizing the deviation between the partial pressures of the gases to prolong the fuel cell stack life. The control variables include the inlet flow rate of the two gases, oxygen and hydrogen. The FBL decouples and linearizes the input and output behaviors, while a PI controller imposes the closed-loop poles so that the partial pressures track asymptotically the desired trajectory. This provides a better performance compared to linear controllers according to the simulation results. Another application of FBL is found in (Sankar and Jana, 2018) where it is coupled with an adaptive state estimator. In other works, the pressures of the reactants are controlled to increase the durability of the FC by minimizing the partial pressure difference between oxygen and hydrogen (She et al., 2013), (Sankar and Jana, 2018).
On the other hand, Pukrushpan linearized a nine-state model where the resulting linear model consists of eight states (Pukrushpan et al., 2004b). The control objective is to maintain a desired net power and to keep the oxygen excess ratio at a desired level. Dynamic feedforward with PI (DFF + PI) controller was designed, yet it suffers from reduced robustness as the control performance relies more on the feedforward path. This issue was tackled by designing a state-feedback with integral action controller. The conflict of the objectives, which arises from the fact that the net power is affected by the compressor effort, was the main factor in choosing the optimization function of the controller. Since only the compressor air flow rate, supply manifold pressure, and stack voltage are measured, a reduced-order Kalman filter is used to apply full state feedback. Other works that focused on regulating the OER to a fixed value include gain scheduled linear parameter varying control (Bianchi et al., 2014).
A sixth-order model of the fuel cell system (FCS) is obtained through model reduction in (Rakhtala et al., 2014), and is used to design a high-order sliding mode (HOSM) observer and controller to track the optimal OER (Deng et al., 2018). In other works, an HOSM observer is used to estimate the OER, and a second-order sliding mode controller is designed to regulate OER to an optimal value to maximize the efficiency of the FCS (Pilloni et al., 2015). Sliding mode control was also applied to the hydrogen channel pressure in order to minimize the pressure difference while an extremum seeking controller was applied to the air channel pressure to maximize the net power (Hayati et al., 2016). Optimal OER has also been tracked in (Kelouwani et al., 2012) through an adaptive controller that utilizes online identification to estimate the efficiency parameters. Model predictive control has also been applied to control the OER but with a very simplified model of the plant (Wang and Kim, 2014), (Arce et al., 2010).
Genetic programming (GP) has not been widely used for control systems applications. In the same year when Koza published his popular book on GP (Koza, 1992), GP was used to discover an effective control algorithm for a model of an active suspension system (Marko and Hampo, 1992). The work in (Koza et al., 2000) proposed using GP to generate controllers that meet time-domain and frequency-domain constraints and were tested on three-lag plant with a significant time delay. The function set was limited to transfer functions, which limited the resulting GP functions to linear controllers. This is preferred for the linear plant that was given as an example, but is often not the ideal solution for nonlinear plants. Other reported applications of GP are related to control and robotics (Paić-Antunović and Jakobović, 2012), (Ferreira et al., 2014).
Many control strategies have been used to obtain controllers for the objective of regulating the OER. However, these approaches have never been applied to the high order models of the FCS due to their nonlinearity and complexity. The problem of adaptation for optimal OER has not been addressed either for the high-order models, where third-order (Chen et al., 2018) and fifth-order models (Liu et al., 2019) are normally used. Even with such controllers, the OER optimal reference is generated through a fitted function, which is only a function of the stack current, with other factors such as the stack temperature ignored.
This paper, therefore, addresses the existing gaps that is done by first investigating multiple models of the FCS to determine the most suitable one for GP applications. It is shown that a model of five states is enough to capture almost all the dynamics of the OER with the least run time. Secondly, a general methodology for developing GP controllers through simulations and development of the cost function ensuring linearizing property of the GP-based controller is proposed and applied to the FCS. The resulting algorithm is capable of generating controllers that provide consistent performance over a wide range of operating conditions. Thirdly, optimal setpoint generation is performed by training a neural network that is based on stack current as well as temperature variations. The network approximates the optimal ratio with high accuracy and feeds the reference to a controller generated through GP.
The paper starts with the investigation of available FC models. Order reduction and comparison between models is performed in Section 2. Section 3 provides a brief on the GP algorithm and develops guidelines on applying GP based on data obtained from simulations. Section 4 discusses the application of GP to the air flow control of the FC. The adaptation for load and temperature variations is presented in Section 5. Finally, concluding remarks are presented in Section 6.
2. System Model
In the case of model-based control techniques, an accurate model that captures the dynamics of the system is required. On the other hand, it may not be evident that a model is required for data-driven control approaches since many of them are applied to data that is obtained through experimentation. In this paper, however, data is obtained through simulations which requires an accurate model. Therefore, we investigate in this section the most popular models of PEMFCs, and we study reduced-order versions that can be run in significantly less time with the least impact on the variables of interest, specifically, the air supply dynamics. The air supply subsystem is shown in Figure 1, indicating five states and their corresponding differential equation which will be included in the model.
One of the most popular models of a PEMFC is the nine-state nonlinear model given in (Pukrushpan et al., 2004b), which is reduced to the fourth-order in (Suh and Stefanopoulou, 2007) with reasonable assumptions for the purpose of air-supply control, and further reduced to a third-order model in (Talj et al., 2010). In the present paper, we study the fourth-order model and determine if more states are required to achieve a reasonable accuracy. The model assumes that gases obey the ideal gas law, and the cathode temperature is equal to the stack temperature. Also, it assumes that the temperature and pressure of flow exiting the cathode are equal to the ones in the cathode. All the water is assumed to be in the form of vapor, and the gases in the cathode and anode are fully humidified. Flooding is neglected in gas diffusion layer, and spatial variations in flow channel and gas diffusion layer are neglected.
The four-states model is governed by
The inlet cathode flow rate
where the oxygen mass fraction of inlet air,
where the oxygen molar ratio,
where
where
The mass flow rate out of the cathode
for
and
for
where
The mass flow rate of the compressor,
where
while the torque consumed by the compressor is given by
where
The five-states model is similar to the model above but with the addition of the return manifold dynamics which are given by
where the flow rate out of the cathode is determined by
and the manifold exit flow can be calculated similar to Eqs. 12, 14 except for the cathode partial pressure which is replaced by the partial pressure of the return manifold.
The six-states model is similar to the previous model except that the dynamics of the mass in the supply manifold is considered. The corresponding differential equation is
where the mass flow rate out of the supply manifold is given by
and the supply manifold pressure equation is modified to include the temperature difference as
In all of the models, the mass flow of reacted oxygen is directly related to the stack current as
where n is the number of cells and F is the Faraday constant. The variable of interest which is the oxygen excess ratio or stoichiometric factor is given by
For the net power simulation, the stack voltage is obtained by subtracting the activation, concentration, and ohmic losses from the open circuit voltage, and taking into account the number of cells as given by
The losses and open circuit voltage are functions of the stack temperature and membrane water content and are calculated as in (Pukrushpan et al., 2004b). Since the compressor consumes up to 93.5% of the total auxiliary power (Li et al., 2018), the net power is considered to be the difference between the power produced by the stack and the power consumed by compressor motor and is given by
where
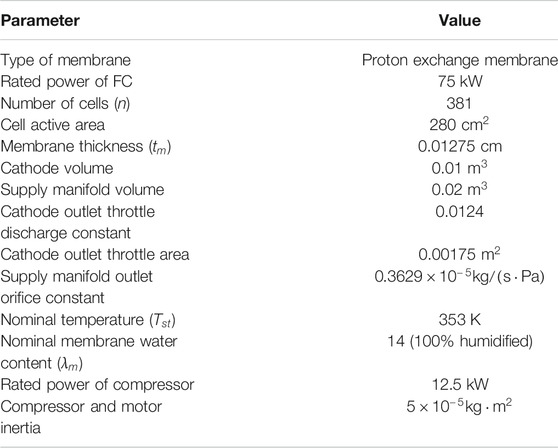
The comparison between the three reduced models is performed by simulations, and they are compared to the nine-states model as well. A summary of the model parameters is provided in Table 1, while the different state vectors and the measured run time is given in Table 2.
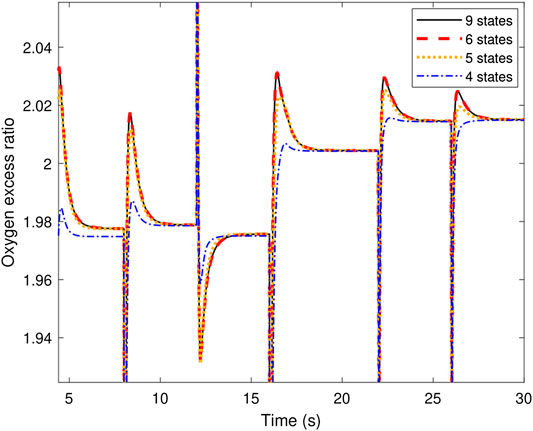
The results shown in Figure 2 demonstrate the changes in OER that occur due to a series of step changes in the stack current. Static feed-forward control is used to generate the compressor voltage for all the simulations. The OER responses of the nine-states and six-states models are almost identical, while the five-states model has a minor difference in overshoot. On the contrary, the four-states model oversimplifies the OER response and shows much smaller overshoot throughout the simulation. As for the net power, the response is identical for all models. Since the objective of this paper is to follow a specific OER, the fours-states model is not sufficient. The five-states model is selected for this study as it captures the OER dynamics and runs faster than the six-states model by about 20%.
3. Genetic Programming
Machine learning control, which includes GP, is usually applied to complex systems for which it is difficult to derive a model or to develop a control law. This makes it suitable for high order models of FCS that does not facilitate the development of adequate control laws.
3.1. Principles of GP
Genetic algorithms (GA) can effectively solve many optimization problems. A solid understanding of their properties have become available due to the variety of theoretical studies performed. However, the representation of individuals which is based on a fixed-length string-type is unnatural and constrains the effectiveness of GA for many applications. For instance, a computer program has more freedom when it is expressed as a hierarchical, variable size structure instead of a fixed-length string with variable parameters. The initial choice of the string length in GA limits in advance the complexity of the program and sets an upper bound on what the system can learn.
GP can be used to learn and enhance control laws, which could be nonlinear mappings from the sensors’ outputs to the actuators’ inputs. This mapping can be represented by a recursive function tree, where the generations are obtained using the same operations used in genetic algorithms. An overall view of GP within a control loop is depicted in Figure 3. In generation j, the population is composed of multiple controls
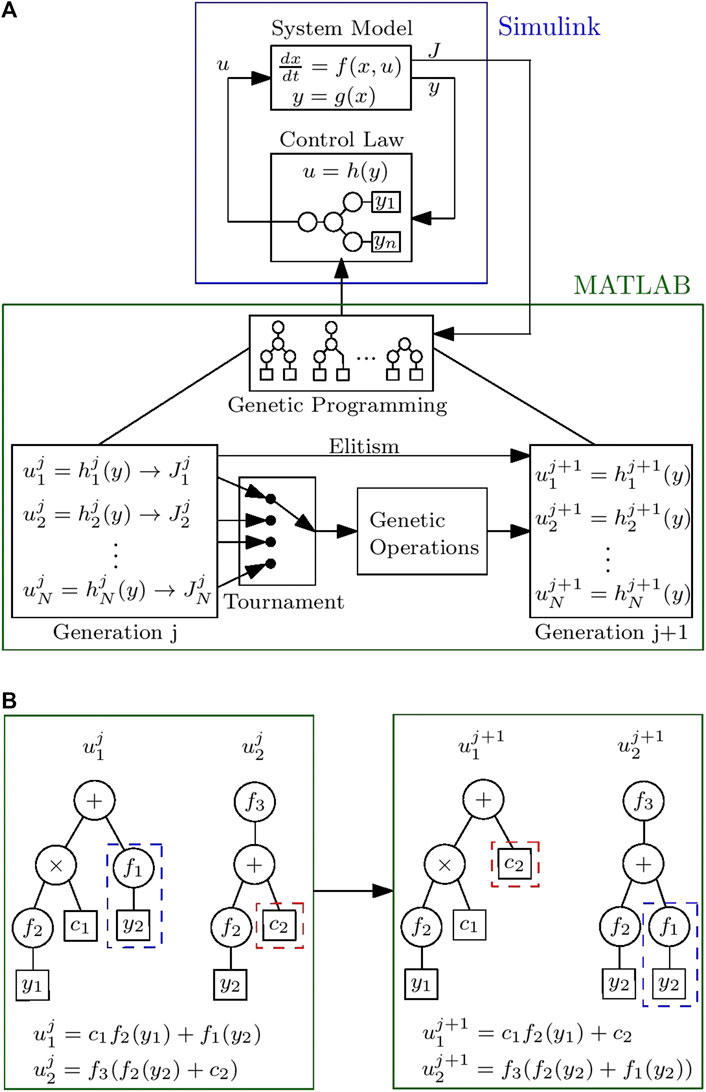
FIGURE 3. Application of GP in control systems (Duriez et al., 2017). A general overview of the implementation is shown in (A), while an example of the crossover operation is shown in (B). The terminals are enclosed by squares while functions are in circles.
A cost function J is defined based on the response characteristics of the system. This cost is fed back to the GP block to guide it to a better control structure and/or better parameters selection. This continuously modified controller takes the sensed states to supply the actuation to the plant, and this process keeps repeating until some defined termination criteria is met.
The tree-based GP algorithm for control applications is based on the following steps (Koza, 1992):
1. Step 1. Initialize a random population of controllers using the terminal and function sets. The terminal set includes constants and variables that will appear in the control law where the variables are the measurements obtained from the available sensors. The function set includes the pool of allowed mathematical operations.
2. Step 2. Repeat (a) and (b) until a termination criterion is reached. (a) Simulate the system using each controller in the population of controllers and give it a fitness value based on a cost function. (b) Choose a set of controllers for mating with a selection probability that is proportional to their fitness. Based on their probabilities, apply the genetic operations (i) to (iii) to create the population of the next generation.
(i) Replication: a controller is taken to the population of the next generation without modification. (ii) Crossover: random parts of two controllers are recombined to form a new controller. (iii) Mutation: create a random controller part and substitute it in place of a randomly selected part in an existing controller function.
3. Step 3. The best controller throughout the generations is the result of the GP process. The GP tree is formed of nodes and leaves, which represent functions and terminals, respectively. The set of functions can include arithmetic operations, mathematical functions, Boolean and conditional operations, and iterative operations. On the other hand, the set of terminals is formed from the available variables and constants. It is recommended that the function and terminal sets satisfying closure and sufficiency requirements must be ensured (Rozenberg et al., 2012).
3.2. GP for System Linearization
Given that the fuel cell is a nonlinear system, it responds differently to disturbances of different sizes. However, having a consistent response is desirable to guarantee a good performance over a wide range of operating conditions. A system is said to be linear if it satisfies the property of superposition. Given two inputs,
Consider L step signals of sizes
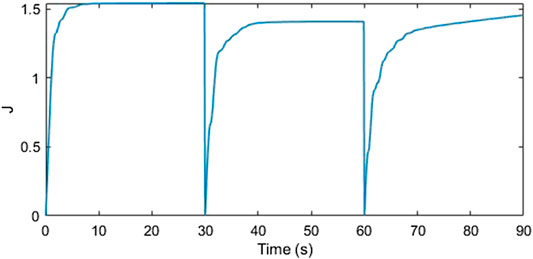
The first term is the summed weighted cost which is responsible of enhancing the overall performance and is given by
where
where
where
4. Air Flow Control Using GP
A complicated phenomenon known as oxygen starvation occurs when the oxygen excess ratio goes below 1. This event has serious consequences where it leads to a sharp decrease in the cell voltage, which can lead to hot spots on the membrane and hence permanent damage.
Therefore, the control objective in the FC air supply subsystem is to regulate the OER to a desired level, usually 2, in the presence of load (stack current) changes, which is modeled as a disturbance. An alternative objective is to track an optimal OER given by a neural network. Since the OER is not available for measurement due to the lack of OER sensor (Suh and Stefanopoulou, 2007), the control is based on two measurements, the compressor air flow rate and the current demanded by the vehicle power management system. The compressor motor voltage is the controlled input. A proportional controller is used for the fuel flow to ensure equal pressures in the anode and cathode.
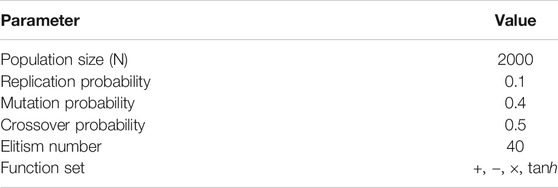
The GP controller is generated for the five-states model but is tested on the nine-states model to ensure its functionality on the more accurate model. The available measurements are the stack current, compressor flow rate, and temperature. The controller gives the compressor voltage, which has to regulate or track the reference OER with the least excursion and quickest recovery. The controller inputs are scaled, and the output of the controller passes through an absolute value block which leads to faster convergence of the GP algorithm. The GP parameters are given in Table 3.
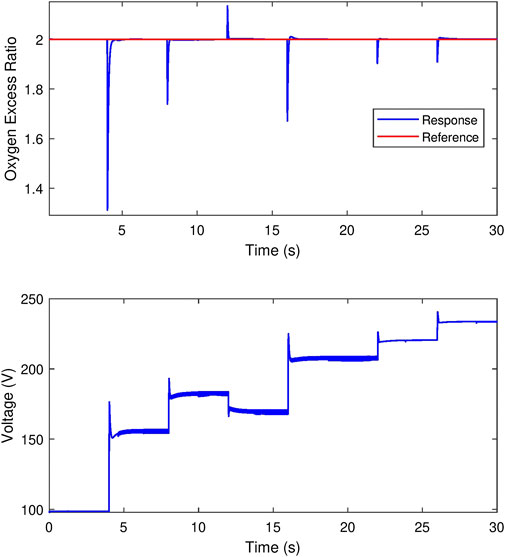
A sample GP controller for the OER regulation yields the response shown in Figure 5. The controller provides a quick recovery to the OER with minimal overshoot under different sizes of steps in the stack current. The control effort, given by the compressor voltage, is also within the permittable range.
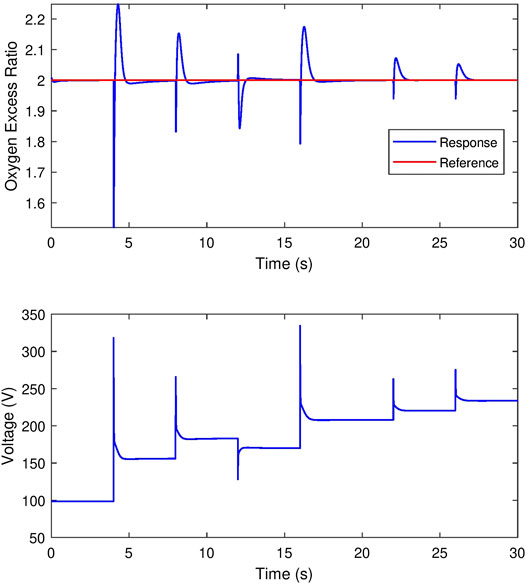
The obtained controller performs well in minimizing the integral absolute error (IAE) of the OER, but still does not limit the sudden excursion, which happens at the time when the load changes. In order to minimize the excursion, the minimum OER value for each time window should be added to the cost function with a weight that depends on the step size of the disturbance as well. Furthermore, the derivative of the stack current should be included in GP controller inputs. Since the stack current is low-pass-filtered, a filtered derivative can be obtained. A GP controller that is obtained through this strategy performs, as shown in Figure 6. It can be seen that the excursion of the first step is reduced to about 0.5 instead of 0.7, as in the previous case. All other excursions are reduced as well. However, the overshoot became higher due to the aggressiveness of the new controller, which can also be seen from the large control effort. An overshoot is not a problem by itself since extra OER is not harmful, but this would mean that the undershoot is high as well, as can be noticed at
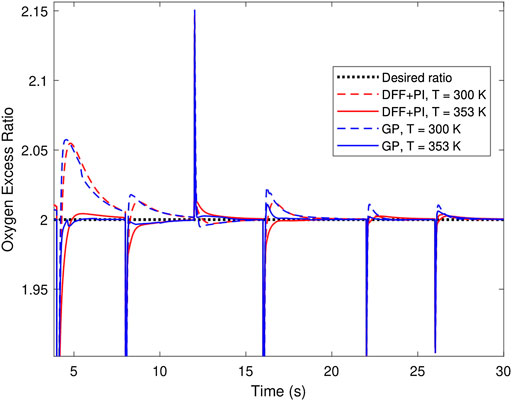
The performance of the GP controller for IAE minimization is compared to the traditional DFF + PI controller developed in (Pukrushpan et al., 2004b) in order to assess the effectiveness of the GP method. The GP controller provides a response with shorter settling time in most of the step sizes of the disturbance, as shown in Figure 7. The performance of both controllers deteriorates at different operating conditions, such as a decrease in the stack temperature. The DFF + PI seems to be more robust to this change, although the difference is minor. The IAE and the integral square error (ISE) for both controllers for the two temperatures is given in Table 4. This drawback of the GP controller is due to the fact that it is trained on the plant with a nominal temperature of 353 K. Therefore, it does not necessarily perform well at other temperatures. Nevertheless, the robustness can be addressed by changing the parameters of concern between generations, or by extending the simulation and adjusting the temperature between two of the step disturbances. In this case, GP controllers that perform well at multiple temperatures would survive since they would be assessed based on the response that depends on the updated temperatures.
A sine stream with a bias of 250 A is used to generate Bode plots to compare between the controllers. The closed-loop frequency response from the disturbance to the excess ratio using static feedforward (SFF) control, DFF + PI control, and the GP controller is shown in Figure 8. Both DFF + PI and GP controllers reduce the magnitude of the excess ratio more than the SFF controller at most frequencies. The stack current is filtered in practice by a low pass filter to give time for the FCS controller to react and avoid oxygen starvation. A high cutoff frequency is desired for this filter in order to provide quick power output. The spectrum of the step disturbance includes all frequencies, but it is filtered through a low pass filter with a cutoff frequency of 100 rad/s in this study. Therefore, it is preferred to have a controller that attenuates the magnitude of excess ratio within this frequency. The linearizing property of the GP controller can be noticed where the Bode plots are generated for different amplitudes. The Bode plot of the GP controller case maintains the smallest shift in the Bode plot when the amplitude is changed compared to the SFF and DFF + PI controllers.
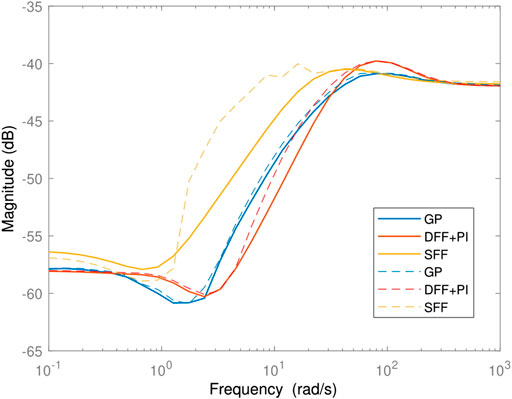
FIGURE 8. Closed-loop frequency response from the disturbance to the excess ratio. Solid and dashed lines represent the plots obtained using sinusoids of amplitudes 20 and 40 A, respectively.
5. Adaptation for Load and Temperature Changes
Since PEMFC are considered as a power source for automobiles, they are expected to undergo large and quick load transitions during their operation. Keeping the oxygen excess ratio above a certain value is necessary to prevent damaging the fuel cell. However, keeping this excess at a constant value such as in (Pukrushpan et al., 2004b) does not yield the optimum net power output as the latter depends heavily on the oxygen excess ratio in the cathode. A high excess ratio means that a high amount of oxygen is supplied to the cathode, which yields a higher output power in general. Nevertheless, the net power decreases for a very high excess ratio due to the excessive power consumed by the compressor. Therefore, the tradeoff between the fuel cell power production and the compressor power consumption has to be addressed to obtain the optimal excess ratio.
For the purpose of maximizing the output power, a mapping between the stack current and the oxygen excess ratio that yields maximum net power should be obtained. Then, a controller that can follow the optimum excess ratio with quick response and zero steady-state error must be generated. It is also preferred for the control algorithm to be computationally efficient and self-optimizing in order to consider model uncertainty and the variations in the system parameters. The authors in (Chang and Moura, 2009) provided simulation results that show that the optimum excess ratio depends on the stack current, stack temperature, and membrane hydration. They proposed an online extremum seeking approach to regulate the oxygen excess ratio about an optimum value for time-varying parameters. However, the simulations show that the controller takes about 2 min to reach the optimum power, which is indeed not practical for automotive applications where power demand is changing continuously. Moreover, the method relies on periodic perturbation, which leads to non-vanishing oscillations. This leads to producing power close to optimum value, but it never converges to it. A more practical implementation is given in (Chen et al., 2018) by providing the optimal reference ratio to a fuzzy controller through a lookup table, where the optimal values are pre-recorded for different stack currents. Another practical method is proposed in (Chen et al., 2018), where the optimal excess ratio is expressed as a function of the stack current. A controller that tracks the reference ratio is then designed through feedback linearization based on a third-order model of the air supply system.
The methods mentioned contain multiple drawbacks. First, the optimal ratio was taken as a function of only the stack current, while the effect of temperature variation was neglected. Second, the fitting of a simple function and the use of a lookup table are clearly unable to provide high accuracy in estimating the optimal ratio. Furthermore, the controllers designed rely on either a simplified model of the system in case of feedback linearization, or the experience of the designer in the case of fuzzy control. In our approach, we propose obtaining a nonlinear map from the current and temperature to the optimal excess ratio through a neural network. This map can then be used online to provide the reference excess ratio to the controller, which is obtained through the application of GP.
An artificial neural network (ANN) that consists of four hidden layers with 50, 30, 10, 10 neurons can approximate the optimal OER as shown in Figure 9 for current that ranges from 80 to 238 A and temperature that ranges from
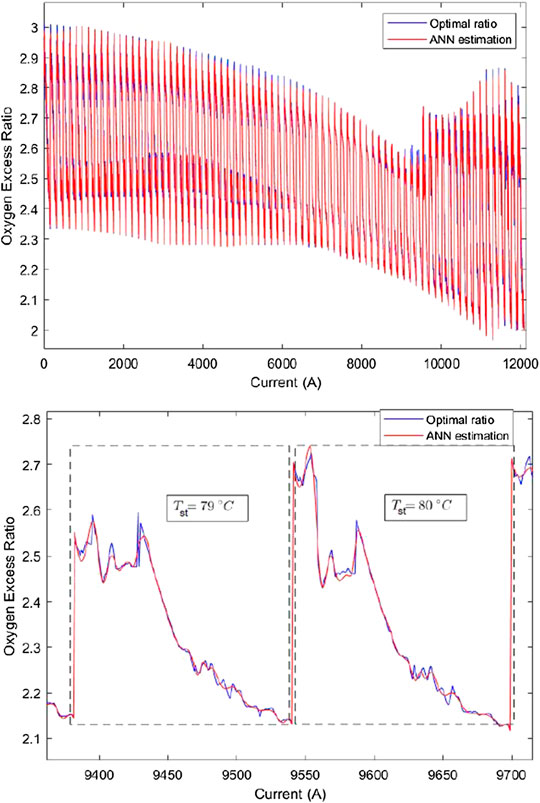
FIGURE 9. Optimal OER and its estimation using ANN. The curves are combined for different temperatures.
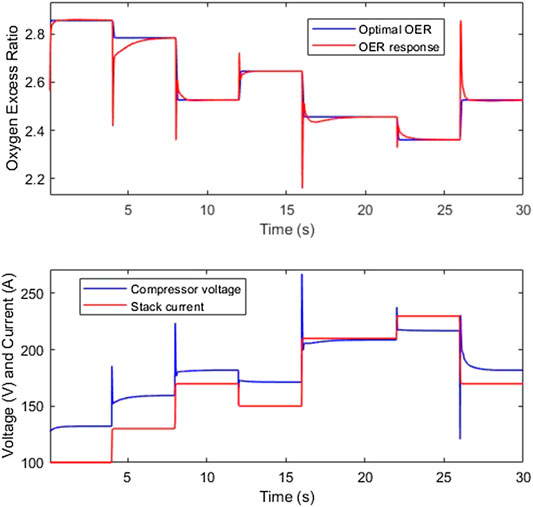
The trained ANN is used to generate the optimal OER based on the stack temperature and current. A GP controller with five inputs is trained to follow the optimal OER. The optimal ratio is a setpoint which is augmented based on the stack current and temperature. This can be considered as a form of gain scheduling that is used to provide adaptation to uncertainties, such as the stack current disturbance. Since the variation in stack current is essentially a result of the change in load resistance, this uncertainty can also be viewed as a variation in the system parameters if a more comprehensive model that includes the load is considered. A mean block is used to smooth out some undesired spikes that occur at the ANN output. Figure 10 shows the performance of the generated controller at a nominal temperature. It also shows the new current profile, which is used to remain within the permittable compressor voltage command range.
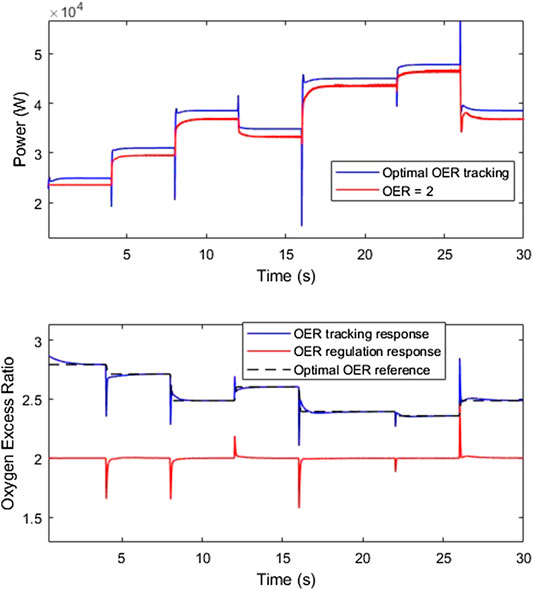
It is desired to view the difference in the net power when regulating OER at two against when using the optimal OER adaptation. This difference is not clear when the FCS is simulated at the nominal temperature since the dependence on stack current is small. The difference, however, is large when the stack temperature changes as can be seen in Figure 11. Although the adaptive controller provides higher net power at a steady-state, it goes through a sharp reduction during transients. This is due to the current derivative term that is not available in the GP regulator used in the comparison. This derivative causes the compressor to react aggressively and to consume more power, but it reduces the excursion in OER.
The controllers generated through GP can be viewed and tested through the Simulink files provided in the Supplementary Material for this article.
6. Conclusion
Quick response in a FC system is essential to avoid permanent damage to the membrane and increase the lifetime of the system. The high changes and uncertainty in electrical loads make the problem of maintaining a specific level of OER challenging. The control design problem is tackled in the present research through the unconventional data-driven GP approach. To make the design process more feasible, multiple FCS models of different orders are obtained and compared in terms of accuracy and run time. The five-states model is found to be a good candidate that provides a balance between accuracy and run time. The linearizing property of GP through a specially designed cost function is exploited to generate controllers with consistent performance. The GP algorithm is used on the FCS five-states model to generate a controller that outperforms a conventional DFF + PI controller. Although a low-order model is using for the controller generation, the resultant controller is verified on the nine-states model. Furthermore, adaptation for different operating conditions is performed. This is achieved by training a neural network that outputs the optimal OER based on the stack current and temperature. The optimal OER is fed to a controller that is generated through GP. Overall, the GP-based control for a FC system is found to be a promising control approach that provides some useful features not available with other control approaches.
Data Availability Statement
The original contributions presented in the study are included in the article/Supplementary Material, further inquiries can be directed to the corresponding author.
Author Contributions
All authors listed have made a substantial, direct, and intellectual contribution to the work, and approved it for publication.
Funding
This work was supported by the ICT Funds-UAE under the Khalifa University project EX2019-011.
Conflict of Interest
The authors declare that the research was conducted in the absence of any commercial or financial relationships that could be construed as a potential conflict of interest.
Supplementary Material
The Supplementary Material for this article can be found online at: https://www.frontiersin.org/articles/10.3389/fenrg.2020.606020/full#supplementary-material.
Nomenclature
C Linearization weighting factor
e Error used in the GP cost function
E Open circuit voltage
F Faraday constant
J Total cost
n Number of cells
R Universal gas constant
Γ Specific heats of air ratio
References
Abbaspour, A., Yen, K. K., Forouzannezhad, P., and Sargolzaei, A. (2019). An adaptive resilient control approach for pressure control in proton exchange membrane fuel cells. IEEE Trans. Ind. Appl. 55, 6344–6354. doi:10.1109/TIA.2019.2929256
Al-Durra, A., Yurkovich, S., and Guezennec, Y. (2010). Study of nonlinear control schemes for an automotive traction PEM fuel cell system. Int. J. Hydrogen Energy. 35, 11291–11307. doi:10.1016/j.ijhydene.2010.07.046
Arce, A., del Real, A. J., Bordons, C., and Ramirez, D. R. (2010). Real-time implementation of a constrained mpc for efficient airflow control in a pem fuel cell. IEEE Trans. Ind. Electron. 57, 1892–1905. doi:10.1109/TIE.2009.2029524
Bianchi, F. D., Kunusch, C., Ocampo-Martinez, C., and Sánchez-Peña, R. S. (2014). A gain-scheduled lpv control for oxygen stoichiometry regulation in pem fuel cell systems. IEEE Trans. Contr. Syst. Technol. 22, 1837–1844. doi:10.1109/TCST.2013.2288992
Chang, Y. A., and Moura, S. J. (2009). “Air flow control in fuel cell systems: an extremum seeking approach,” in 2009 American Control Conference. St. Louis, MO, USA, June 10–12, 2009 (2009 American Control Conference), 105–1059
Chen, J., Liu, Z., Wang, F., Ouyang, Q., and Su, H. (2018). Optimal oxygen excess ratio control for pem fuel cells. IEEE Trans. Contr. Syst. Technol. 26, 1711–1721. doi:10.1109/TCST.2017.2723343
Deng, H., Li, Q., Chen, W., and Zhang, G. (2018). High-order sliding mode observer based oer control for pem fuel cell air-feed system. IEEE Trans. Energy Convers. 33, 232–244. doi:10.1109/TEC.2017.2742144
Duriez, T., Brunton, S. L., and Noack, B. R. (2017). Machine learning control-taming nonlinear dynamics and turbulence, Vol. 116. Berlin, Germany: Springer
Ferreira, C., Silva, P., André, J., Santos, C. P., and Costa, L. (2014). “Genetic programming applied to biped locomotion control with sensory information,” in 2014 11th International Conference on Informatics in Control, Automation and Robotics (ICINCO), Vienna, Austria, September 2–4, 2014 (IEEE), 53–62
Hayati, M. R., Khayatian, A., and Dehghani, M. (2016). Simultaneous optimization of net power and enhancement of pem fuel cell lifespan using extremum seeking and sliding mode control techniques. IEEE Trans. Energy Convers. 31, 688–696. doi:10.1109/TEC.2016.2514738
Kelouwani, S., Adegnon, K., Agbossou, K., and Dube, Y. (2012). Online system identification and adaptive control for pem fuel cell maximum efficiency tracking. IEEE Trans. Energy Convers. 27, 580–592. doi:10.1109/TEC.2012.2194496
Ki Na, W., and Gou, B. (2008). Feedback-linearization-based nonlinear control for pem fuel cells. IEEE Trans. Energy Convers. 23, 179–190. doi:10.1109/TEC.2007.914160
Koza, J. R. (1992). Genetic Programming: on the Programming of Computers by Means of Natural Selection, Vol. 1. Cambridge, MA: MIT press
Koza, J. R., Keane, M. A., Yu, J., Mydlowec, W., and Bennett, F. H. (2000). “Automatic synthesis of both the control law and parameters for a controller for a three-lag plant with five-second delay using genetic programming and simulation techniques,” in Proceedings of the 2000 American Control Conference. ACC (IEEE Cat. No.00CH36334), Chicago, IL, USA, June 28–30, 2000 (IEEE), 453–459
Li, H., Ravey, A., N’Diaye, A., and Djerdir, A. (2018). A novel equivalent consumption minimization strategy for hybrid electric vehicle powered by fuel cell, battery and supercapacitor. J. Power Sources. 395, 262–270. doi:10.1016/j.jpowsour.2018.05.078
Liu, J., Gao, Y., Su, X., Wack, M., and Wu, L. (2019). Disturbance-observer-based control for air management of pem fuel cell systems via sliding mode technique. IEEE Trans. Contr. Syst. Technol. 27, 1129–1138. doi:10.1109/TCST.2018.2802467
Marko, K. A., and Hampo, R. J. (1992). “Application of genetic programming to control of vehicle systems,” in Proceedings of the intelligent vehicles ‘92 symposium, Detroit, MI, USA, June 1, 1992 (IEEE), 191–195
Methekar, R., Prasad, V., and Gudi, R. (2007). Dynamic analysis and linear control strategies for proton exchange membrane fuel cell using a distributed parameter model. J. Power Sources. 165, 152–170. doi:10.1016/j.jpowsour.2006.11.047
Paić-Antunović, L., and Jakobović, D. (2012). “Evolution of automatic robot control with genetic programming,” in 2012 Proceedings of the 35th International Convention MIPRO, Opatija, Croatia, May 21–25, 2012 (IEEE), 817–822
Pilloni, A., Pisano, A., and Usai, E. (2015). Observer-based air excess ratio control of a pem fuel cell system via high-order sliding mode. IEEE Trans. Ind. Electron. 62, 5236–5246. doi:10.1109/TIE.2015.2412520
Pukrushpan, J. T., Peng, H., and Stefanopoulou, A. G. (2004a). Control-oriented modeling and analysis for automotive fuel cell systems. J. Dyn. Syst. Meas. Contr. 126, 14–25. doi:10.1115/1.1648308
Pukrushpan, J. T., Stefanopoulou, A. G., and Peng, H. (2004b). Control of fuel cell breathing. IEEE Contr. Syst. Mag. 24, 30–46. 10.1109/MCS.2004.1275430
Rakhtala, S. M., Noei, A. R., Ghaderi, R., and Usai, E. (2014). Design of finite-time high-order sliding mode state observer: a practical insight to pem fuel cell system. J. Process Contr. 24, 203–224. doi:10.1016/j.jprocont.2013.08.006
Rozenberg, G., Bäck, T., and Kok, J. N. (2012). Handbook of Natural Computing. Berlin, Germany: Springer
Sankar, K., and Jana, A. K. (2018). Dynamics and estimator-based nonlinear control of a pem fuel cell. IEEE Trans. Contr. Syst. Technol. 26, 1124–1131. doi:10.1109/TCST.2017.2695165
She, Y., Baran, M. E., and She, X. (2013). Multiobjective control of pem fuel cell system with improved durability. IEEE Transactions on Sustainable Energy. 4, 127–135. doi:10.1109/TSTE.2012.2203324
Suh, K., and Stefanopoulou, A. G. (2007). Performance limitations of air flow control in power-autonomous fuel cell systems. IEEE Trans. Contr. Syst. Technol. 15, 465–473. doi:10.1109/TCST.2007.894640
Talj, R. J., Hissel, D., Ortega, R., Becherif, M., and Hilairet, M. (2010). Experimental validation of a pem fuel-cell reduced-order model and a moto-compressor higher order sliding-mode control. IEEE Trans. Ind. Electron. 57, 1906–1913. doi:10.1109/TIE.2009.2029588
Keywords: genetic programming, fuel cell, oxygen starvation, system linearization, optimal oxygen excess ratio
Citation: Haddad AG, Al-Durra A and Boiko I (2021) Design of Genetic Programming Control Algorithm for Low-Temperature PEM Fuel Cell. Front. Energy Res. 8:606020. doi: 10.3389/fenrg.2020.606020
Received: 14 September 2020; Accepted: 02 December 2020;
Published: 15 January 2021.
Edited by:
Tomasz Wejrzanowski, Warsaw University of Technology, PolandReviewed by:
Antonio Martínez Chaparro, Centro de Investigaciones Energéticas, Medioambientales y Tecnológicas, SpainIoan Stamatin, University of Bucharest, Romania
Copyright © 2021 Haddad, Al-Durra and Boiko. This is an open-access article distributed under the terms of the Creative Commons Attribution License (CC BY). The use, distribution or reproduction in other forums is permitted, provided the original author(s) and the copyright owner(s) are credited and that the original publication in this journal is cited, in accordance with accepted academic practice. No use, distribution or reproduction is permitted which does not comply with these terms.
*Correspondence: Abdel Gafoor Haddad, YWJkZWxnYWZvb3IuaGFkZGFkQGt1LmFjLmFl
 Abdel Gafoor Haddad
 Ahmed Al-Durra
 Igor Boiko
