- 1Department of Cardiology, The First Affiliated Hospital of Xinxiang Medical University, Weihui, China
- 2Department of Epidemiology and Health Statistics, School of Public Health, Xinxiang Medical University, Xinxiang, China
- 3Life Science Research Center, The First Affiliated Hospital of Xinxiang Medical University, Weihui, China
- 4The Cardiology Department of the Third Affiliated Hospital of Xinxiang Medical University, Xinxiang, China
Background: Environmental factors have been identified as primary risk factors for type 2 diabetes mellitus (T2DM). However, studies on the association between environmental factors and T2DM have mainly focused on morbidity and mortality, which do not fully reflect the disease burden stemming from air pollution. Therefore, we aimed to evaluate the correlation between air pollution and T2DM, including hospital length of stay (LOS) and costs.
Methods: We collected data on patients with T2DM from three healthcare institutions in Xinxiang from 2016–2021. Data on particulate and gaseous pollutants in Xinxiang and daily meteorological data were collected from national databases. The distribution lag nonlinear model was used to evaluate the correlation between air pollution and the number of inpatients with T2DM, LOS, and hospital costs. Subgroup analyses were conducted to identify potential modifying factors.
Results: Overall, 13,797 patients with T2DM were included in our analysis. Within the cumulative lag of 7 days, with every increase of 1 mg/m3 of carbon monoxide (CO) and 10 μg/m3 of 2.5 microns particulate matter, nitrogen dioxide and ozone exhibited significant associations with an increase in diabetes hospitalization risk. CO exhibited adverse effects on LOS on most lag days. Moreover, hospital costs were significantly associated with the attributable fraction of LOS and hospital costs attributed to diabetes.
Conclusions: Exposure to air pollutants increased T2DM risk, imposing significant economic and social burdens in Xinxiang, China. Implementing policies to reduce air pollutant exposure may decrease T2DM admissions, costs, and LOS.
1 Introduction
Type 2 diabetes mellitus (T2DM) significantly contributes to the global disease burden and risk of premature death (1). One in eleven adults in the world has diabetes, and 90% of them have T2DM (2). The average time of death in diabetic patients is 6 years earlier than non-diabetic patients, and every 10 years of diabetes diagnosis, life expectancy decreases by about 4 years (3). A global diabetes report published by the World Health Organization stated that the global prevalence of T2DM has risen sharply in the past few decades. Unhealthy lifestyle, obesity, lack of exercise, and malnutrition are widely regarded as risk factors for T2DM (4–6). In addition to these recognized risk factors, environmental impact is increasingly considered as a cause of diabetes (7). Notably, air pollution is the eighth most important factor among the 79 death risk factors (8),and is associated with cardiovascular diseases. In a global and prospective study involving more than 100,000 people in 21 countries, it was found that air pollution was related to the attribution score of 13.9% people with cardiovascular diseases (9). Emerging evidence shows that air pollution is also associated with T2DM (10).
An increasing number of epidemiological studies have identified environmental factors as primary risk factors for T2DM (11–14). More than 20 years have passed since it was found that there is a significant correlation between air pollution and the prevalence of diabetes (15); however, recently this relationship has gained growing attention. A previous meta-analysis demonstrated that exposure to high levels of air pollution is significantly related to the increased prevalence of T2DM (16). 20% of diabetes worldwide is associated with exposure to particulate matter 2.5 microns (PM2.5) (17). Moreover, a large cohort study showed that there was a positive correlation between exposure to nitrogen dioxide (NO2) and the prevalence of diabetes (18). Furthermore, short-term exposure to PM2.5, particulate matter 10 microns (PM10), sulfur dioxide (SO2), and NO2 is positively associated with T2DM mortality (19), and under-diagnosed diabetes risk is associated with long-term ozone (O3) pollution in Malaysia (20).
Air pollution prevention measures have been successful worldwide. However, in Henan Province, a study shed light on the severe air pollution situation, especially in the northern part where the majority of the population lives with polluted air (21). Despite China’s efforts to improve air pollution, the health burden caused by air pollution is still high (22). Xinxiang, located in the northern part of Henan, has a population of 6 million and an annual gross domestic product of 300 billion Yuan, making it a critical economically developing region. Xinxiang is a city with relatively developed industries, surrounded by numerous chemical manufacturers and other industrial enterprises (23).
In recent years, increasing attention has been paid to the impact of air pollution on length of stay (LOS) and hospital costs (24). Diabetes not only leads to a reduced standard of living and health risks, but also has a significant economic impact on patients. Labor costs and socio-economic pressures exacerbate the strain on healthcare systems and governments globally (25). Previous studies have primarily focused on morbidity and mortality, which do not fully reflect the disease burden stemming from air pollution. Thus, our analysis aimed to assess the influence of air pollutants on hospital admissions, LOS, and expenses for patients with diabetes in Xinxiang.
2 Materials and methods
2.1 Patient selection
Data pertaining to patients with diabetes between January 1, 2016 and October 31, 2021 were collected from three healthcare institutions: The First Affiliated Hospital of Xinxiang Medical College, The Third Affiliated Hospital of Xinxiang Medical College, and Xinxiang People’s Hospital. A total of 13,797 patients with diabetes were included. All T2DM cases were clinically diagnosed and validated with the diagnostic code E11 from the 10th edition of the International Classification of Diseases. We recorded data on sex, age (categorized as<65 years old or ≥65 years old), hospital LOS, and hospital costs, which were also included in the database.
This study was approved by the Ethics Committee of the First Affiliated Hospital of Xinxiang Medical College. The ethical batch number is EC-022-140. All data used were collected for administrative purposes without any individual identifiers. Therefore, informed consent was not required.
2.2 Air pollutants data
The study included six air pollutants, including both particulate pollutants and gaseous pollutants, with particulate pollutants including PM2.5 and PM10 and gaseous pollutants including NO2, SO2, carbon monoxide (CO), and O3. Air pollution data for Xinxiang City were collected from the Henan Meteorological Residence for the years 2016–2021. Air pollutant concentrations were 24-h average concentrations. Furthermore, O3 concentrations were calculated as the maximum 8-h concentration per day and the daily average. Daily meteorological data for the same period, including minimum, average, and maximum temperatures and relative humidity, were downloaded from the publicly accessible China National Meteorological Data Sharing System (http://data.cma.cn/). Meteorological data were calculated every 24 h.
2.3 Statistical analysis
The distribution of air pollutants and meteorological factors were characterized using mean, standard deviation, quartiles, and maximum and minimum values. Poisson’s generalized additive model was used in this study. The confounding factors were the day of the week (DOW), time, and weather. Notably, the incidence of diabetes is affected by the air pollution on the same day and the exposure levels in previous days.
Therefore, we used the distributed lag nonlinear model (DLNM) to study the correlation. Based on the traditional models, such as the generalized linear model and generalized additive model, we used the cross-basis function to transform the characteristics of the variables, which has the following expression:
where Yt represents the number of patients with diabetes hospitalized; Zt denotes the concentration of the six air pollutants at day t; β represents the coefficient for Zt,l, which represents the logarithmic increase in hospitalizations per unit increase in air pollutants; l represents the lag days; ns refers to the restricted cubic spline; df is the degree of freedom (df); and time denotes the time variable (df was 7). The following covariates were applied to the model: df for both humidity and temperature as 3, DOW, and holidays as an indicator of the holiday season.
In the past, the distributed lag linear model (DLM) was widely used to study the health effects of air pollution. However, this model assumes a linear exposure–response relationship. Many exposure–response relationships (such as temperature–death) exhibit a nonlinear relationship, such as U and V, making the DLM unsuitable. To address these problems, in 2006, Armstrong (26) first proposed and applied the DLNM in epidemiology.
In this study, the DLNM was used to analyze the relationship between air pollution and the number of diabetes hospitalizations, days of hospitalization, and hospitalization costs. A 7-day lag was used to assess the lagged and cumulative impacts due to air pollution; it was categorized into single-day and multi-day lag, with the single-day lag ranging from lag 0 to lag 7, and the cumulative lag ranging from lag 01 to lag 07. Subgroup analyses by sex, age, and season were also conducted. Sex was categorized into male and female groups; age was categorized into elderly and non-elderly groups, with a cut-off of 65 years; and seasonal groups were categorized into warm and cold seasons, with May to September as the warm season group and January to February as the cold season group.
We used the forward methodology provided by Gasparrini and Leone (27) to estimate attributable fractions (AFs) and attribution number to quantify the number of days of hospitalization and the cost of hospitalization due to air pollution exposure. We also constructed a two-pollutant model to assess the potential impacts of individual air pollutants. The data outputs were relative risks (RRs) and 95% confidence intervals (CIs) for each 10-unit increase in PM10, NO2, SO2, CO, and O3 concentrations, and for each 1-unit increase in CO concentration.
All the calculations were performed using R software version 4.1.0 (R Core Team, Vienna, Austria), with its “DLNM” package. The statistical review of the study was performed by a biomedical statistician.
3 Results
3.1 Baseline characteristics
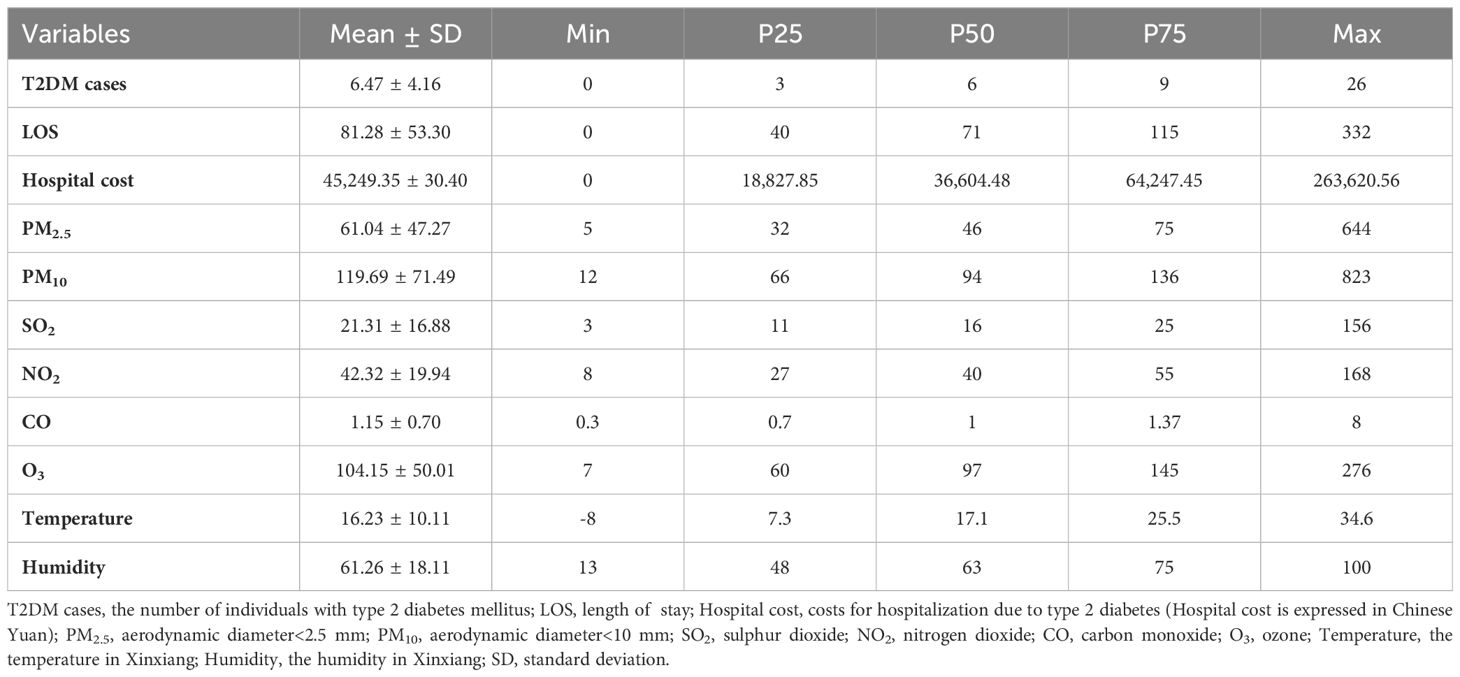
This analysis included 13,791 patients with T2DM (Table 1). Overall, 137,000 patients with diabetes had a total of 173,200 days of hospital LOS and 96 million Chinese Yuan in hospital costs. The daily ranges for diabetes hospital admissions, LOS, and costs were 0–26, 0–332 days, and 0–263,000 Chinese Yuan, respectively. Among the air pollutants, PM2.5 and PM10 had the broadest concentration ranges, from 5 μg/m3 to 644 μg/m3 and 12 μg/m3 to 823 μg/m3, respectively.
3.2 Data visualization
The time series results of diabetes, the six air pollutants, and the meteorological factors in Xinxiang City from 2016 to 2021 are shown in Figure 1. Diabetes hospitalizations showed a fluctuation according to the year; however, the overall trend showed an upward trajectory. The mean temperature and air pollution indicators exhibited significant periodicity and relatively stable patterns. The concentrations of CO, NO2, and SO2 decreased annually, with higher pollutants concentrations observed during the winter.
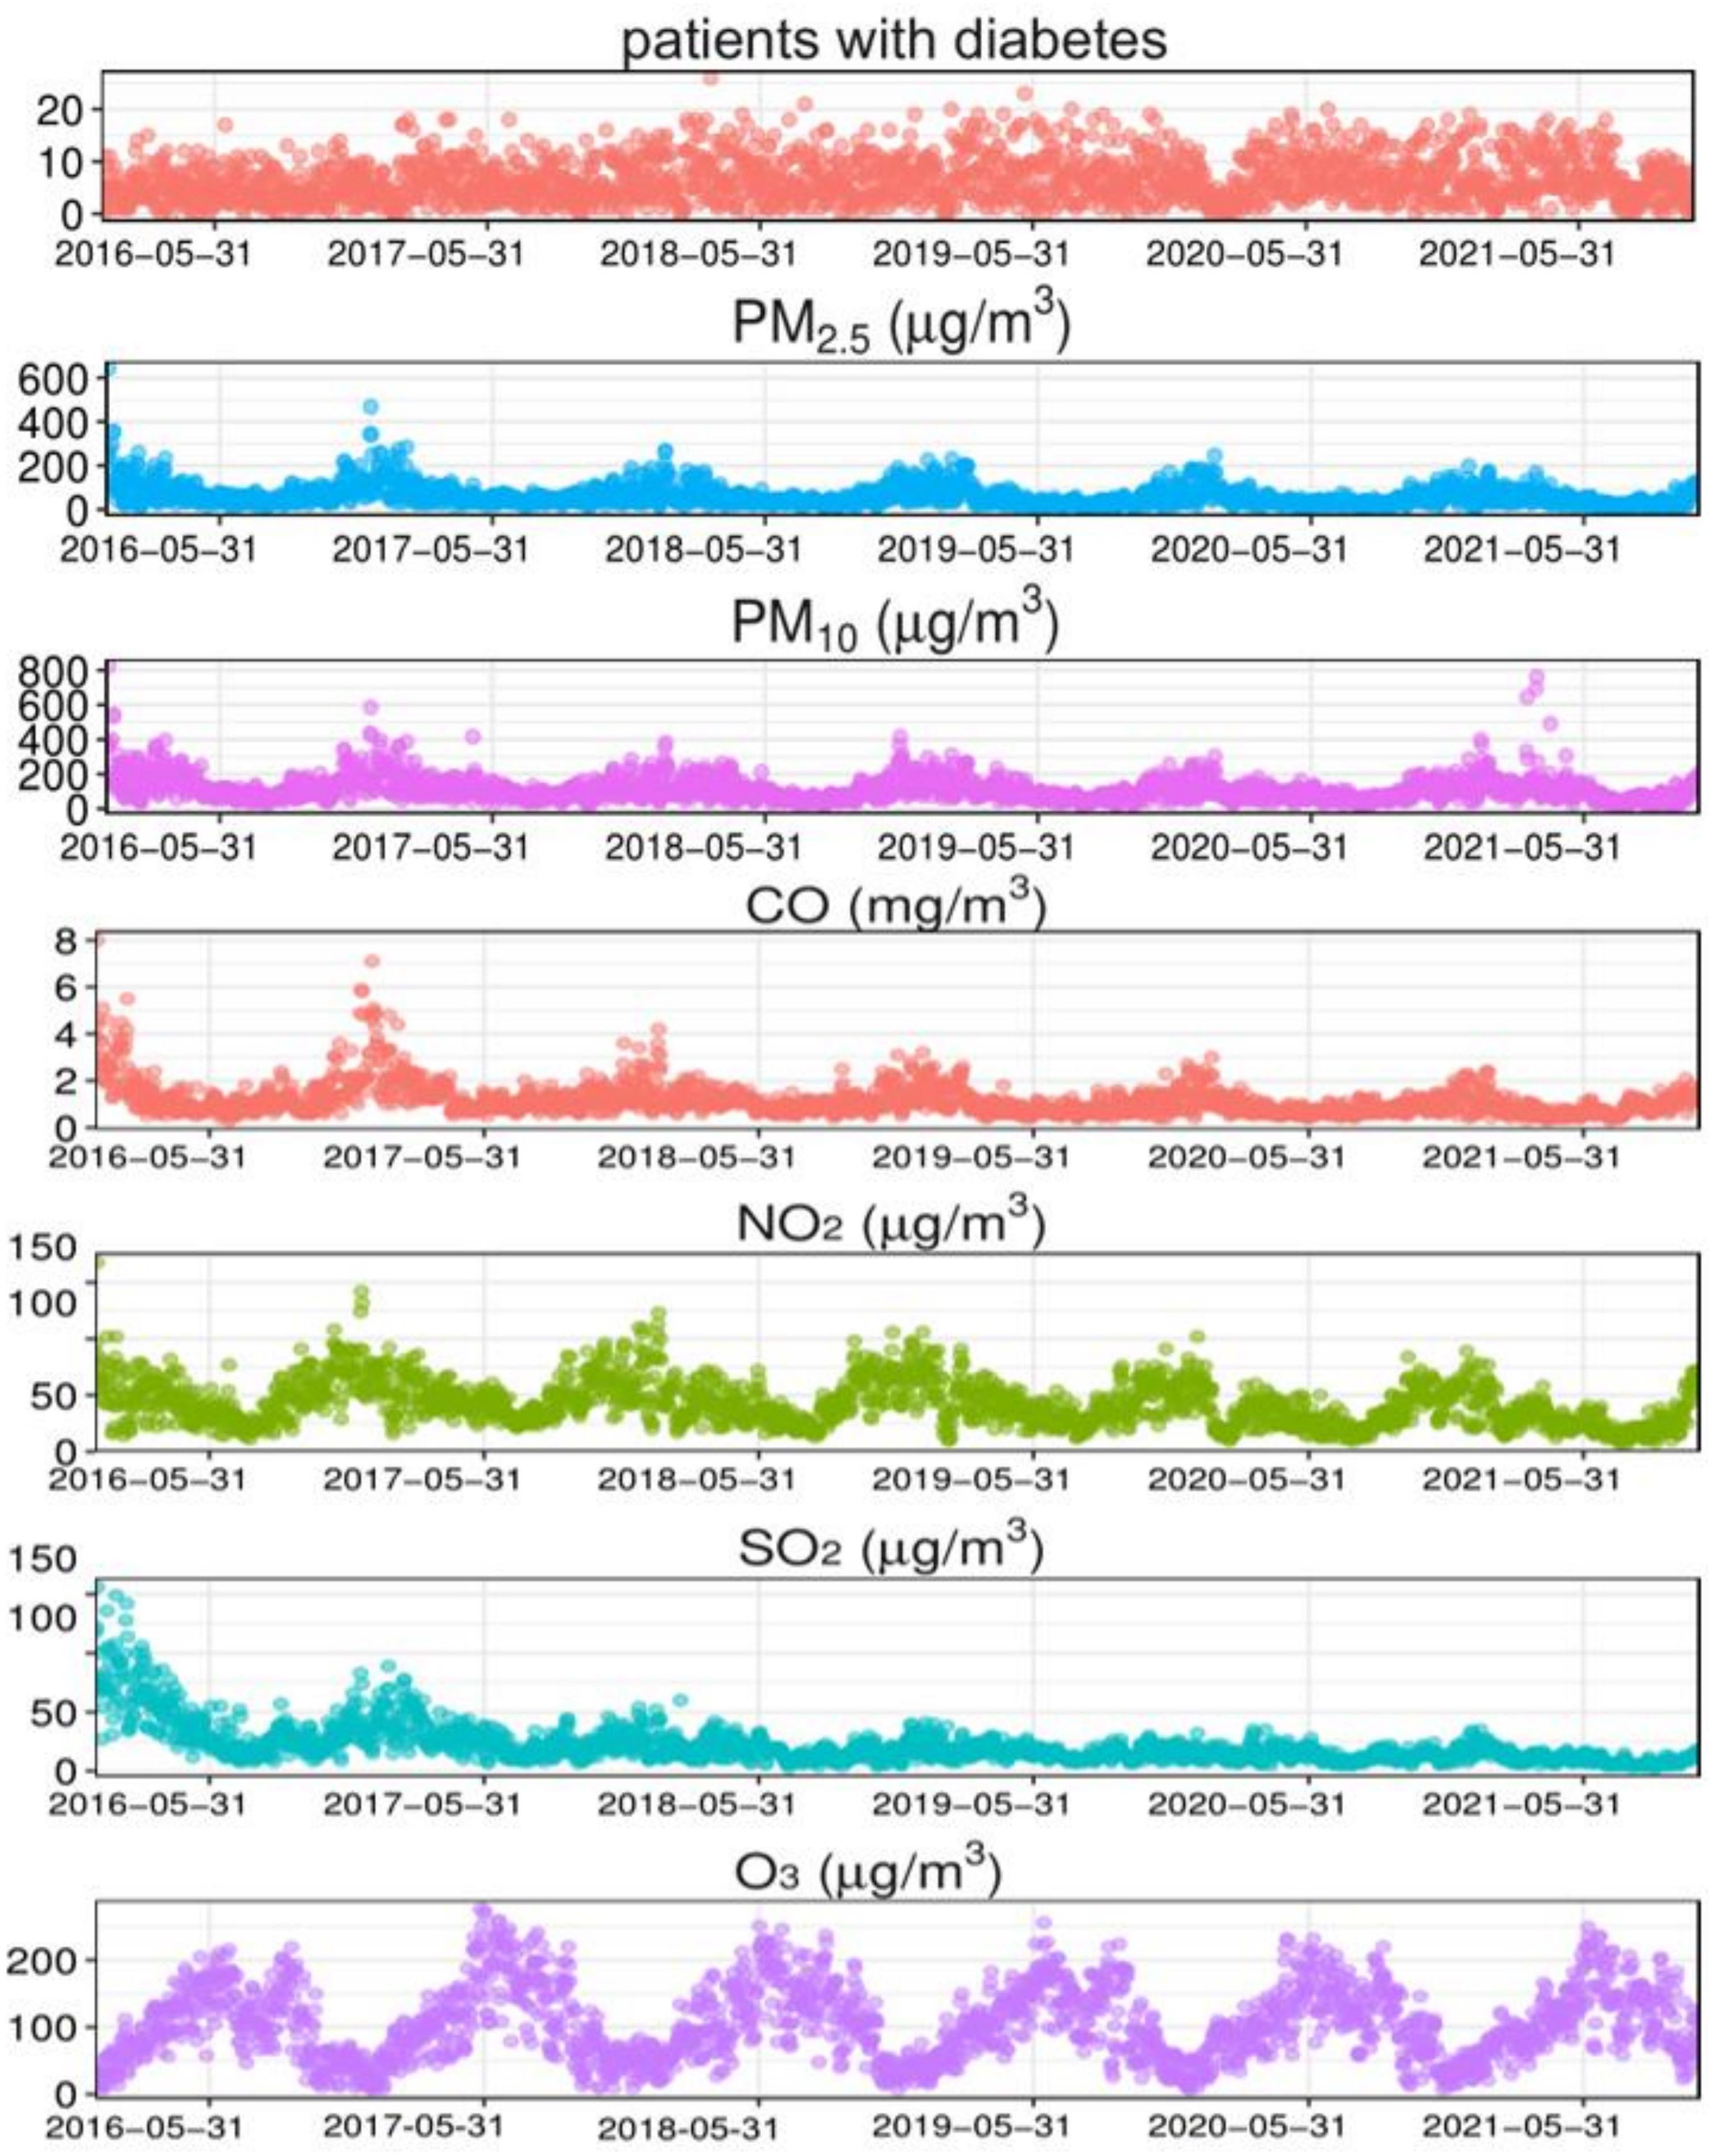
Figure 1. Time-series results regarding the association of diabetes with meteorological factors and air pollution indicators in Xinxiang. PM2.5, aerodynamic diameter<2.5 μm; PM10, aerodynamic diameter<10 μm; SO2, sulfur dioxide; NO2, nitrogen dioxide; CO, carbon monoxide; O3, ozone.
3.3 Association between pollutants and diabetes admission
The relationship between pollutants and the number of diabetes hospitalizations showed a largely nonlinear and lagged relationship. Three-dimensional (3D) plots were used to describe the relationship between the six air pollutants and the number of hospitalizations for diabetes (Figure 2). The 3D graphic represents the correlation in terms of RR, depicting the risk of hospitalization for diabetes mellitus and the exposure to different pollutants at different lag days.
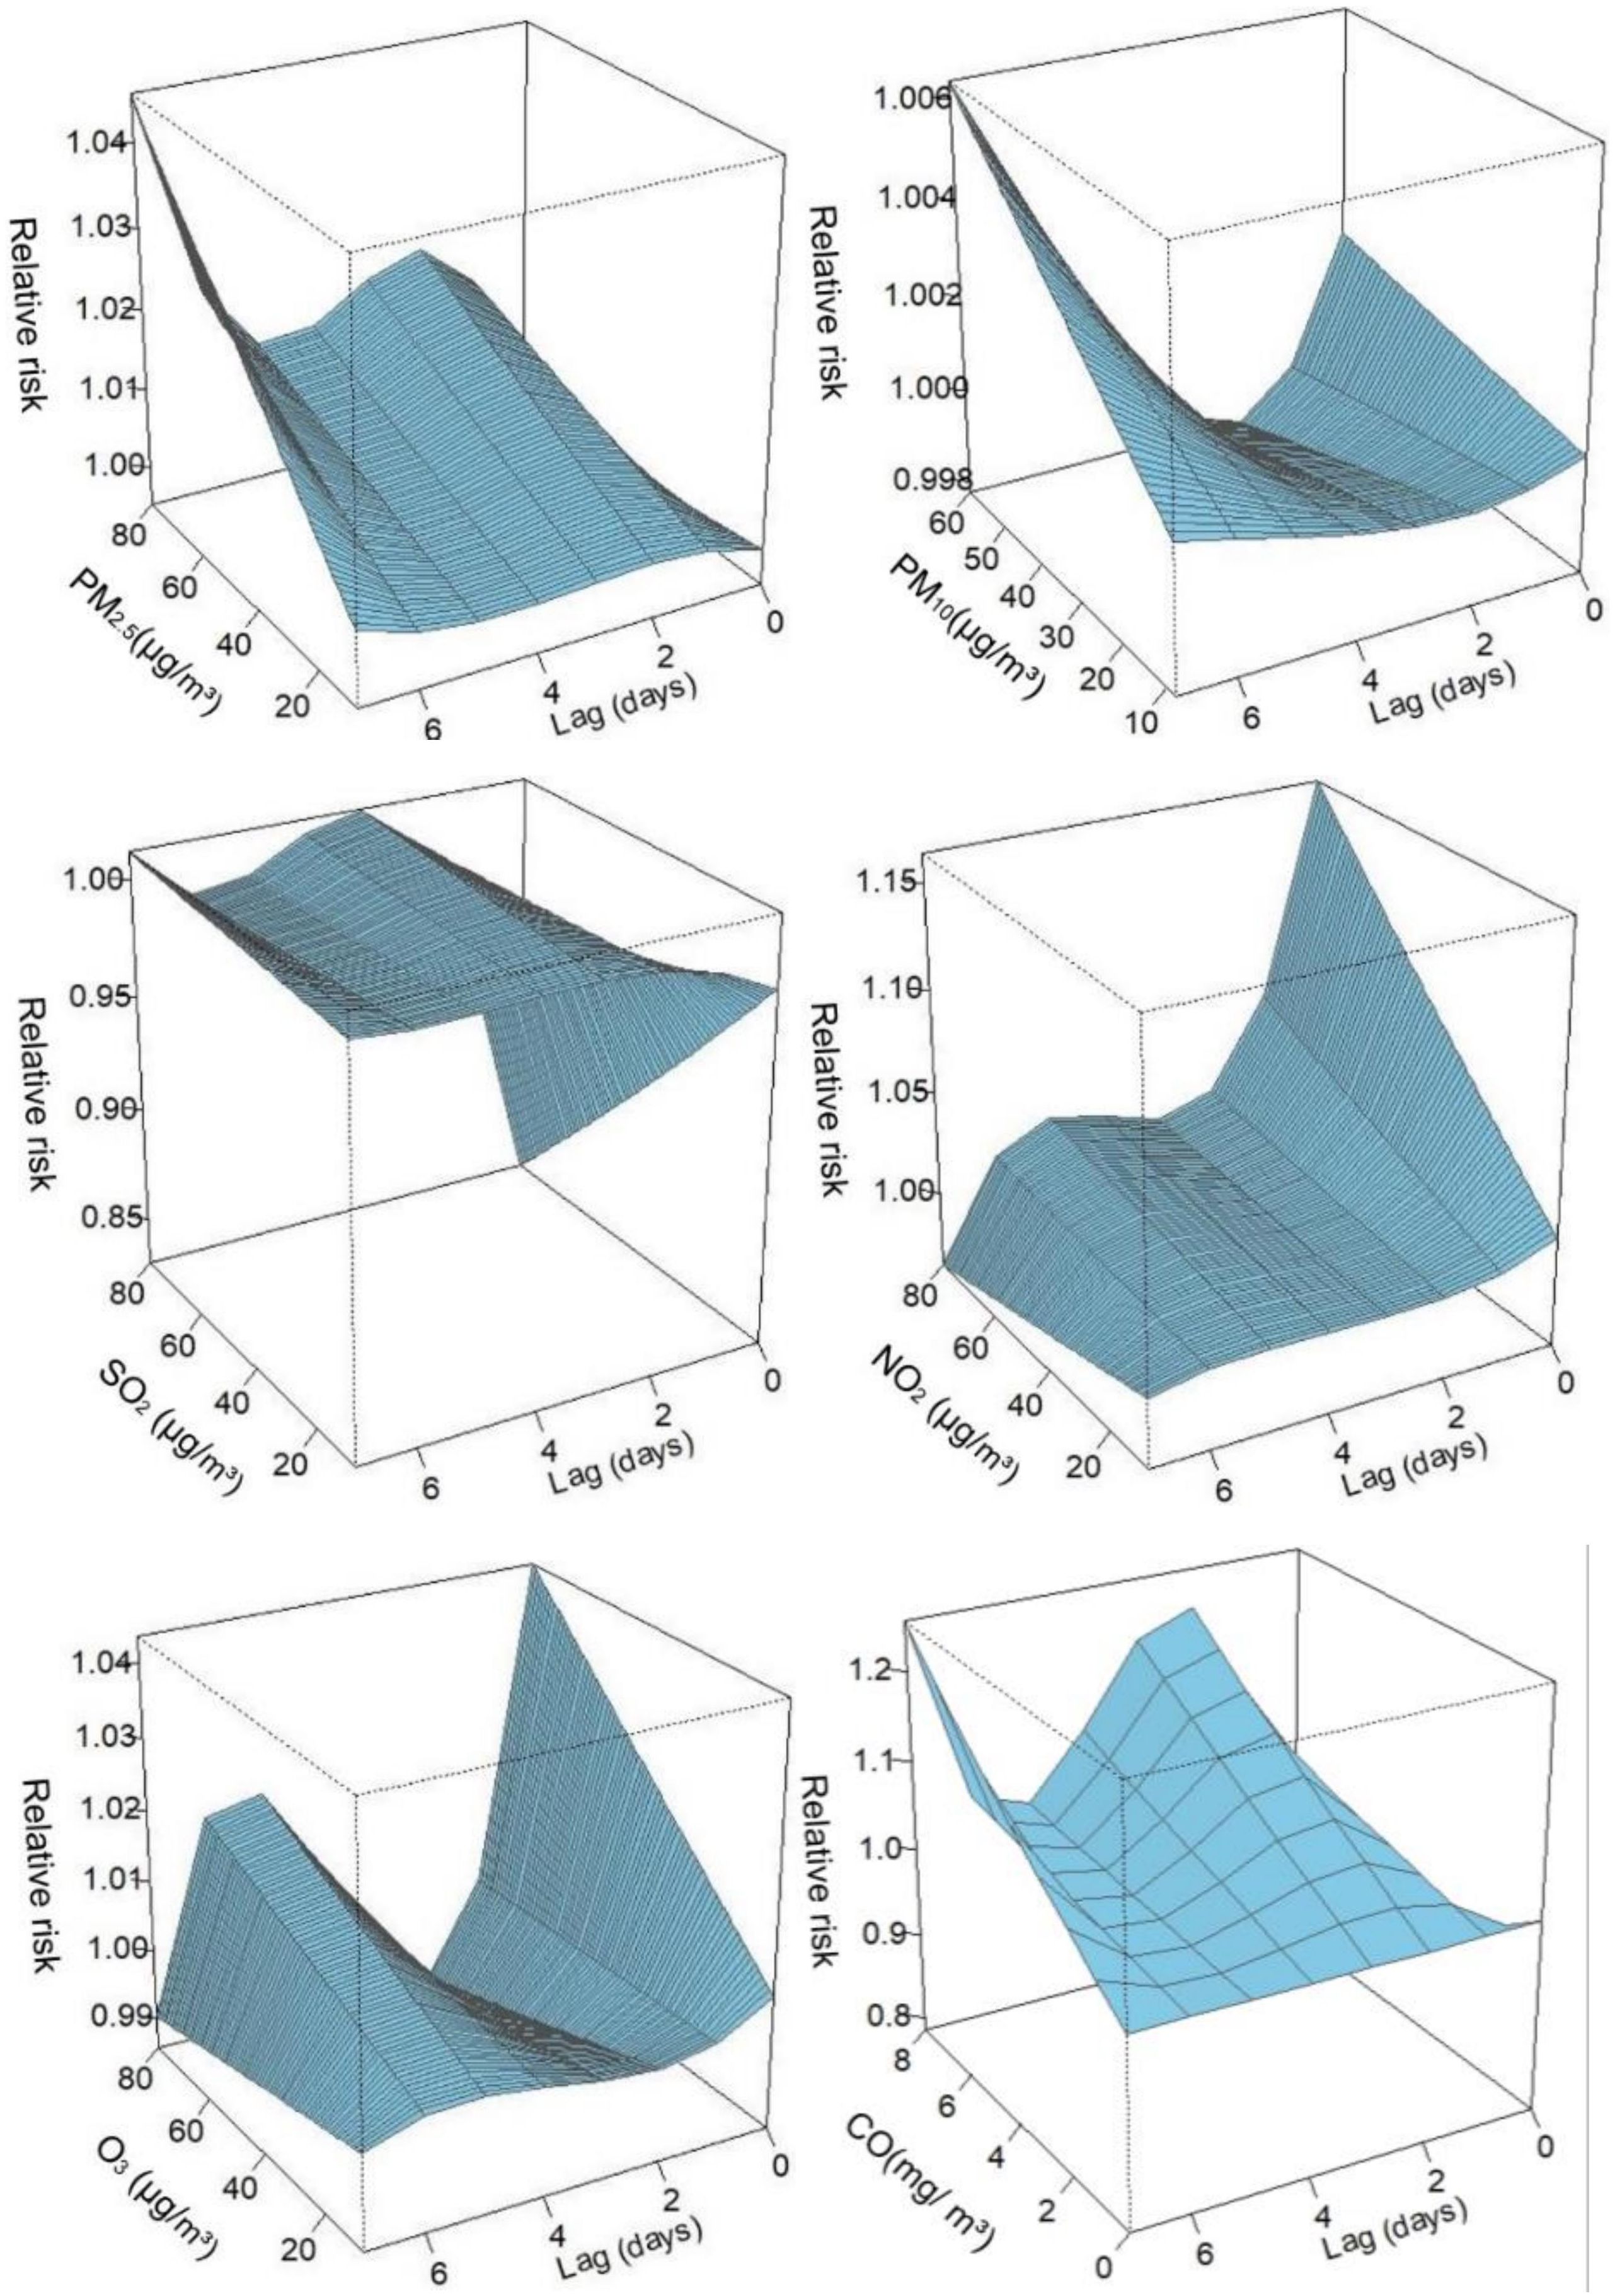
Figure 2. Three-dimensional graphs. PM2.5, aerodynamic diameter<2.5 μm; PM10, aerodynamic diameter<10 μm; SO2, sulfur dioxide; NO2, nitrogen dioxide; CO, carbon monoxide; O3, ozone.
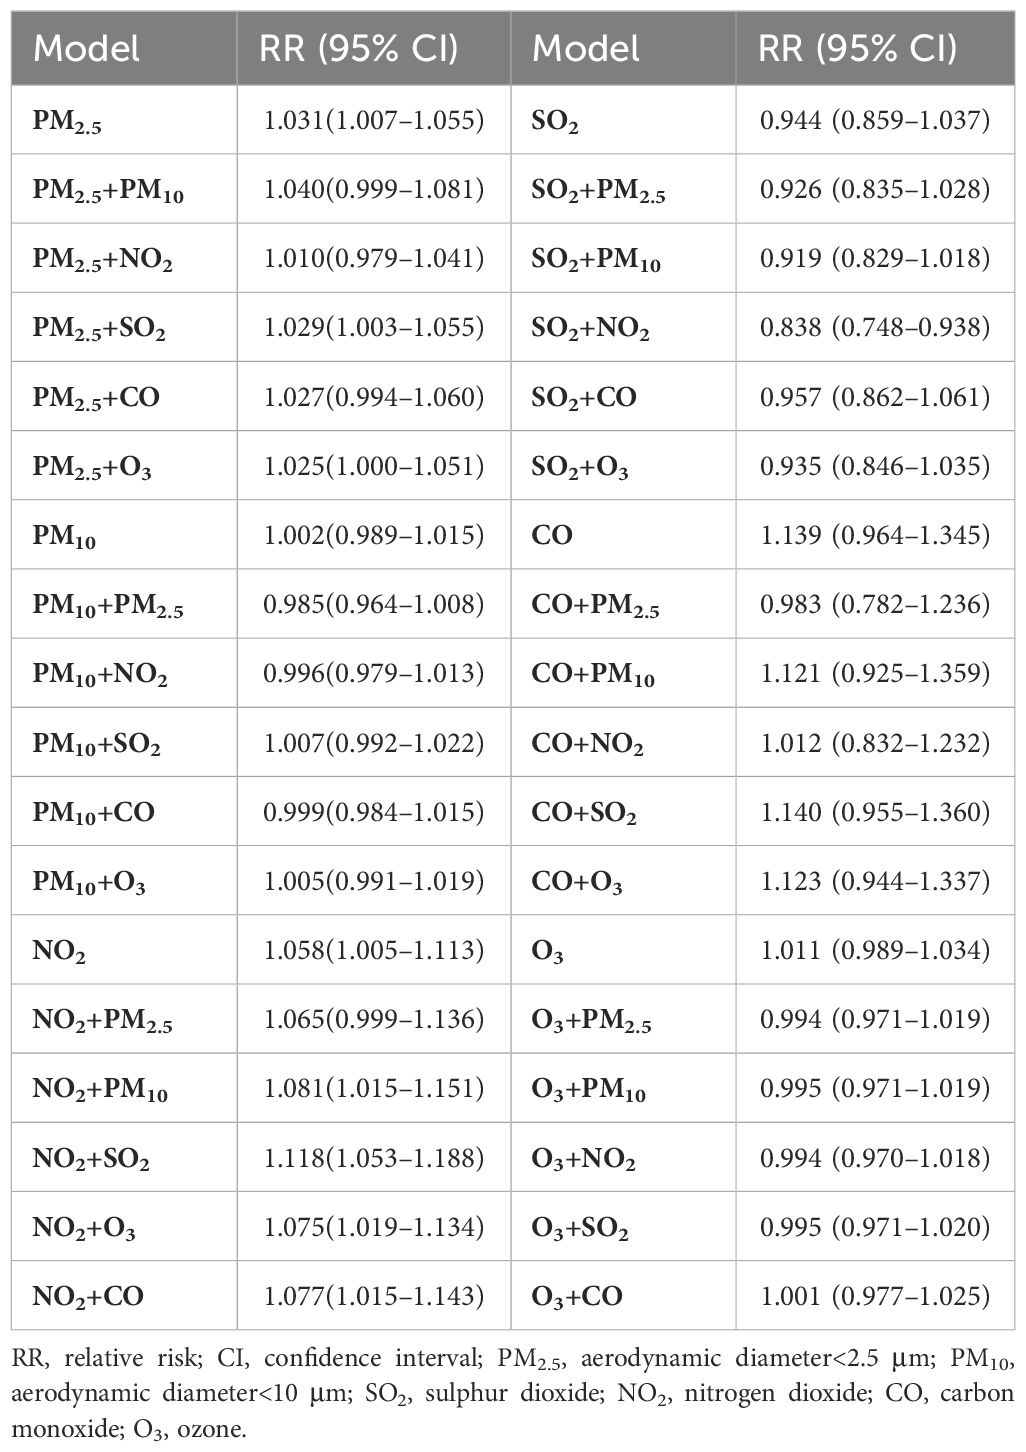
Table 2 shows the RR when exposed to the six air pollutants at different lag days, including single-day and cumulative lags. The single-day lag RR of PM2.5 was detected as significant at lag 1–lag 7. The cumulative lag RR for PM2.5 exhibited the greatest effect at lag 07 (RR=1.031; 95% CI: 1.007–1.056). Similarly, the effect of NO2 on the single-day lag RR was significant from lag 0–lag 6, and the strongest association of cumulative lag occurred at lag 06 (RR=1.067; 95% CI: 1.016–1.121). The single-day lag RR of CO was significant at lag 1–lag 7, with the highest effect of cumulative lag at lag 07 (RR=1.139; 95% CI: 0.964–1.345). Regarding O3, adverse effects of the single-day lag occurred at lag 4–lag 6, and the greatest cumulative effect estimation was observed at lag 06 (RR=1.013; 95% CI: 0.992–1.036). However, no correlation was observed between PM10 and SO2 and the risk of hospitalization for diabetes.
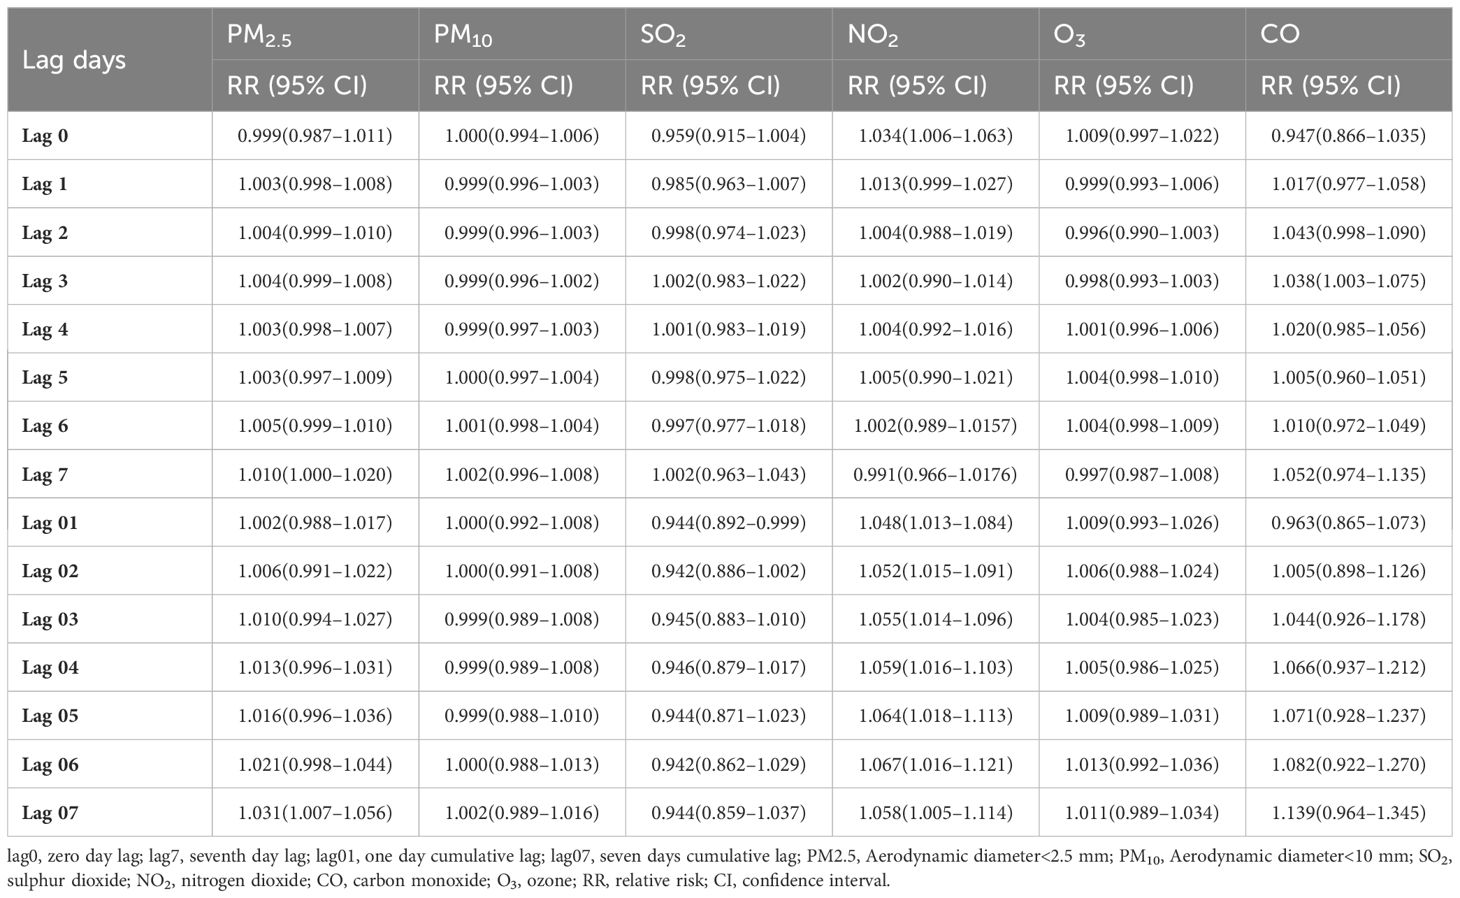
Table 2. Relative risk (RR) (95% confidence intervals [CIs]) of diabetes admissions with an increase of 10 μg/m3 in air pollutants (and 1 mg/m3 in carbon monoxide [CO]).
3.4 Association between pollutants, length of hospital stay, and hospital cost
Hospitalization costs and LOS varied among patients with diabetes under the influence of different pollutants, as quantified by the AF and attribution number (Table 3). Among the six pollutants, CO had the highest AF, reaching 10.8% and 10.41%, respectively, which resulted in an additional hospital cost of 10.41 million Chinese Yuan and 132,500 hospitalization days (Table 3). The AF of NO2 was also high, reaching 5.4% and 4.1%, respectively, leading to an increase of 5.2 million Chinese Yuan in hospital costs and 710,100 hospitalization days. In addition, PM2.5, PM10, and O3 were significantly associated with LOS and hospital costs, while SO2 was negatively correlated with hospital LOS and costs. Supplementary Tables S1 and S2 show the single-day lag RR and cumulative lag RR of hospital cost, LOS, and their CIs for the six different pollutants on varying lag days.

Table 3. Attributable fraction and attributable number of hospital cost and length of stay of patients with diabetes.
3.5 Subgroup analysis
The cumulative lagged RR of air pollution-related diabetes by sex stratification is depicted in Figure 3. The six air pollutants showed differences under the sex stratification, with different values for the associated RRs: PM2.5 at lag 07 (RR=1.045; 95% CI: 1.005–1.087), PM10 at lag07 (RR=1.018; 95% CI: 0.995–1.042), SO2 at lag 06 (RR=1.086; 95% CI: 0.935–1.262), NO2 at lag 07 (RR=1.134; 95% CI: 1.038–1.239), and CO at lag 07 (RR=1.258; 95% CI: 1.008–1.159). No significant associations were observed between O3, diabetes admissions, and sex.
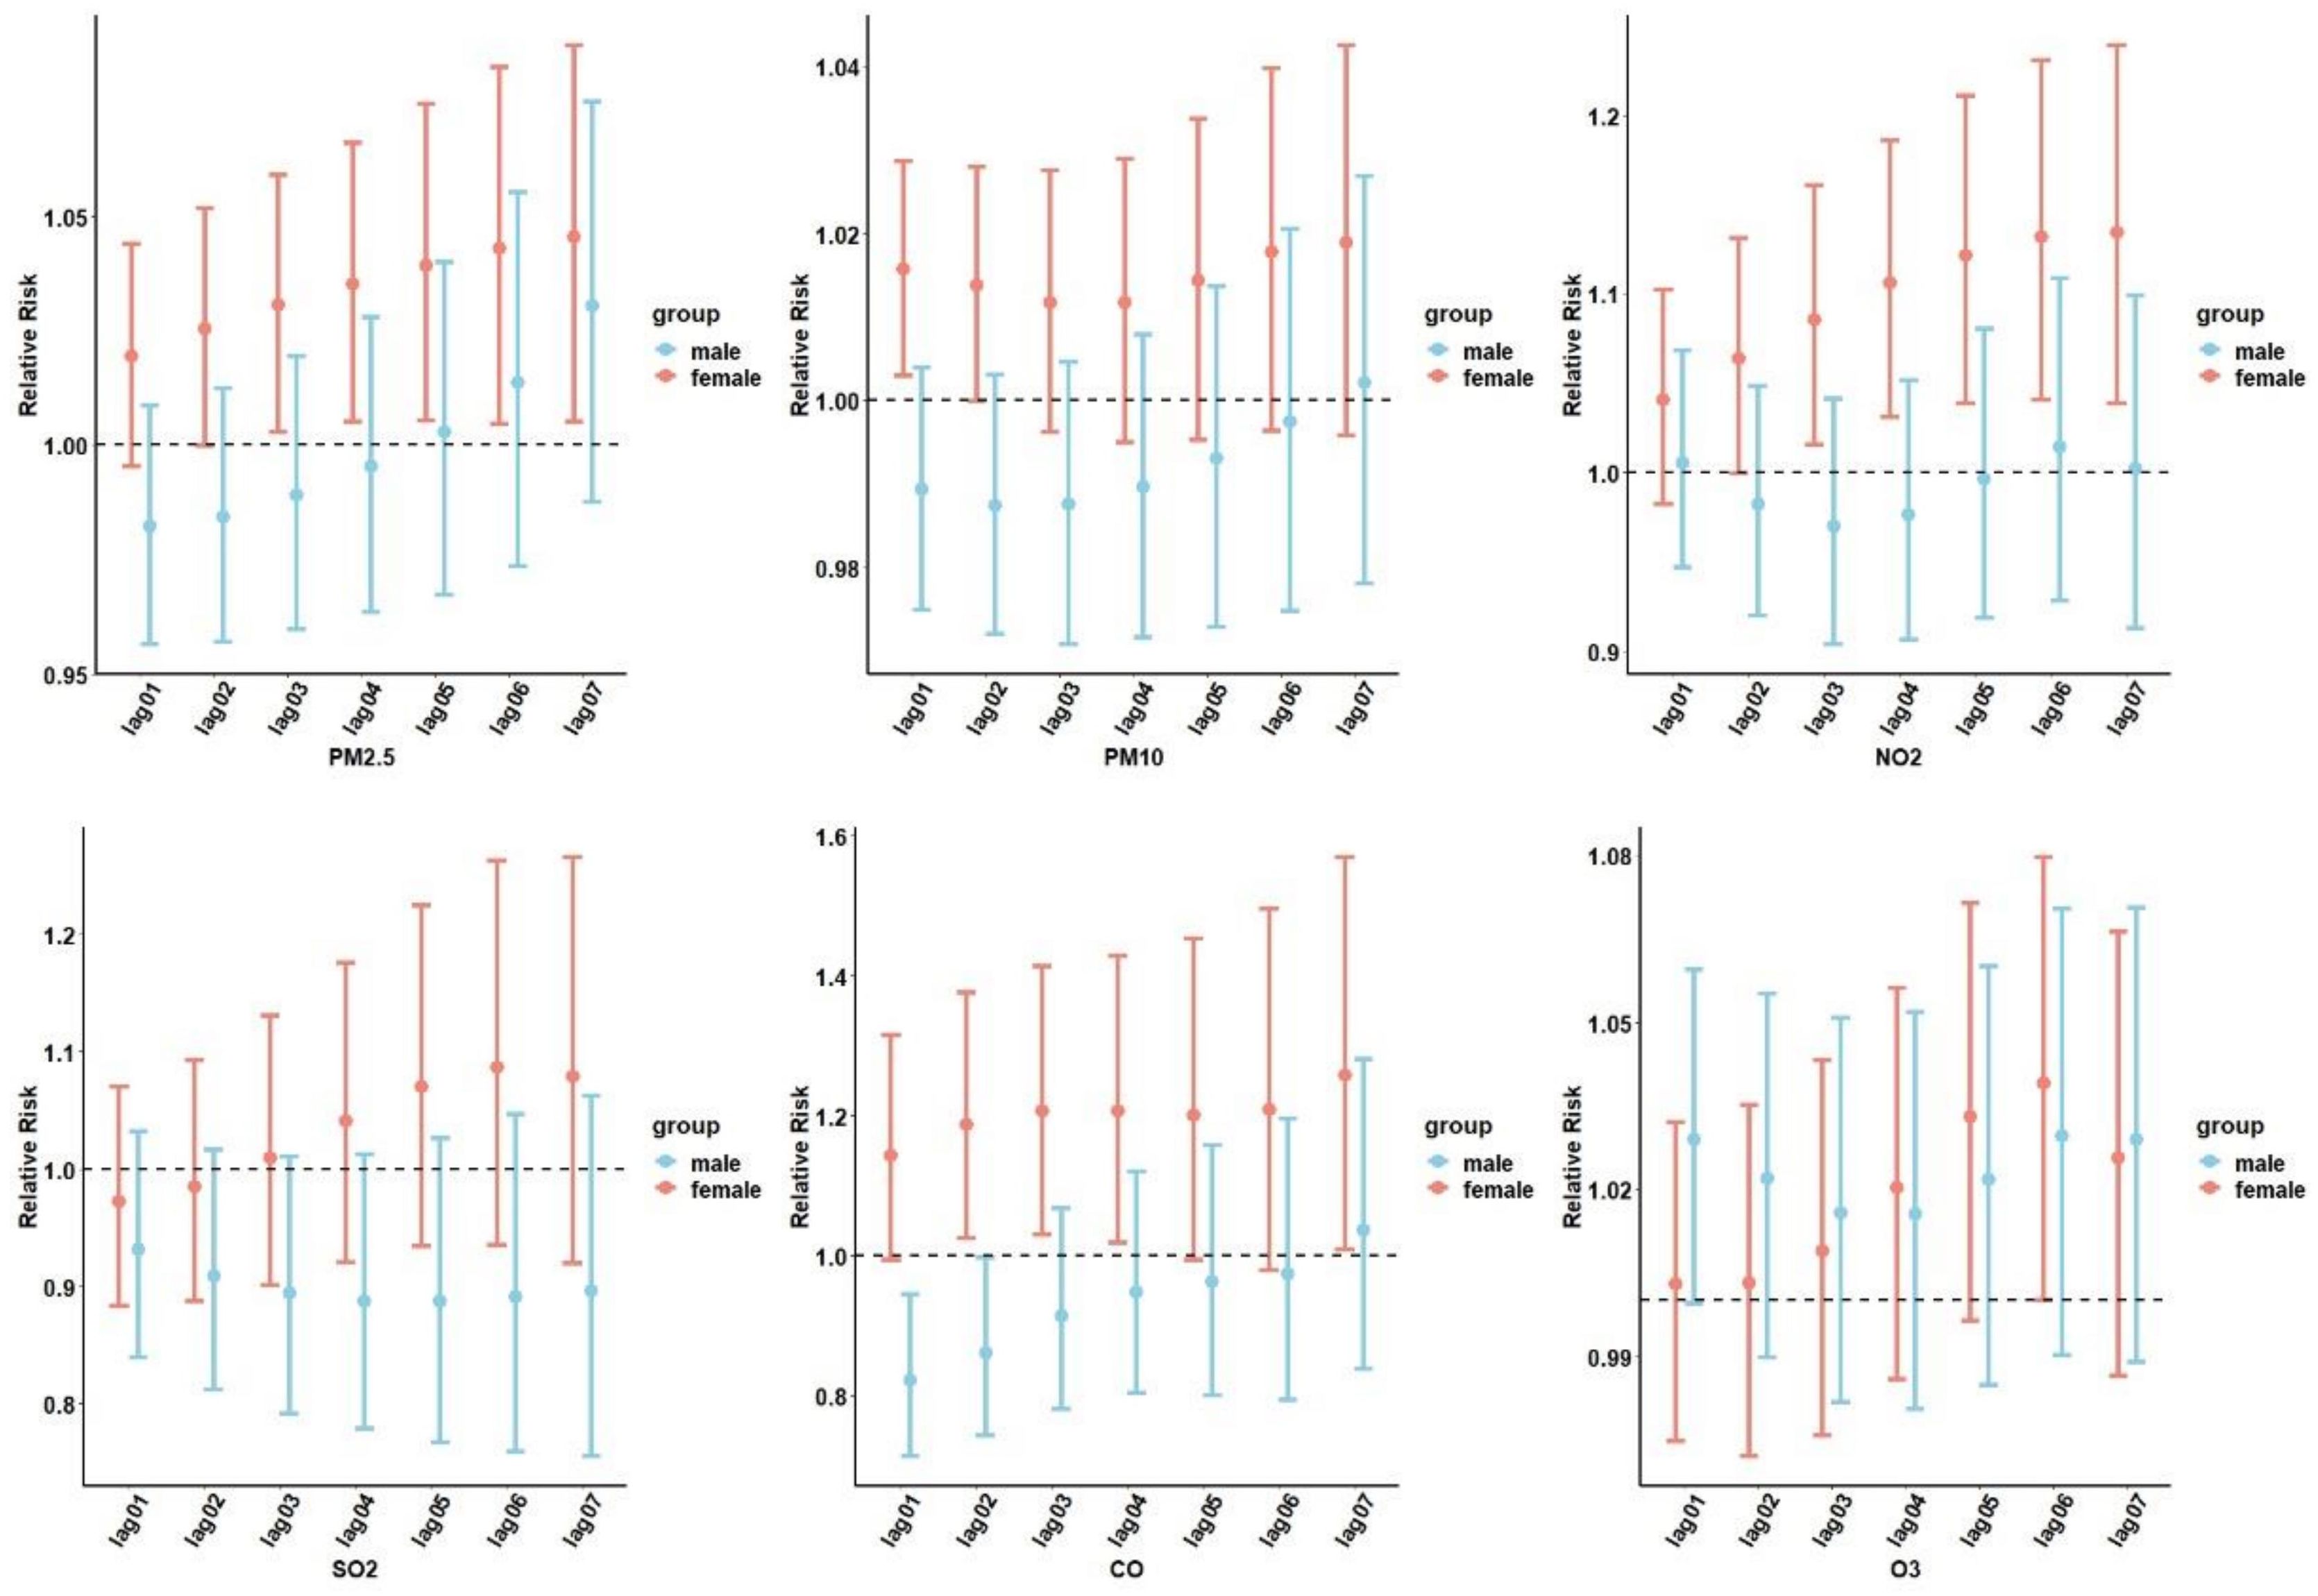
Figure 3. The cumulative lag relative risk (RR) (95% confidence interval [CI]) of hospital admissions for diabetes stratified by sex. PM2.5, aerodynamic diameter<2.5 μm; PM10, aerodynamic diameter<10 μm; SO2, sulfur dioxide; NO2, nitrogen dioxide; CO, carbon monoxide; O3, ozone.
We performed an analysis of the correlation between air pollution and diabetes under different age stratifications (Figure 4). People<65 years of age were more likely to be affected by O3 exposure and develop T2DM.
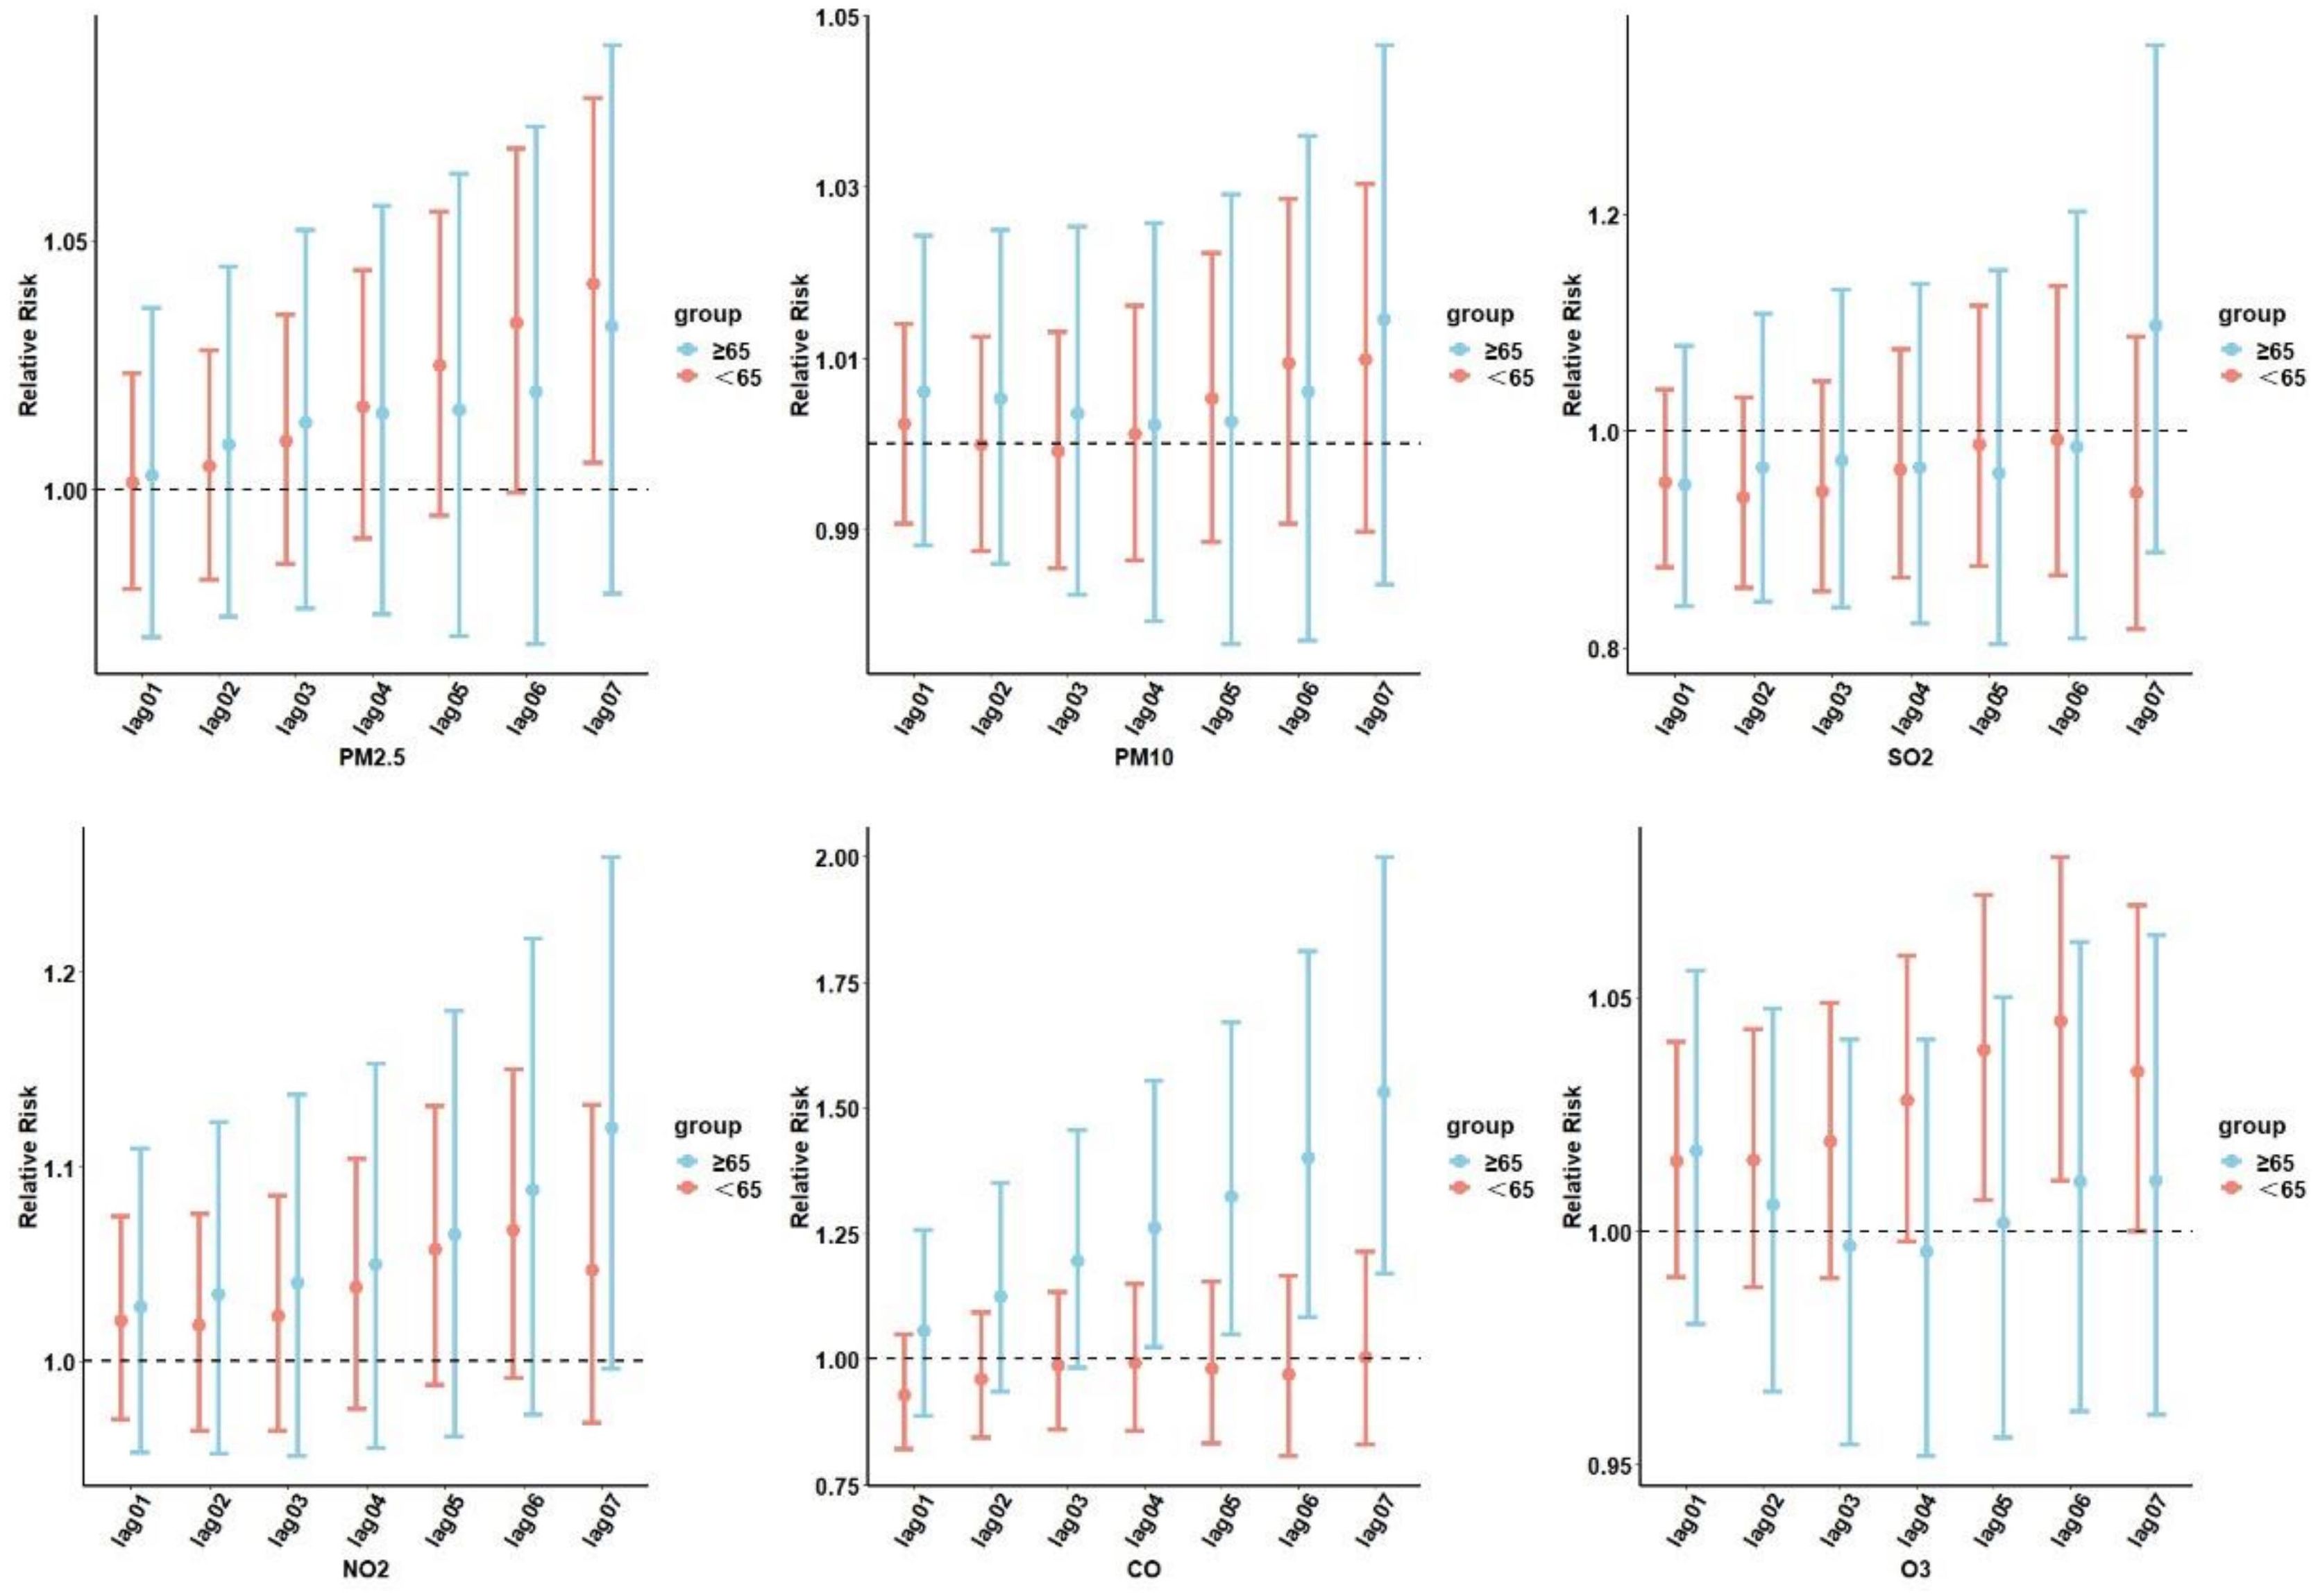
Figure 4. Cumulative lag RR with 95% CIs of diabetes-related hospital admissions associated with air pollutants at various lags stratified by age. PM2.5, aerodynamic diameter<2.5 μm; PM10, aerodynamic diameter<10 μm; SO2, sulfur dioxide; NO2, nitrogen dioxide; CO, carbon monoxide; O3, ozone.
Those who were ≥65 years old and were exposed to NO2 and CO were more likely to develop T2DM. At lag06, exposure to O3 was significantly associated with diabetes admissions for individuals<65 years of age (RR=1.044; 95% CI: 1.010–1.080). For the ≥65-years-old subgroups, the most significant association between CO and NO2 and diabetes hospitalization was observed on the sixth day, with NO2 (RR=1.087; 95% CI: 0.972–1.216) and CO (RR=1.529; 95% CI: 1.170–1.997). No age-related risk of diabetes was observed with PM2.5, PM10, and SO2 exposure.
Significant differences in diabetes effect estimates were found under the warm and cold season stratification (Table 4). The effect estimates of three significant pollutants, SO2, O3, and CO, had greater effect values in the cold season than in the warm season. The highest RRs (95% CI) for SO2, O3, and CO on diabetes hospital admission were observed at lag 07 with 1.059 (95% CI: 0.909–1.235), at lag 07 with 1.060 (95% CI: 0.961–1.170), and at lag 07 with 1.121 (95% CI: 0.859–1.463), respectively. However, PM2.5, PM10, and NO2 did not significantly affect hospital admissions across seasons.
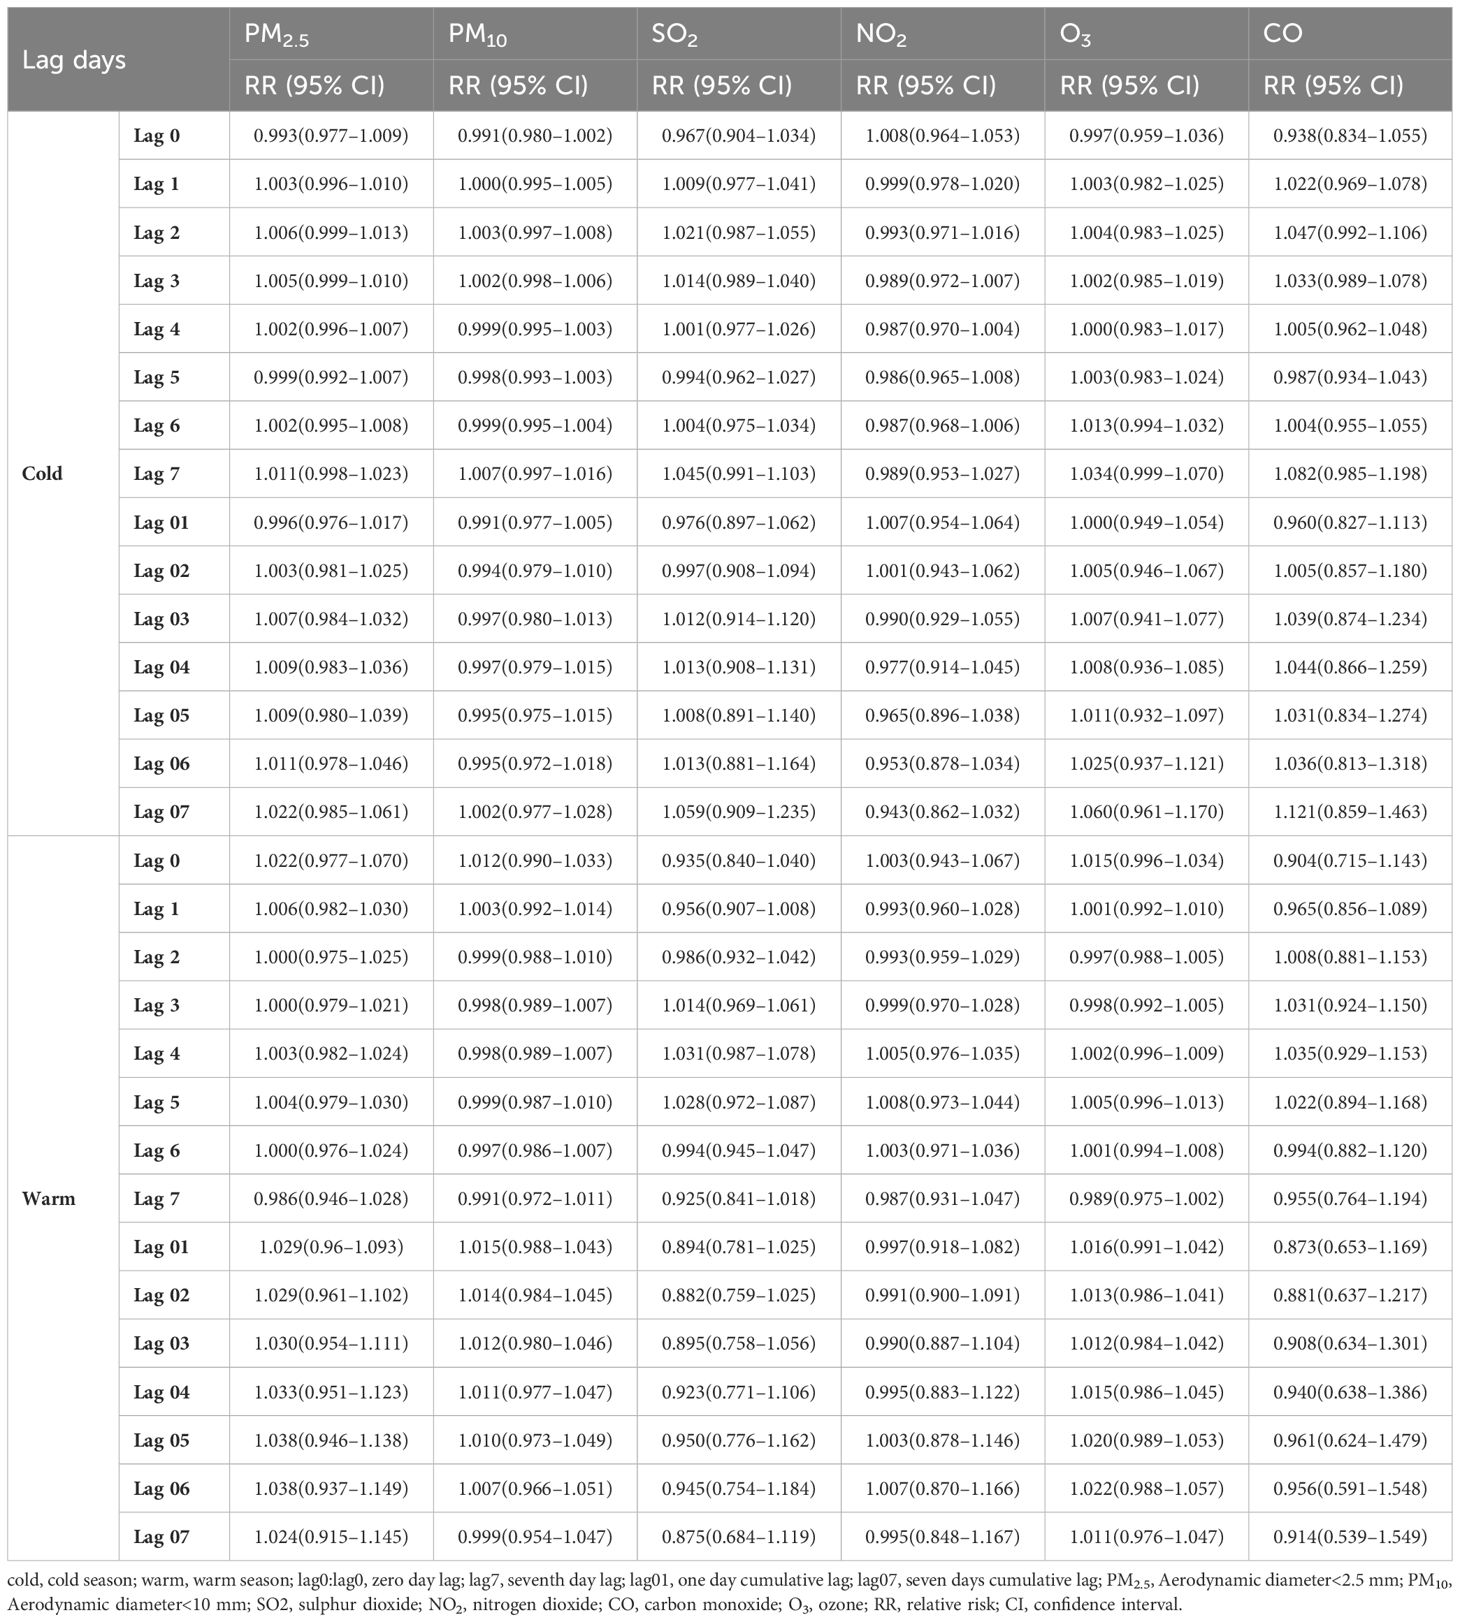
Table 4. RR (95% CIs) of diabetes admissions with an increase of 10 μg/m3 in air pollutants (and 1 mg/m3 in CO) according to the single-pollutant model by season.
Figure 5 presents the Spearman’s correlation analysis results between air pollutants and meteorological factors. There was a positive correlation between particulate pollutants and NO2, SO2, and CO, with fluctuating correlation coefficients of 0.48–0.87, and O3 was negatively associated with other air pollutants and humidity. Temperature was negatively correlated with all air pollutants except O3. Apart from PM2.5, CO, and temperature, all pollutants were negatively correlated with humidity.
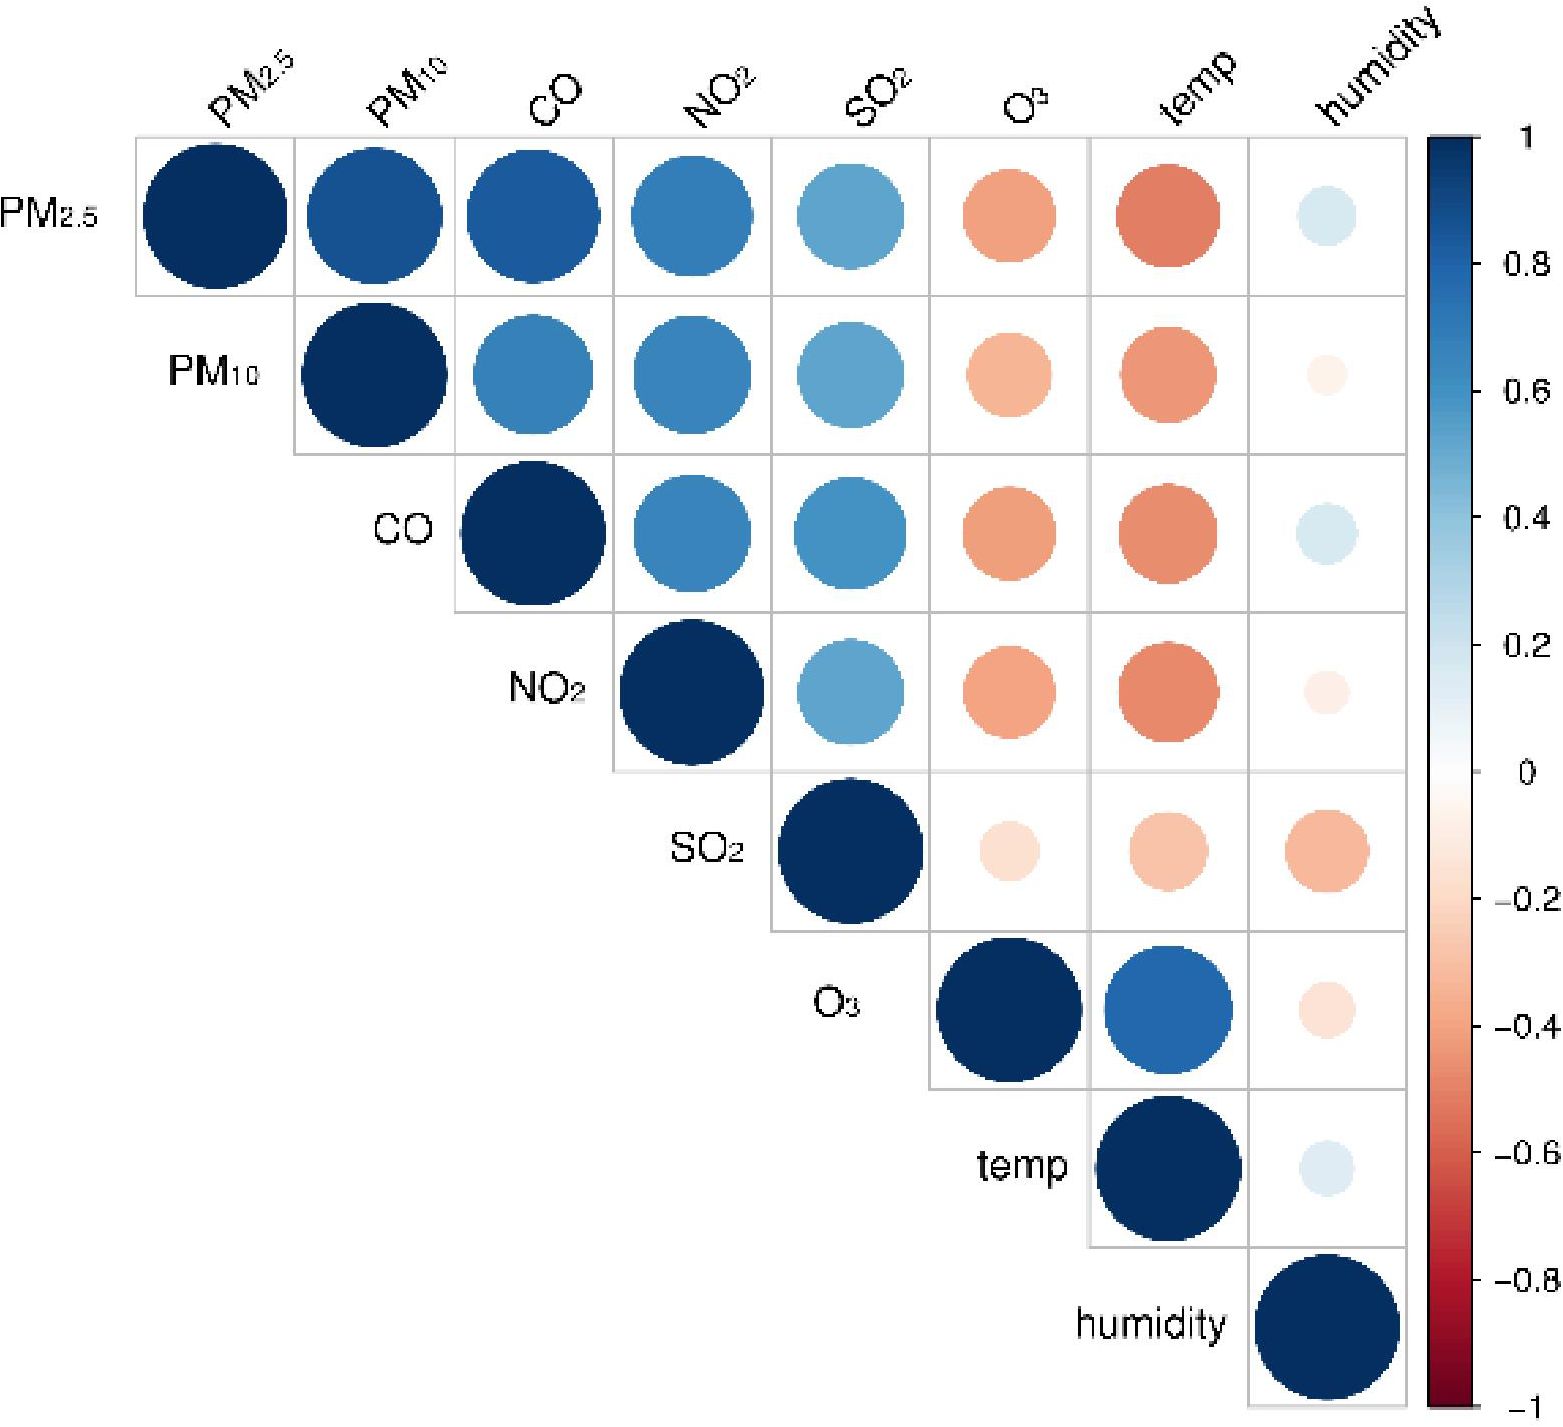
Figure 5. Spearman’s correlation analysis between air pollutants and meteorological variables. PM2.5, aerodynamic diameter<2.5 μm; PM10, aerodynamic diameter<10 μm; SO2, sulfur dioxide; NO2, nitrogen dioxide; CO, carbon monoxide; O3, ozone.
When analyzing a single air pollutant, each 10 μg/m3 increase in the concentration of particulate pollutants, NO2, and O3 increased the risk of diabetes by 3.1%, 0.2%, 5.8%, and 1.1%, respectively. The risk of hospitalization for diabetes increased by 13.9% for every 1 mg/m3 increase in CO concentration. In the double-pollution model, the RR of O3 adjusted for the other five air pollutants were all smaller than the single exposure RR of O3, which corresponded to the Spearman’s correlation coefficient. Table 5 demonstrates the risk of diabetes in the single-pollutant exposure and dual-pollutant models for each 10 μg/m3 (1 mg/m3) increase in air pollutant concentration. The trend of the double-pollution model aligned with the Spearman’s correlation coefficient, demonstrating the robustness of the impact estimates of the six pollutants.
To verify the robustness of the model, a sensitivity analysis was performed. The output values of the six different pollutants for 7 days of cumulative lag were calculated after making changes in the degrees of freedom for lag days and temperature. It was found that the output values of RR and 95% CIs of air pollution and T2DM hospitalization correlations at different degrees of freedom were within a relatively stable range (Supplementary Table S3).
4 Discussion
The DLNM was used to clarify the relationship between air pollution and diabetes admissions, LOS, and hospitalization expenses with respect to variables and lagged days. The findings indicated that PM2.5, NO2, CO, and O3 were positively correlated with T2DM hospitalizations, with varying effects across different lag days and subgroups. In the single-pollution model, we found that each ten-unit increase in PM2.5, NO2, and O3 and each unit increase in CO was significantly associated with diabetes, with RR values of 1.031 (1.007–1.056), 1.058 (1.005–1.114), 1.011 (0.989–1.034), and 1.139 (0.964–1.345), respectively. Similarly, a previous study found that PM2.5 and NO2 was positively associated with the risk of death due to diabetes in the United States, whereas no association was observed for O3 (28, 29). Song et al. (29) demonstrated that each ten-unit increase in PM2.5, PM10, SO2, and NO2 and each unit increase in CO corresponded to an increase in T2DM hospitalization. Moreover, Paul et al. (30) observed significant associations between T2DM and PM2.5 and O3. However, our study depicted a limited relationship between PM10 levels and the prevalence of diabetes, contrasting with the results of most previous studies. Thus, further research is required to confirm these findings.
There is limited research on the correlation between air pollution and hospital costs and LOS due to diabetes mellitus. We observed that air pollutants other than SO2 were positively correlated with LOS and hospital costs for patients with diabetes, resulting in a significant economic burden. Notably, neglecting the importance of health during development results in higher future costs (31). Therefore, the relevant authorities and medical institutions should pay attention to the impact of air pollution and take appropriate measures to reduce the economic costs and health impacts of air pollution.
The seasonal subgroup analysis depicted correlations between diabetes prevalence and PM10, SO2, O3, and CO during the cold season. Studies have demonstrated that older adults and individuals in cold seasons are more susceptible to outdoor air pollutants (32). Air pollution arises from a combination of anthropogenic emissions and meteorological factors (33, 34). Focusing solely on the individual effects of pollutants or meteorological factors may lead to an oversight of the overall health effects of the mixture. Air pollutants impact both health and climate; seasonal and regional differences may change the concentration of particulate matter, consequently affecting the correlation between air pollution and coronary heart disease (35). Seasonal transitions (from winter to summer) and gradually improving meteorological factors help reduce the impact of anthropogenic emissions on air pollution (36).
The sex-stratified subgroup analysis revealed that females were more susceptible to air pollution in terms of developing T2DM than males were. This may be attributed to the distinct physiological structure of females. Air pollution affects females more, possibly because of sex-related biological differences, such as hormones, body shape, diet, and activity patterns (37). Furthermore, the airway diameters in females are different to those in males, facilitating the deposition of PM2.5 particles (38).
In the age-stratified analysis, the effect of air pollution in younger people was slightly lower than that in individuals aged >65 years. This was mainly observed with NO2 and CO. Abnormal glucose metabolism caused by air pollution in older adults may have led to this result (39). Therefore, air pollution may be a risk factor for diabetes in older individuals. In contrast, O3 exhibited the opposite effect, potentially owing to differences in outdoor activity time, with the increased engagement of younger people in outdoor activities and thus increased inhalation of air pollutants potentially explaining the stronger effect of air pollutants on this group (40). More walking and higher levels of greenery are negatively related with T2DM (7). However, previous research by Kim et al. showed that older people exposed to air pollution have a lower risk of diabetes during moderate- and high-intensity physical activities (41). Furthermore, studies have demonstrated that healthy physical activity habits can reduce the risk of T2DM, even in the presence of PM2.5 exposure (42). However, further research is required to validate this assertion.
Air pollution could constitute a risk factor for T2DM development (16). There are various pathophysiologic mechanisms by which air pollution may contribute to diabetes. Previous studies have identified potential pathological pathways involved in air pollution, including insulin resistance (43–45), β-cell dysfunction, neurohormonal dysfunction (46), endothelial dysfunction (47), systemic inflammation, and alterations in the composition and diversity of gut microbiota (48). Greater exposure to air pollution is associated with increased circulating levels of adiponectin, interleukin-1 receptor antagonists, and high-sensitivity C-reactive protein (49). Hypothesized effects of air pollutants encompass impaired endothelial function, elevated systemic inflammation, mitochondrial dysfunction, and oxidative stress, which may contribute to the development of T2DM (50). Furthermore, air pollutants may modulate inflammatory responses in the homeostatic centers of the brain and may modulate hypothalamic mechanisms that regulate appetite and satiety (51). In addition, prolonged exposure to PM10 and NO2 pollution is positively related with glycated hemoglobin (52), and PM2.5 pollution has resulted in a massive T2DM burden worldwide (53). Figure 6 shows the mechanisms underlying the association between air pollution and T2DM.
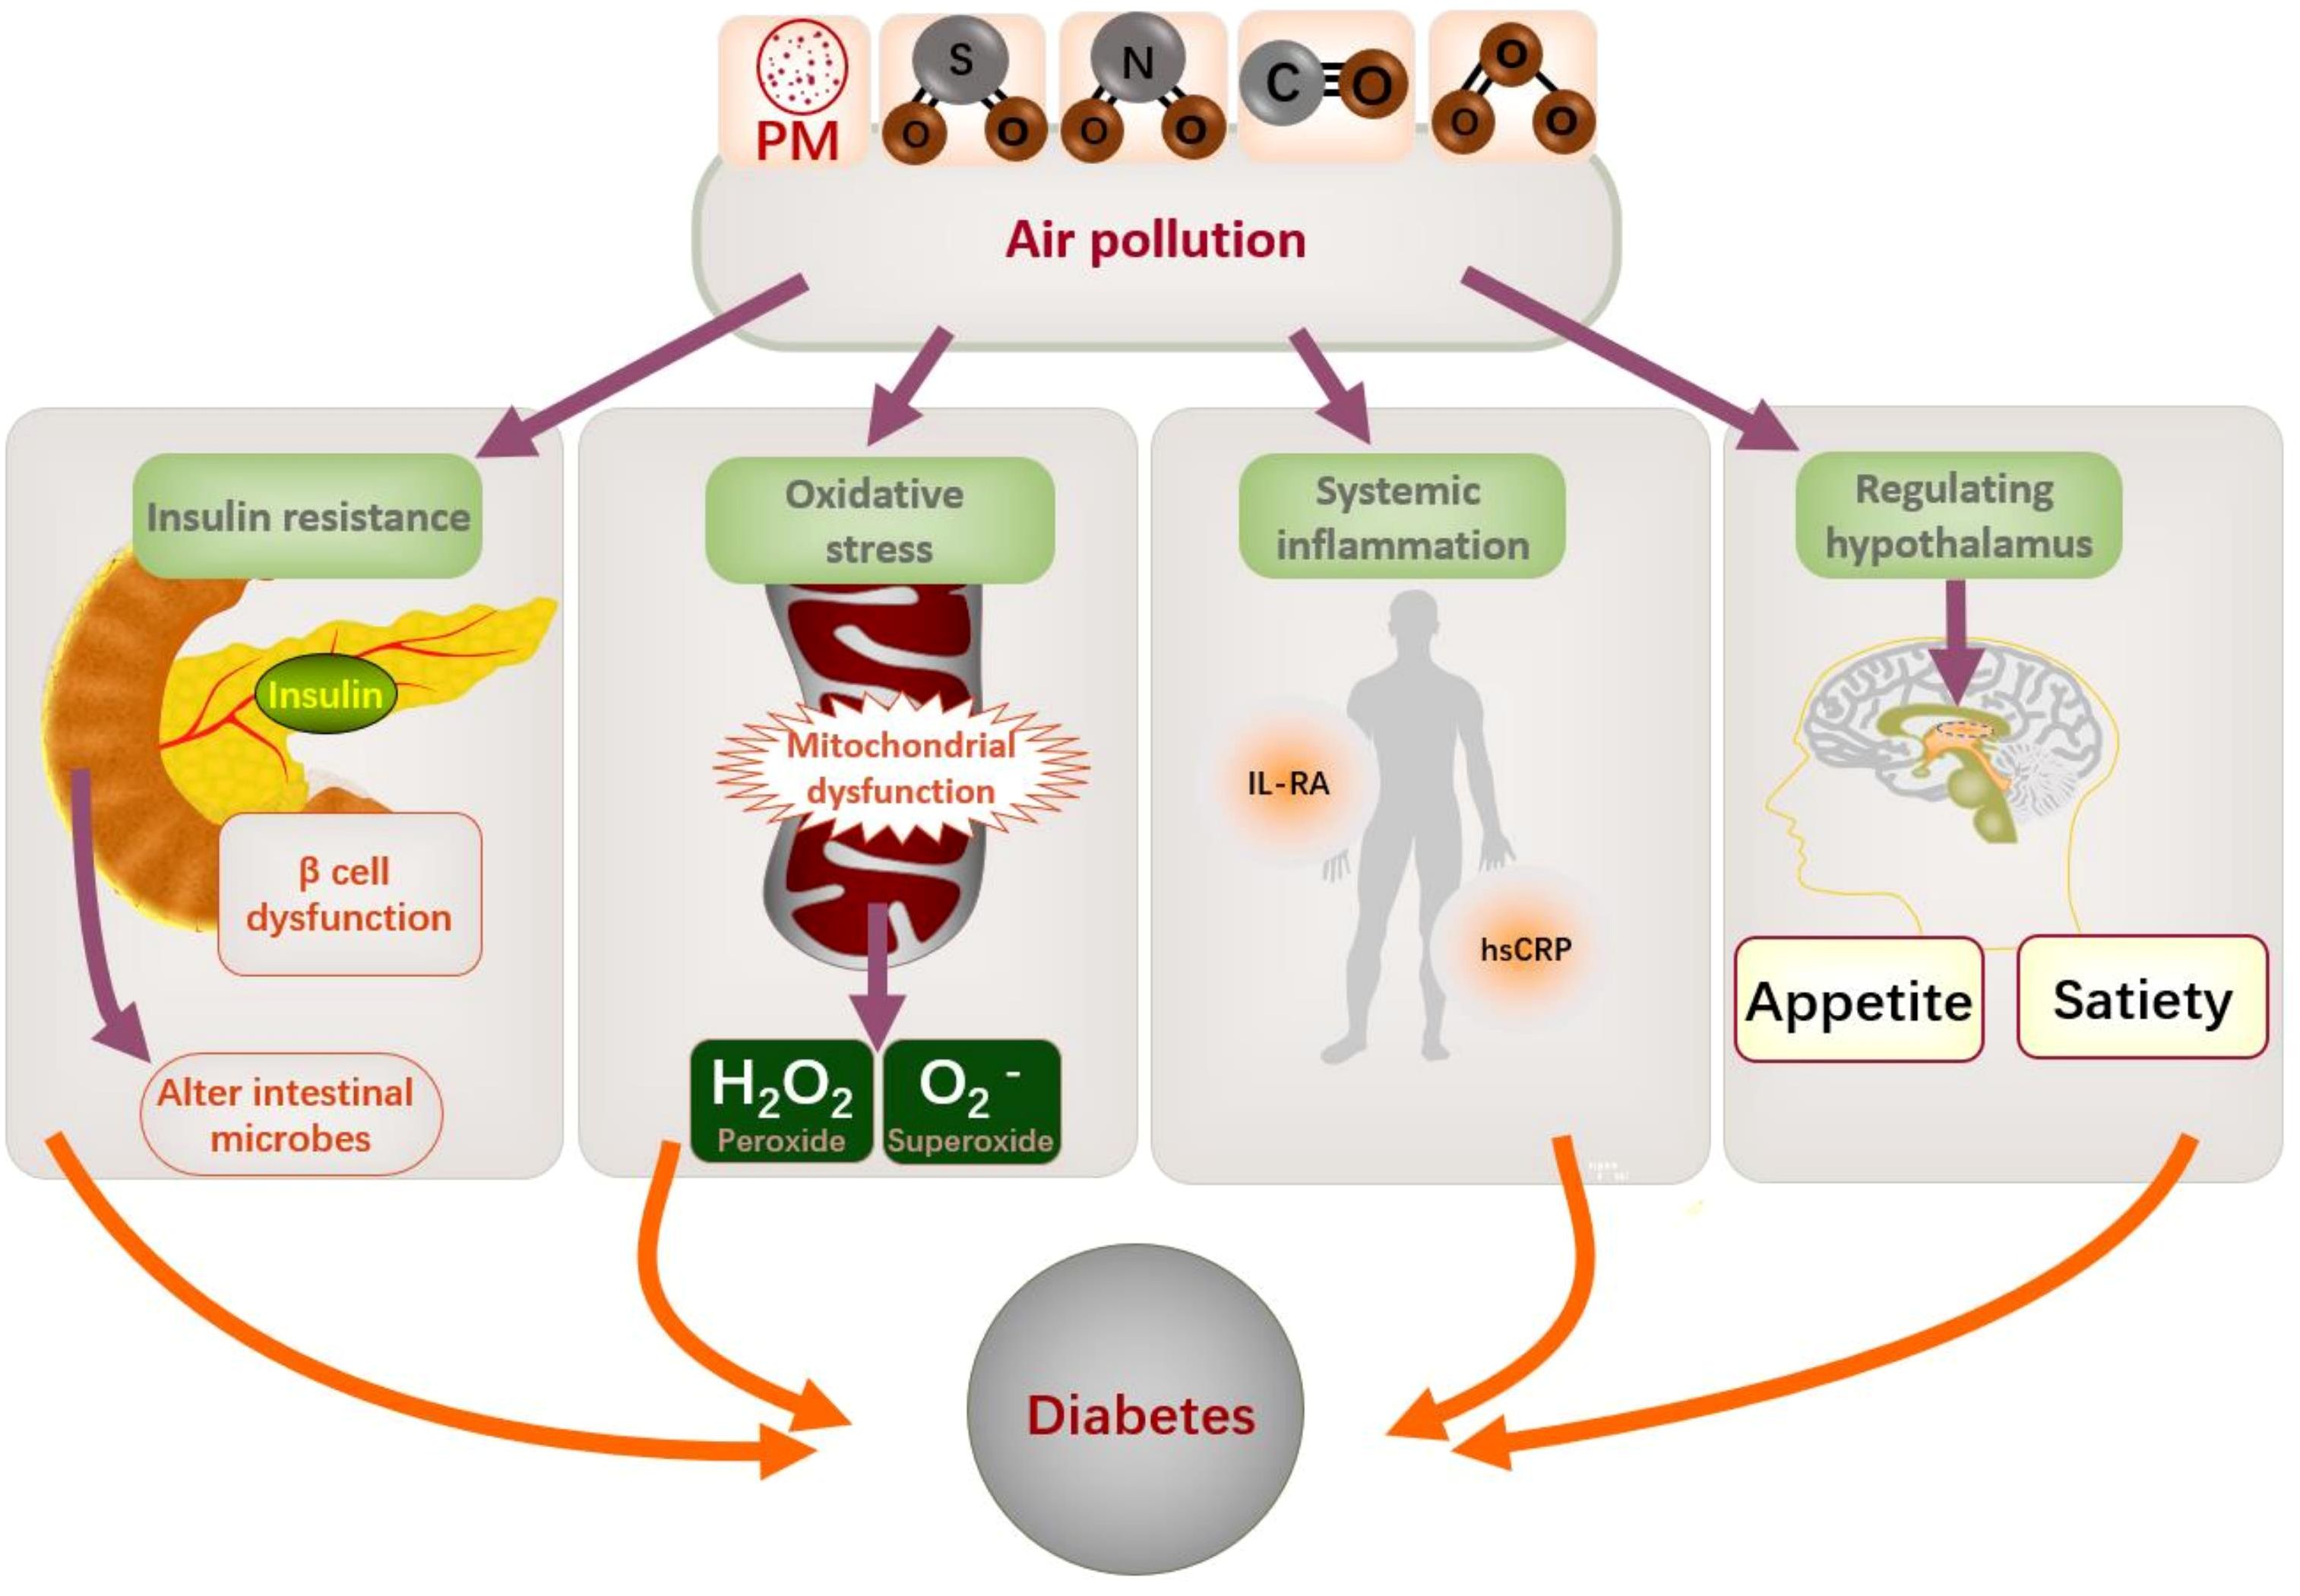
Figure 6. Mechanism of air pollution and diabetes. PM, particulate matter; IL-RA, interleukin receptor antagonists; hsCRP: high-sensitivity C-reactive protein.
It is well known that wearing a mask can effectively avoid exposure to air pollution. Antioxidants also play an important role in avoiding the damage caused by air pollution. A diet that promotes oxidation and inflammation will strengthen the harmful effects of air pollutants on the body (54), while a healthy diet, adhering to the Mediterranean diet and taking antioxidants from fruits and vegetables can reduce the burden of diseases caused by air pollution (54, 55). A healthy diet can effectively prevent T2DM (56). Adequate intake of antioxidants such as vitamins C and E through diet can reduce diabetes caused by air pollution (57). In addition to the common air pollution such as particulate matter, toxic environmental substances also endanger our health, such as poisons caused by gasoline tail gas. Studies have shown that the intervention of antioxidant vitamin E can restore the airway injury of rats exposed to poisons (58). Therefore, intake of antioxidants is beneficial to health.
In Pr Jean-Jacques Laffont’s book The Economics of Uncertainty and Information, the influence of taxation on agents inspires us that increasing the taxation of polluting enterprises may reduce the willingness of enterprises to invest, which is not conducive to economic development. Conversely, if the government introduces policies to improve the air pollution caused by factories and other enterprises, and gives tax relief to some environmental protection enterprises, air pollution may be further prevented.
This study had some limitations. First, the patients with diabetes in this study did not include all patients in Xinxiang, potentially resulting in the oversight of individuals with insignificant clinical symptoms and leading to underestimation. Second, this study analyzed data collected over 5 years, possibly compromising the model’s stability. Third, this study was observational and ecological, preventing us from making causal inferences, despite our efforts to reduce confounding bias through various methods. This study also had several strengths. First, we used the DLNM to more accurately reflect the lagged relationship between air pollution and disease. Second, we measured several aspects of the correlation between air pollution and T2DM, including hospital admissions, LOS, and hospital costs, which may lead to a greater understanding of the economic impact and social pressures of the disease.
In conclusion, air pollutants were positively related with hospitalization rates, expenses, and LOS in patients with diabetes, particularly PM2.5, NO2, O3, and CO. This association was also affected by sex, age, and season. These findings may guide efforts to prevent T2DM and highlight the multiple benefits of improving the air quality in Xinxiang and other highly polluted regions.
Data availability statement
The original contributions presented in the study are included in the article/Supplementary Material. Further inquiries can be directed to the corresponding author.
Ethics statement
The studies involving humans were approved by Ethics Committee of the First Affiliated Hospital of Xinxiang Medical College. The studies were conducted in accordance with the local legislation and institutional requirements. The participants provided their written informed consent to participate in this study.
Author contributions
ZH: Writing – review & editing, Writing – original draft. YW: Writing – review & editing, Methodology. GZ: Writing – review & editing, Data curation. FL: Writing – original draft, Data curation. ZC: Writing – review & editing, Data curation. SS: Writing – review & editing, Data curation. NX: Writing – review & editing, Data curation. YC: Writing – original draft, Data curation. LW: Writing – original draft, Data curation.
Funding
The author(s) declare that financial support was received for the research, authorship, and/or publication of this article. This work was supported by the Key Specialized Research and Development Breakthrough in Henan Province no. 222102310442 (GZ) and no. 222102310631 (ZC) and the Natural Science Fund of Henan Province (no. 232300420063) (GZ). GZ and ZC are doctors in the Department of Cardiology of the First Affiliated Hospital of Xinxiang Medical College and members of the Life Science Research Center of the First Affiliated Hospital of Xinxiang Medical College.
Acknowledgments
We would like to thank Editage (www.editage.cn) for English language editing.
Conflict of interest
The authors declare that the research was conducted in the absence of any commercial or financial relationships that could be construed as a potential conflict of interest.
Publisher’s note
All claims expressed in this article are solely those of the authors and do not necessarily represent those of their affiliated organizations, or those of the publisher, the editors and the reviewers. Any product that may be evaluated in this article, or claim that may be made by its manufacturer, is not guaranteed or endorsed by the publisher.
Supplementary material
The Supplementary Material for this article can be found online at: https://www.frontiersin.org/articles/10.3389/fendo.2024.1482063/full#supplementary-material.
References
1. GBD 2019 Diseases and Injuries Collaborators. Global burden of 369 diseases and injuries in 204 countries and territories, 1990–2019: a systematic analysis for the global burden of disease study 2019. Lancet. (2020) 396:1204–22. doi: 10.1016/S0140-6736(20)30925-9
2. Zheng Y, Ley SH, Hu FB. Global aetiology and epidemiology of type 2 diabetes mellitus and its complications. Nat Rev Endocrinol. (2018) 14:88–98. doi: 10.1038/nrendo.2017.151
3. Emerging Risk Factors C. Life expectancy associated with different ages at diagnosis of type 2 diabetes in high-income countries: 23 million person-years of observation. Lancet Diabetes Endocrinol. (2023) 11:731–42. doi: 10.1016/S2213-8587(23)00223-1
4. Li Y, Wang DD, Ley SH, Vasanti M, Howard AG, He Y, et al. Time trends of dietary and lifestyle factors and their potential impact on diabetes burden in China. Diabetes Care. (2017) 40:1685–94. doi: 10.2337/dc17-0571
5. Shin MK, Kim KN. Association between long-term air pollution exposure and development of diabetes among community-dwelling adults: modification of the associations by dietary nutrients. Environ Int. (2023) 174:107908. doi: 10.1016/j.envint.2023.107908
6. Eze IC, Hemkens LG, Bucher HC, Hoffmann B, Schindler C, Künzli N, et al. Association between ambient air pollution and diabetes mellitus in Europe and North America: systematic review and meta-analysis. Environ Health Perspect. (2015) 123:381–9. doi: 10.1289/ehp.1307823
7. Dendup T, Feng X, Clingan S, Astell-Burt T. Environmental risk factors for developing type 2 diabetes mellitus: a systematic review. Int J Environ Res Public Health. (2018) 15:78. doi: 10.3390/ijerph15010078
8. GBD 2019 Cancer Risk Factors Collaborators. The global burden of cancer attributable to risk factors, 2010–19: a systematic analysis for the global burden of disease study 2019. Lancet. (2022) 400:563–91. doi: 10.1016/S0140-6736(22)01438-6
9. Yusuf S, Joseph P, Rangarajan S, Islam S, Mente A, Hystad P, et al. Modifiable risk factors, cardiovascular disease, and mortality in 155 722 individuals from 21 high-income, middle-income, and low-income countries (PURE): a prospective cohort study. Lancet. (2020) 395:795–808. doi: 10.1016/S2213-8587(23)00361-3
10. Wu G, Cai M, Wang C, Zou H, Wang X, Hua J, et al. Ambient air pollution and incidence, progression to multimorbidity and death of hypertension, diabetes, and chronic kidney disease: a national prospective cohort. Sci Total Environ. (2023) 881:163406. doi: 10.1016/j.scitotenv.2023.163406
11. Shan A, Shan A, Zhang Y, Zhang LW, Chen X, Li X, et al. Associations between the incidence and mortality rates of type 2 diabetes mellitus and long-term exposure to ambient air pollution: a 12-year cohort study in northern China. Environ Res. (2020) 186:109551. doi: 10.1016/j.envres.2020.109551
12. Li R, Cai M, Qian ZM, Wang X, Zhang Z, Wang C, et al. Ambient air pollution, lifestyle, and genetic predisposition associated with type 2 diabetes: findings from a national prospective cohort study. Sci Total Environ. (2022) 849:157838. doi: 10.1016/j.scitotenv.2022.157838
13. Sorensen M, Poulsen AH, Hvidtfeldt UA, Frohn LM, Ketzel M, Christensen JH, et al. Exposure to source-specific air pollution and risk for type 2 diabetes: a nationwide study covering Denmark. Int J Epidemiol. (2022) 51:1219–29. doi: 10.1093/ije/dyac040
14. Rao X, Patel P, Puett R, Rajagopalan S. Air pollution as a risk factor for type 2 diabetes. Toxicol Sci. (2015) 143:231–41. doi: 10.1093/toxsci/kfu250
15. Lockwood AH. Diabetes and air pollution. Diabetes Care. (2002) 25:1487–8. doi: 10.2337/diacare.25.8.1487
16. Liu F, Chen G, Huo W, Wang C, Liu S, Li N, et al. Associations between long-term exposure to ambient air pollution and risk of type 2 diabetes mellitus: a systematic review and meta-analysis. Environ pollut. (2019) 252:1235–45. doi: 10.1016/j.envpol.2019.06.033
17. Rajagopalan S, Brook RD, Salerno P, Bourges-Sevenier B, Landrigan P, Nieuwenhuijsen MJ, et al. Air pollution exposure and cardiometabolic risk. Lancet Diabetes Endocrinol. (2024) 12:196–208. doi: 10.1016/S2213-8587(23)00361-3
18. Renzi M, Cerza F, Gariazzo C, Agabiti N, Cascini S, Di Domenicantonio R, et al. Air pollution and occurrence of type 2 diabetes in a large cohort study. Environ Int. (2018) 112:68–76. doi: 10.1016/j.envint.2017.12.007
19. Wu C, Yan Y, Chen X, Gong J, Guo Y, Zhao Y, et al. Short-term exposure to ambient air pollution and type 2 diabetes mortality: a population-based time series study. Environ pollut. (2021) 289:117886. doi: 10.1016/j.envpol.2021.117886
20. Wong SF, Tap PS, Mak JW, Chan WLE, Khor GL, Ambu S, et al. Association between long-term exposure to ambient air pollution and prevalence of diabetes mellitus among Malaysian adults. Environ Health. (2020) 19:37. doi: 10.1186/s12940-020-00579-w
21. Shen F, Ge X, Hu J, Nie D, Tian L, Chen M. Air pollution characteristics and health risks in Henan Province, China. Environ Res. (2017) 156:625–34. doi: 10.1016/j.envres.2017.04.026
22. Liu J, Yin H, Tang X, Zhu T, Zhang Q, Liu Z, et al. Transition in air pollution, disease burden and health cost in China: a comparative study of long-term and short-term exposure. Environ pollut. (2021) 277:116770. doi: 10.1016/j.envpol.2021.116770
23. Liu H, Tian H, Zhang K, Liu S, Cheng K, Yin S, et al. Seasonal variation, formation mechanisms and potential sources of PM2.5 in two typical cities in the Central Plains Urban Agglomeration, China. Sci Total Environ. (2019) 657:657–70. doi: 10.1016/j.scitotenv.2018.12.068
24. Cao D, Li D, Wu Y, Qian ZM, Liu Y, Liu Q, et al. Ambient PM(2.5) exposure and hospital cost and length of hospital stay for respiratory diseases in 11 cities in Shanxi Province, China. Thorax. (2021) 76:815–20. doi: 10.1136/thoraxjnl-2020-215838
25. Bommer C, Heesemann E, Sagalova V, Manne-Goehler J, Atun R, Bärnighausen T, et al. The global economic burden of diabetes in adults aged 20–79 years: a cost-of-illness study. Lancet Diabetes Endocrinol. (2017) 5:423–30. doi: 10.1016/S2213-8587(17)30097-9
26. Armstrong B. Models for the relationship between ambient temperature and daily mortality. Epidemiology. (2006) 17:624–31. doi: 10.1097/01.ede.0000239732.50999.8f
27. Gasparrini A, Leone M. Attributable risk from distributed lag models. BMC Med Res Methodol. (2014) 14:55. doi: 10.1186/1471-2288-14-55
28. Lim CC, Hayes RB, Ahn J, Shao Y, Silverman DT, Jones RR, et al. Association between long-term exposure to ambient air pollution and diabetes mortality in the US. Environ Res. (2018) 165:330–6. doi: 10.1016/j.envres.2018.04.011
29. Song J, Liu Y, Zheng L, Gui L, Zhao X, Xu D, et al. Acute effects of air pollution on type II diabetes mellitus hospitalization in Shijiazhuang, China. Environ Sci pollut Res Int. (2018) 25:30151–9. doi: 10.1007/s11356-018-3016-9
30. Paul LA, Burnett RT, Kwong JC, Hystad P, van Donkelaar A, Bai L, et al. The impact of air pollution on the incidence of diabetes and survival among prevalent diabetes cases. Environ Int. (2020) 134:105333. doi: 10.1016/j.envint.2019.105333
31. Yang J, Siri JG, Remais JV, Cheng Q, Zhang H, Chan KKY, et al. The Tsinghua-Lancet Commission on Healthy Cities in China: unlocking the power of cities for a healthy China. Lancet. (2018) 391:2140–84. doi: 10.1016/S0140-6736(18)30486-0
32. Jiang W, Chen H, Liao J, Yang X, Yang B, Zhang Y, et al. The short-term effects and burden of particle air pollution on hospitalization for coronary heart disease: a time-stratified case-crossover study in Sichuan, China. Environ Health. (2022) 21:19. doi: 10.1186/s12940-022-00832-4
33. Dang R, Liao H, Fu Y. Quantifying the anthropogenic and meteorological influences on summertime surface ozone in China over 2012-2017. Sci Total Environ. (2021) 754:142394. doi: 10.1016/j.scitotenv.2020.142394
34. Yu HR, Lin CR, Tsai JH, Hsieh YT, Tsai TA, Tsai CK, et al. A multifactorial evaluation of the effects of air pollution and meteorological factors on asthma exacerbation. Int J Environ Res Public Health. (2020) 17:4010. doi: 10.3390/ijerph17114010
35. Ishii M, Seki T, Kaikita K, Sakamoto K, Nakai M, Sumita Y, et al. Association of short-term exposure to air pollution with myocardial infarction with and without obstructive coronary artery disease. Eur J Prev Cardiol. (2021) 28:1435–44. doi: 10.1177/2047487320904641
36. Gao C, Li S, Liu M, Zhang F, Achal V, Tu Y, et al. Impact of the COVID-19 pandemic on air pollution in Chinese megacities from the perspective of traffic volume and meteorological factors. Sci Total Environ. (2021) 773:145545. doi: 10.1016/j.scitotenv.2021.145545
37. Lin Y, Zhou S, Liu H, Cui Z, Hou F, Feng S, et al. Risk analysis of air pollution and meteorological factors affecting the incidence of diabetes in the elderly population in northern China. J Diabetes Res. (2020) 2020:3673980. doi: 10.1155/2020/3673980
38. Clougherty JE. A growing role for gender analysis in air pollution epidemiology. Environ Health Perspect. (2010) 118:167–76. doi: 10.1289/ehp.0900994
39. Honda T, Pun V, Manjourides J, Suh H. Associations between long-term exposure to air pollution, glycosylated hemoglobin and diabetes. Int J Hyg Environ Health. (2017) 220:1124–32. doi: 10.1016/j.ijheh.2017.06.004
40. Kim SR, Choi S, Kim K, Chang J, Kim SM, Cho Y, et al. Association of the combined effects of air pollution and changes in physical activity with cardiovascular disease in young adults. Eur Heart J. (2021) 42:2487–97. doi: 10.1093/eurheartj/ehab139
41. Kim SR, Choi D, Choi S, Kim K, Lee G, Son JS, et al. Association of combined effects of physical activity and air pollution with diabetes in older adults. Environ Int. (2020) 145:106161. doi: 10.1016/j.envint.2020.106161
42. Guo C, Yang HT, Chang LY, Bo Y, Lin C, Zeng Y, et al. Habitual exercise is associated with reduced risk of diabetes regardless of air pollution: a longitudinal cohort study. Diabetologia. (2021) 64:1298–308. doi: 10.1007/s00125-021-05408-4
43. Lim CC, Thurston GD. Air pollution, oxidative stress, and diabetes: a life course epidemiologic perspective. Curr Diabetes Rep. (2019) 19:58. doi: 10.1007/s11892-019-1181-y
44. Liu C, Ying Z, Harkema J, Sun Q, Rajagopalan S. Epidemiological and experimental links between air pollution and type 2 diabetes. Toxicol Pathol. (2013) 41:361–73. doi: 10.1177/0192623312464531
45. Rao X, Montresor-Lopez J, Puett R, Rajagopalan S, Brook RD. Ambient air pollution: an emerging risk factor for diabetes mellitus. Curr Diabetes Rep. (2015) 15:603. doi: 10.1007/s11892-015-0603-8
46. Zhang H, Wang Q, He S, Wu K, Ren M, Dong H, et al. Ambient air pollution and gestational diabetes mellitus: A review of evidence from biological mechanisms to population epidemiology. Sci Total Environ. (2020) 719:137349. doi: 10.1016/j.scitotenv.2020.137349
47. Pope CA III, Bhatnagar A, McCracken JP, Abplanalp W, Conklin DJ, O’Toole T. Exposure to fine particulate air pollution is associated with endothelial injury and systemic inflammation. Circ Res. (2016) 119:1204–14. doi: 10.1161/CIRCRESAHA.116.309279
48. Filardo S, Di Pietro M, Protano C, Antonucci A, Vitali M, Sessa R. Impact of air pollution on the composition and diversity of human gut microbiota in general and vulnerable populations: a systematic review. Toxics. (2022) 10:579. doi: 10.3390/toxics10100579
49. Lucht S, Hennig F, Moebus S, Führer-Sakel D, Herder C, Jöckel KH, et al. Air pollution and diabetes-related biomarkers in non-diabetic adults: a pathway to impaired glucose metabolism? Environ Int. (2019) 124:370–92. doi: 10.1016/j.envint.2019.01.005
50. Thiering E, Heinrich J. Epidemiology of air pollution and diabetes. Trends Endocrinol Metab. (2015) 26:384–94. doi: 10.1016/j.tem.2015.05.002
51. Rajagopalan S, Brook RD. Air pollution and type 2 diabetes: mechanistic insights. Diabetes. (2012) 61:3037–45. doi: 10.2337/db12-0190
52. Riant M, Meirhaeghe A, Giovannelli J, Occelli F, Havet A, Cuny D, et al. Associations between long-term exposure to air pollution, glycosylated hemoglobin, fasting blood glucose and diabetes mellitus in northern France. Environ Int. (2018) 120:121–9. doi: 10.1016/j.envint.2018.07.034
53. Wu Y, Fu R, Lei C, Deng Y, Lou W, Wang L, et al. Estimates of type 2 diabetes mellitus burden attributable to particulate matter pollution and its 30-year change patterns: a systematic analysis of data from the global burden of disease study 2019. Front Endocrinol (Lausanne). (2021) 12:689079. doi: 10.3389/fendo.2021.689079
54. Visalli G, Facciola A, Lagana P, Di Pietro A. Food chemoprevention and air pollution: the health comes with eating. Rev Environ Health. (2020) 35:471–9. doi: 10.1515/reveh-2019-0072
55. Barthelemy J, Sanchez K, Miller MR, Khreis H. New opportunities to mitigate the burden of disease caused by traffic related air pollution: antioxidant-rich diets and supplements. Int J Environ Res Public Health. (2020) 17. doi: 10.3390/ijerph17020630
56. Fan C, Wang W, Wang S, Zhou W, Ling Li. Multiple dietary patterns and the association between long-term air pollution exposure with type 2 diabetes risk: Findings from UK Biobank cohort study. Ecotoxicol Environ Saf. (2024) 275:116274. doi: 10.1016/j.ecoenv.2024.116274
57. Li H, Cai M, Li H, Qian ZM, Stamatakis K, McMillin SE, et al. Is dietary intake of antioxidant vitamins associated with reduced adverse effects of air pollution on diabetes? Findings from a large cohort study. Ecotoxicol Environ Saf. (2022) 246:114182. doi: 10.1016/j.ecoenv.2022.114182
Keywords: air pollution, type 2 diabetes mellitus, hospital costs, length of stay, season, timeseries study
Citation: Hou Z, Wang Y, Chen Z, Sun S, Xie N, Chen Y, Wang L, Lin F and Zhao G (2024) Exposure to air pollution and the risk of type II diabetes mellitus: a time-series study. Front. Endocrinol. 15:1482063. doi: 10.3389/fendo.2024.1482063
Received: 17 August 2024; Accepted: 13 November 2024;
Published: 03 December 2024.
Edited by:
Buyun Liu, University of Science and Technology of China, ChinaReviewed by:
Cosmin Mihai Vesa, University of Oradea, RomaniaJean-François Lesgards, UMR7273 Institut de Chimie Radicalaire, France
Copyright © 2024 Hou, Wang, Chen, Sun, Xie, Chen, Wang, Lin and Zhao. This is an open-access article distributed under the terms of the Creative Commons Attribution License (CC BY). The use, distribution or reproduction in other forums is permitted, provided the original author(s) and the copyright owner(s) are credited and that the original publication in this journal is cited, in accordance with accepted academic practice. No use, distribution or reproduction is permitted which does not comply with these terms.
*Correspondence: Guoan Zhao, Z3VvYW56aGFvQHh4bXUuZWR1LmNu
 Zhuomin Hou
 Yongbin Wang
 Zhigang Chen1,3
 Siyu Sun
 Fei Lin