 Qing-Yun Hao1†Yu-Hong Zeng2†Ying Lin3†Jing-Bin Guo1Shi-Chao Li4
 Ping-Zhen Yang1
 Jing-Wei Gao5*
 Ze-Hua Li1*
- 1Department of Cardiology, Laboratory of Heart Center, Zhujiang Hospital, Southern Medical University, Guangzhou, China
- 2Medical Apparatus and Equipment Deployment, Zhujiang Hospital, Southern Medical University, Guangzhou, China
- 3Department of Endocrinology, Sun Yat-sen Memorial Hospital, Sun Yat-sen University, Guangzhou, China
- 4Department of Organ Transplantation, Zhujiang Hospital, Southern Medical University, Guangzhou, China
- 5Department of Cardiology, Sun Yat-sen Memorial Hospital, Sun Yat-sen University, Guangzhou, China
Background: Non-alcoholic fatty liver disease (NAFLD) has emerged as a predominant driver of chronic liver disease globally and is associated with increased cardiovascular disease morbidity and mortality. However, the association between NAFLD and calcific aortic valve disease remains unclear. We aimed to prospectively investigate the association between NAFLD and incident aortic valve calcification (AVC), as well as its genetic relationship with incident calcific aortic valve stenosis (CAVS).
Methods: A post hoc analysis was conducted on 4226 participants from the Multi-Ethnic Study of Atherosclerosis (MESA) database. We employed the adjusted Cox models to assess the observational association between NAFLD and incident AVC. Additionally, we conducted two-sample Mendelian randomization (MR) analyses to investigate the genetic association between genetically predicted NAFLD and calcific aortic valve stenosis (CAVS), a severe form of CAVD. We repeated the MR analyses by excluding NAFLD susceptibility genes linked to impaired very low-density lipoprotein (VLDL) secretion.
Results: After adjustment for potential risk factors, participants with NAFLD had a hazard ratio of 1.58 (95% CI: 1.03–2.43) for incident AVC compared to those without NAFLD. After excluding genes associated with impaired VLDL secretion, the MR analyses consistently showed the significant associations between genetically predicted NAFLD and CAVS for 3 traits: chronic elevation of alanine aminotransferase (odds ratio = 1.13 [95% CI: 1.01–1.25]), imaging-based NAFLD (odds ratio = 2.81 [95% CI: 1.66–4.76]), and biopsy-confirmed NAFLD (odds ratio = 1.12 [95% CI: 1.01–1.24]). However, the association became non-significant when considering all NAFLD susceptibility genes.
Conclusions: NAFLD was independently associated with an elevated risk of incident AVC. Genetically predicted NAFLD was also associated with CAVS after excluding genetic variants related to impaired VLDL secretion.
1 Introduction
Non-alcoholic fatty liver disease (NAFLD) is prevalent in approximately 32% of adults and afflicts half of those with type 2 diabetes mellitus (1, 2), NAFLD has become the most common cause of chronic liver disease worldwide. NAFLD is a clinical-pathological syndrome, ranges from simple steatosis to non-alcoholic steatohepatitis, with potential progression to advanced stages such as fibrosis, cirrhosis, liver failure, and hepatocellular carcinoma (3). Patients with NAFLD have a substantially higher mortality rate than the non-NAFLD controls, with cardiovascular disease (CVD) being the primary reason for death (4).
Calcific aortic valve disease (CAVD) comprises aortic valve sclerosis and calcific aortic valve stenosis (CAVS), characterized by calcium build-up on the aortic valve (5). Ranking as the third leading cause of CVD globally, CAVD affects about 25% of those over 65 years (6). The Global Burden of Disease Study in 2017 showed that the disability-adjusted life years related to CAVD increased by 101% from 1990 to 2017 (7). CAVS dominates as the chief valvular disease among Western populations and is responsible for the highest valve-related mortality in the United States (8). With a prevalence exceeding 2% in those over 65, projections suggested a twofold increase in aortic valve replacement by 2050 (9). Aortic valve calcification (AVC) is now perceived as an actively regulated biological process that shares many similar risk factors with coronary artery atherosclerosis (10). Additionally, it has been demonstrated that NAFLD is significantly associated with a higher risk of atherosclerosis (11). Previous studies have established a link between NAFLD and coronary artery calcification (12); and showed an cross-sectional association between NAFLD and aortic and mitral valve calcification (13, 14). While the prospective and causal relationship between NAFLD and CAVD remains unknown.
Mendelian randomization (MR) analysis has become prevalent in studying the causal relationship between various exposure factors and outcomes of interest. As genetic variants that increase susceptibility or protect against the exposure of interest are randomly assigned at conception, they can be used as instrumental variables (IVs) in MR analysis. Thus, MR analysis is often regarded as similar to a randomized controlled trail but with lower susceptibility to reverse causation and confounding factors (15). However, there has been no MR analysis on the association between NAFLD and CAVD yet.
This study aimed to investigate both the observational and genetic association between NAFLD and CAVD. To achieve this objective, we initially examined the observational association between NAFLD and incident AVC using data from the Multi-Ethnic Study of Atherosclerosis (MESA). Then, we conducted two-sample MR analyses utilizing recently obtained genome-wide association study (GWAS) data to explore the association between genetically predicted NAFLD and CAVS.
2 Methods
2.1 Study design and population
The MESA is an ongoing, prospective, population-based observational study aimed at investigating early, or subclinical, atherosclerosis and CVD dynamics, with previously published details covering examinations and protocols (16). From July 2000 to September 2002, 6814 participants were enrolled in 6 United States field centers. Before the study initiation, all participants underwent screening to ensure they were between 45 and 84 years old and had no clinical CVD. Every participant provided informed consent, and the Institutional Review Boards approved the study protocols of all participating institutions.
We included participants who had baseline (Exam 1: 2000–2002) and follow-up (Exam 2: 2002–2004 and Exam 3: 2004–2005) AVC measurements in the present study. We excluded those with missing data on AVC score at baseline (n = 2), or during follow-up AVC score (n = 1059), baseline liver attenuation data (n = 164), covariates data (n = 210), or those had detectable AVC at baseline (n = 606), had a history of heavy alcohol consumption (defined as > 7 drinks/week for women and > 14 drinks/week for men, n = 252) (17), had a history of hepatitis (n = 143), or had a history of rheumatic heart disease at baseline (n = 152). Consequently, the final study sample consisted of 4226 participants (Figure 1).
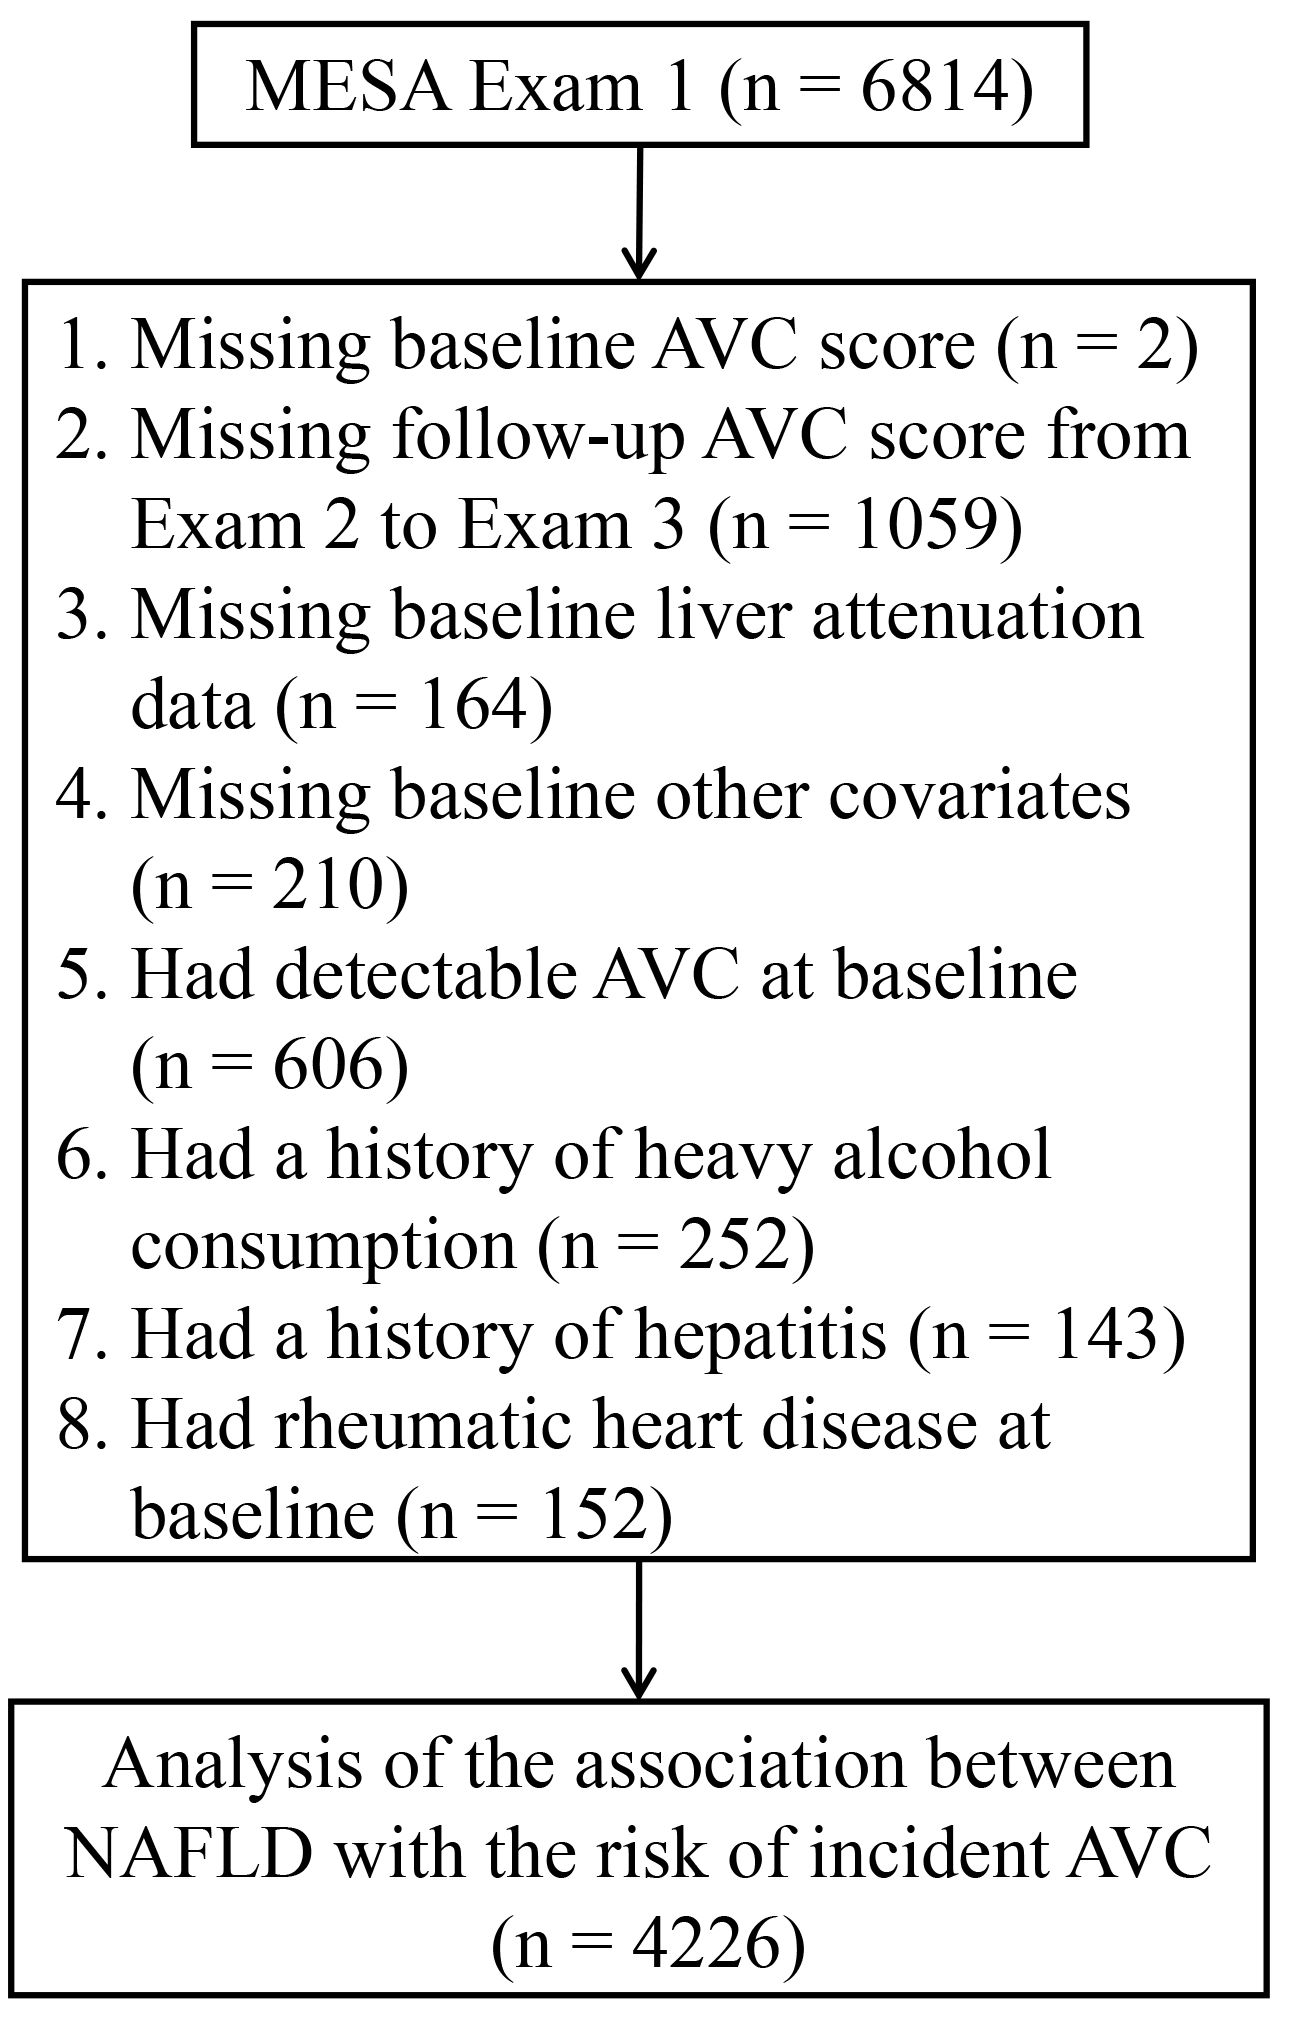
Figure 1 Flowchart for selecting the participants from the MESA for analysis. AVC, aortic valve calcification; MESA, Multi-Ethnic Study of Atherosclerosis; NAFLD, non-alcoholic fatty liver disease.
2.2 Measurements of liver fat
The details of liver fat measurement in the MESA study have been described previously (18). During the initial examination, every participant underwent 2 successive non-enhanced cardiac-gated computed tomography (CT) scans, which provided sufficient liver imaging to determine fatty liver. Prior research has shown a negative correlation between liver attenuation on CT scans and liver fat deposition on liver biopsy, indicating that CT scanning is a valuable non-invasive approach to detecting fatty liver (19). Briefly, baseline cardiac CT scans were utilized to measure hepatic attenuation values (Hounsfield Units, HU) using a region of interest of ≥ 100 mm2 in area. NAFLD was defined as liver attenuation value < 51 HU after ruling out alternative factors contributing liver fat accumulation in individuals without heavy alcohol use. This threshold is equivalent to a liver-to-spleen ratio of < 1.0, which indicates at least mild NAFLD (17, 20).
2.3 Measurements of AVC
Calcified lesions on aortic valve leaflets and the aortic root were characterized as AVC in the MESA study, assessed by either electron-beam CT or multi-detector row helical CT depending on the study site to detect cardiovascular calcification (21). All scans underwent centralized analysis at the Harbour-UCLA Research and Education Institute, Los Angeles, CA, ensuring low intrareader and interscan variability (4.4% and 9.7%, respectively) in AVC scoring (21, 22). AVC score is calculated using the Agatston method, where the calcification score of each lesion is determined by multiplying the lesion area by a density factor derived from the maximum HU within this area, the total AVC score is determined by summing the Agatston score of all individual lesions (23). AVC score > 0 indicates the presence of AVC, while AVC score = 0 indicates the absence of AVC (22). Follow-up measurements for AVC were conducted during Exam 2 (2002–2004) or Exam 3 (2004–2005). While some participants underwent additional CT scans at Exam 4 and/or Exam 5 for assessing coronary artery calcification, these examinations were not included for the present analysis due to lack of AVC data. Incident AVC was defined as AVC score > 0 during follow-up in individuals who had no AVC (AVC score = 0) at the baseline examination (24).
2.4 Measurements of other covariates
Participants’ baseline characteristics were obtained at Exam 1. Participants provided self-reported information on age, sex, ethnicity, smoking status, drinking status, and medication history. Physical activity was measured using the MESA typical week physical activity survey. Body mass index (BMI) was calculated as weight in kilograms divided by height in meters squared (kg/m2). Hypertension was identified based on systolic blood pressure readings of 140 mmHg or higher, diastolic blood pressure readings of 90 mmHg or higher, or a record of antihypertensive drug usage in the preceding two weeks. Diabetes was defined by a fasting glucose level of 126 mg/dL or higher, or a self-reported physician’s diagnosis of diabetes, or any utilization of antidiabetic drugs. Detailed descriptions of measurements, including plasma total cholesterol, high-density lipoprotein cholesterol, triglycerides, low-density lipoprotein cholesterol, fasting glucose, estimated glomerular filtration rate, and C-reactive protein, have been previously published (25).
2.5 GWAS data sources for NAFLD
Gene-exposure data were derived from a GWAS conducted on the chronic elevation of alanine aminotransferase (cALT) in the Million Veteran Program, which was a large-scale study that seeks to pinpoint genetic and non-genetic risk factors for various health conditions in US veterans. Within this study, NAFLD was defined as alanine transaminase levels surpassing gender-specific thresholds (30 U/L for females and 40 U/L for males) on 2 occasions separated by at least six months within a two-year frame, excluding other liver diseases (26). The specific design, initial demographics, and quality-control procedures of this study have been detailed previously (27). The study included 128,187 controls and 90,408 NAFLD cases from 4 ancestral groups, including Asian-Americans (0.9%), Hispanic-Americans (6.9%), African-Americans (17.1%), and European-Americans (75.1%). Among these participants, 77 independent single nucleotide polymorphisms (SNPs) were identified as having genome-wide significance (P < 5×10⁻⁸) (28). Further, validation was performed on 22 SNPs in 1 external cohort and 36 SNPs in the other one. The first cohort consisted of 44,289 individuals with liver fat measured through CT or magnetic resonance imaging, while the second cohort consisted of 64,182 individuals with biopsy-confirmed NAFLD, respectively (28).
2.6 GWAS data sources for CAVS
The CAVS-related GWAS data were provided by the FinnGen study (https://r9.finngen.fi/), a large public-private partnership project launched in Finland in 2017 to gather and examine health and genome information from 500,000 Finish biobank participants. The GWAS of CAVS in FinnGen included 9153 cases and 368,124 controls and analyzed approximately 20,170,236 SNPs. The FinnGen study defined CAVS using the ICD-9 codes 4241B and 4241C and ICD-10 codes I35.0 and I35.2.
2.7 Selection of genetic instruments
To determine the genetic association between NAFLD and CAVS, we employed 3 IVs sets, including (1) all 77 SNPs associated with cALT; (2) 22 cALT-associated SNPs that showed directional concordance and nominal significance in the imaging cohort, with Z-scores from the imaging data used for analyses; (3) 36 cALT-associated SNPs that showed directional concordance and nominal significance in the biopsy cohort, with effect estimates from the biopsy data used for analyses (Supplementary Table 1) (28). To ensure the precision of the outcomes, we reanalyzed all sets by removing the NAFLD susceptibility genes linked to a decline in very low-density lipoprotein (VLDL) secretion (APOE, BCL7B, MTTP, TM6SF2, and PNPLA3), based on the information from PhenoScanner and Pubmed search.
The selection of valid IVs in this study involved strict criteria. SNPs that exhibited linkage disequilibrium with an r2 < 0.001, and < 1 MB from the index variant, or displayed palindromic patterns with intermediate allele frequencies were removed from the analyses. Additionally, SNPs that were not present in the outcome GWAS dataset were excluded. The strength of IVs was evaluated by calculating F statistic (29), and only IVs with an F statistic > 10 were deemed valid and reliable for NAFLD analyses.
2.8 Statistical analyses
Continuous variables conforming to a normal distribution were presented as mean ± SD, while non-normally distributed continuous variables were given as median (interquartile range). Categorical variables were presented as numbers (percentages). Student’s t-test or Mann-Whitney U-test was used for continuous variables, depending on the distribution. The Chi-square test was applied for categorical variables. Adjusted Cox models were employed to examine the association between baseline NAFLD status and the risk of incident AVC, providing hazard ratios (HR) and 95% CIs. The statistical analyses were conducted using SPSS version 26. Statistical significance was determined using a two-sided P value of < 0.05.
The methodology for MR analysis was anchored in 3 fundamental assumptions (30). The primary analyses of our two-sample MR analyses employed inverse variance weighted (IVW) method with a random-effect model. To evaluate heterogeneity, we calculated Cochran’s Q statistic and conducted leave-one-out analyses. Horizontal pleiotropy was gauged via MR-Egger intercept test. If the P value from MR-Egger intercept test > 0.05, it was considered as no evidence of horizontal pleiotropy, and the estimation from IVW method was deemed the most reliable (31). We additionally performed further analyses using more rigorous criteria: (1) simple median method, even if half of the genetic instruments are invalid, the effect estimate can still be generated (28); (2) penalised weighted median method, which decreases the influence of genetic variants with heterogeneity, effectively mitigating the influence of outliers (28); (3) MR-Egger regression method, which permits pleiotropic effects for all genetic variants, with the condition that these effects are independent of the association between the variant and exposure (32); (4) weighted mode, which generates consistent results even if most IVs were invalid (33). For added precision, MR-PRESSO analyses were applied to address heterogeneity, excluding SNPs that significantly added to observed heterogeneity (NbDistribution = 10,000). All two-sample MR analyses were conducted using the TwoSampleMR package in the R 4.0.1.
3 Results
3.1 Baseline characteristics between participants with and without NAFLD
The analyses were conducted on 4226 participants from the MESA study (Figure 1). At baseline, the average age was 60.8 ± 10.0 years, 1879 (44.5%) were men, 1545 (36.6%) were Caucasian, 520 (12.3%) were Chinese, 1211 (28.7%) were African American, 950 (22.5%) were Hispanic, 1729 (40.9%) had hypertension, 474 (11.2%) had diabetes mellitus, and 645 (15.3%) had NAFLD (Table 1). The participants were then categorized into two groups depending on whether they had NAFLD at baseline. Individuals with NAFLD were younger (59.0 vs. 61.1 years), more Hispanic ethnicity (38.1% vs. 19.7%), and more non-drinkers (26.5% vs. 20.6%). Moreover, they exhibited increased BMI (32.0 vs. 27.8 kg/m2), systolic blood pressure (127.6 vs. 124.5 mmHg), diastolic blood pressure (72.9 vs. 71.6 mmHg), triglycerides (163.8 vs. 117.6 mg/dL), fasting glucose (109.3 vs. 93.5 mg/dL), estimated glomerular filtration rate (82.4 vs. 78.4 ml/min/1.73 m2), and C-reactive protein (3.4 vs. 1.7 mg/L) levels, while their high-density lipoprotein cholesterol (45.4 vs. 52.3 mg/dL), low-density lipoprotein cholesterol (114.6 vs. 118.3 mg/dL), and physical activity (630.0 vs. 915.0 MET-min/wk) levels were lower (Table 1). Additionally, participants with NAFLD exhibited a higher prevalence of diabetes mellitus (23.7% vs. 9.0%) and hypertension (47.8% vs. 39.7%) and a greater likelihood of using antihypertensive (40.0% vs. 32.4%) and hypoglycemic (16.6% vs. 7.0%) medications than those without (Table 1).
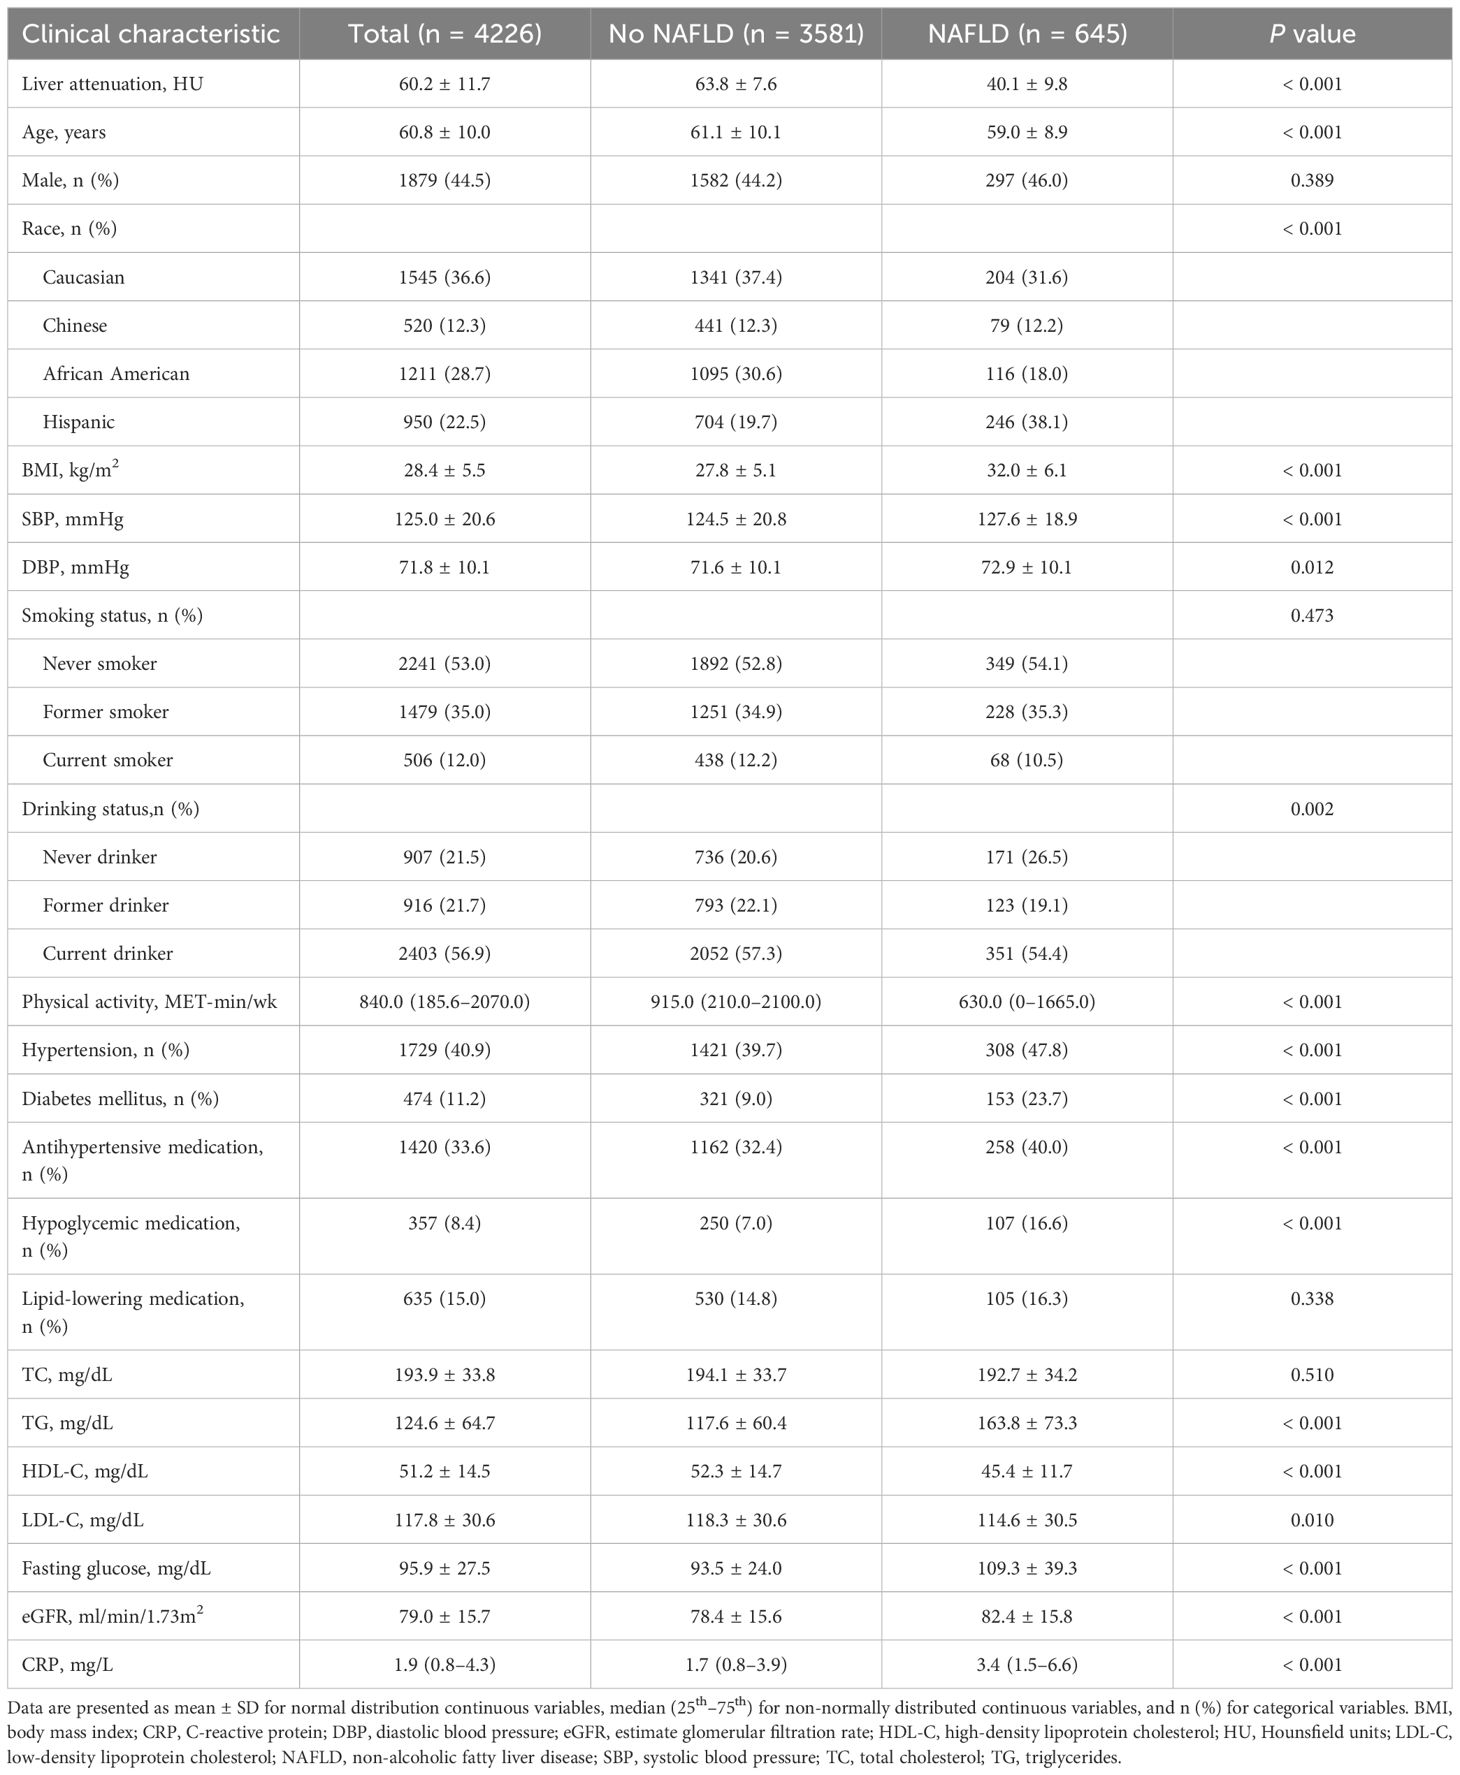
Table 1 Baseline characteristics of participants stratified by status of NAFLD.
3.2 Risk of incident AVC for NAFLD groups
Over an average follow-up period of 2.4 ± 0.9 years, 169 (4.0%) incident AVC cases were observed (Table 2). In the fully-adjusted model, participants with NAFLD had a significantly higher risk of AVC incidence than those without (HR = 1.58 [95% CI: 1.03–2.43]; P = 0.038; Table 2). When participants were stratified by age (< 60 or ≥ 60 years), sex (male or female), ethnicity (Caucasian, Chinese, African American, or Hispanic), and BMI (< 28 or ≥ 28 kg/m2), the association between NAFLD status and the risk of AVC incidence remained consistent among all the subgroups (all P for interaction > 0.05, Supplementary Figure 1).
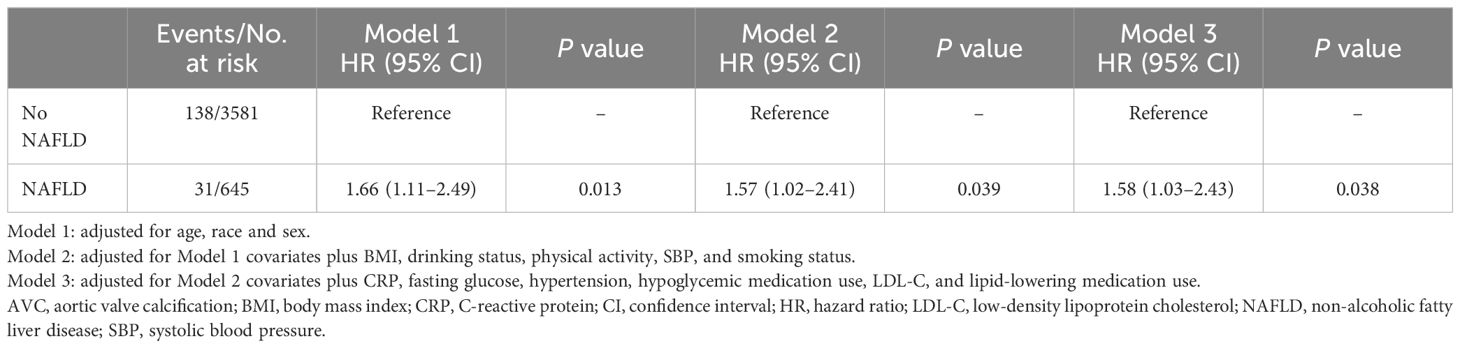
Table 2 Adjusted associations between NAFLD at liver attenuation values less than 51 and AVC incident.
3.3 Genetic association between NAFLD and CAVS
The GWAS identified 77 cALT-associated SNPs, of which 6 SNPs were unavailable within CAVS dataset, and 1 SNP was associated with CAVS. An additional 18 SNPs were removed due to being either linkage disequilibrium or palindromic, resulting in 52 independent SNPs that were used as IVs (Supplementary Tables 1, 2), with a mean F statistic of 556.9.
IVW analysis detected a non-significant association between genetically predicted cALT and an increased risk of CAVS (odds ratio = 1.07 [95% CI: 0.98–1.17]; P = 0.150; Figure 2). A similar trend was observed in other sensitivity analyses (Figures 2, 3). Although Cochran’s Q test detected heterogeneity (Q: 101.0, P < 0.001), heterogeneity was considered acceptable within the context of random-effects IVW method (28). MR-Egger intercept test showed a nonsignificant intercept (P = 0.108), indicating the absence of pleiotropy. No outliers were identified in leave-one-out plot (Supplementary Figure 6). Furthermore, MR-PRESSO identified 2 outliers, although the exclusion of outliers did not substantially affect the result (odds ratio = 1.07 [95% CI: 0.97–1.17]; P = 0.173).
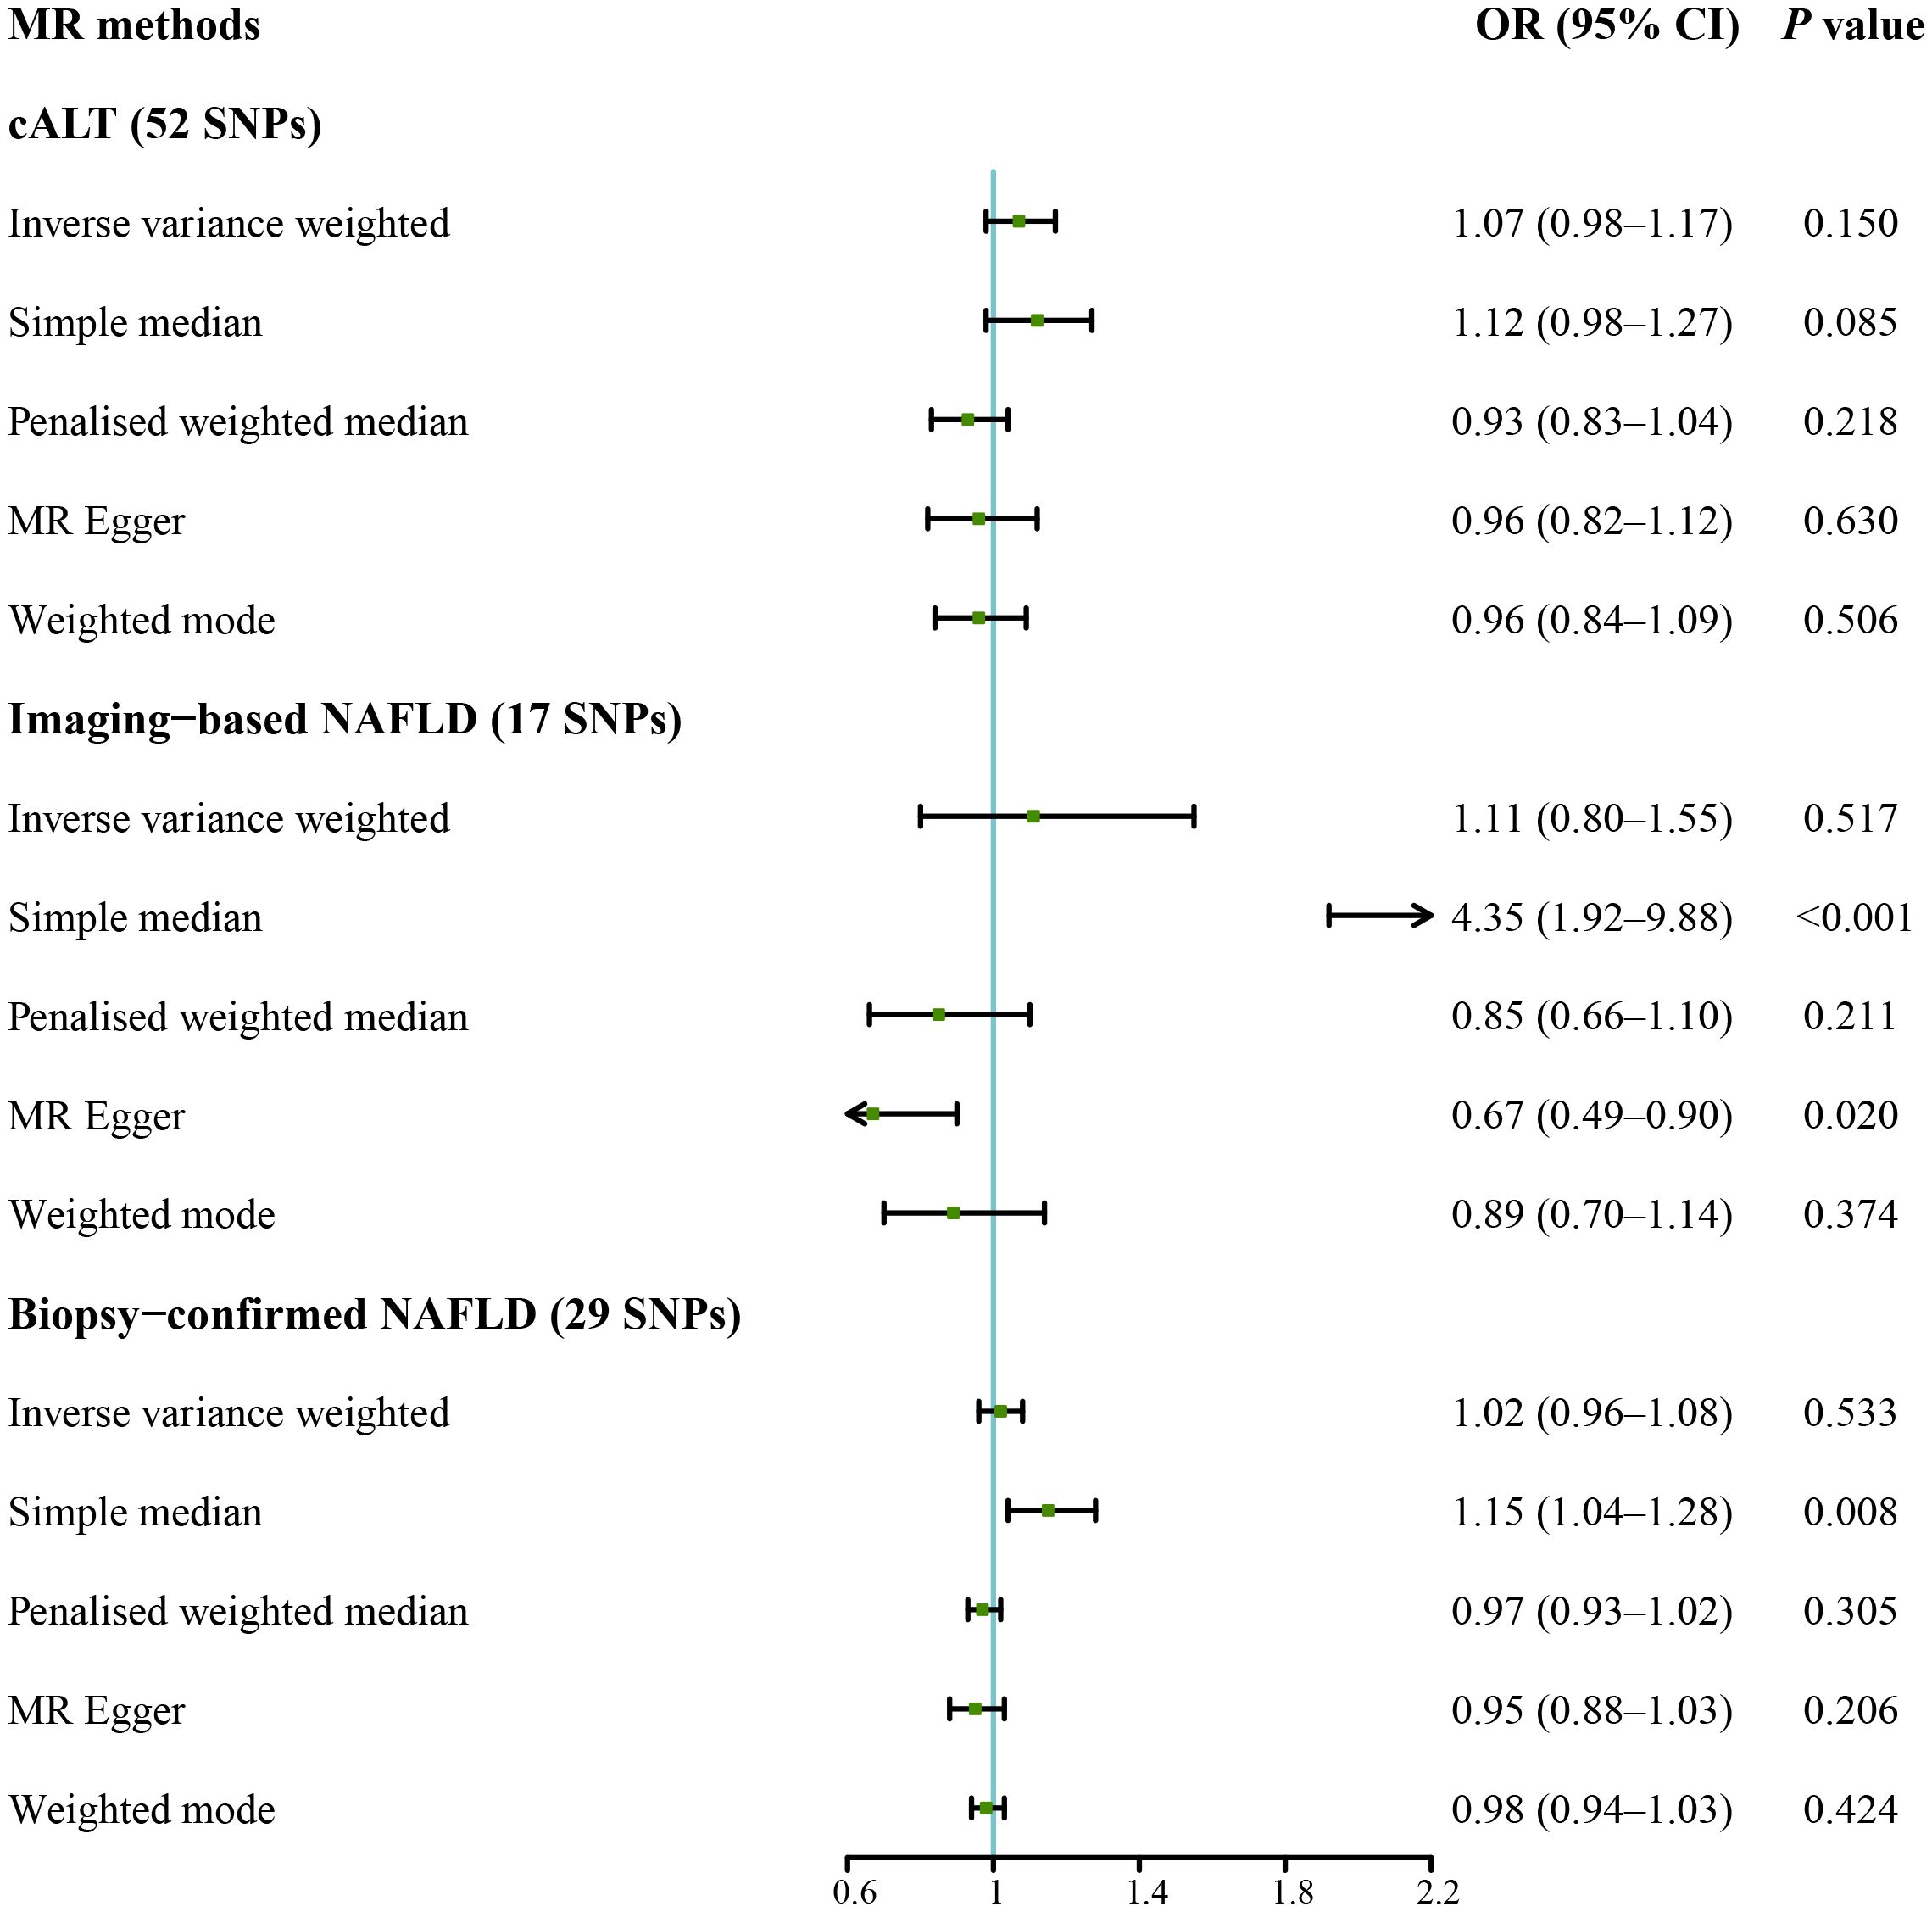
Figure 2 Forest plot of MR results of NAFLD with CAVS. cALT, chronic elevation of alanine transaminase; CAVS, calcific aortic valve stenosis; CI, confidence interval; MR, Mendelian randomization; NAFLD, non-alcoholic fatty liver disease; OR, odds ratio; SNPs, single nucleotide polymorphisms.
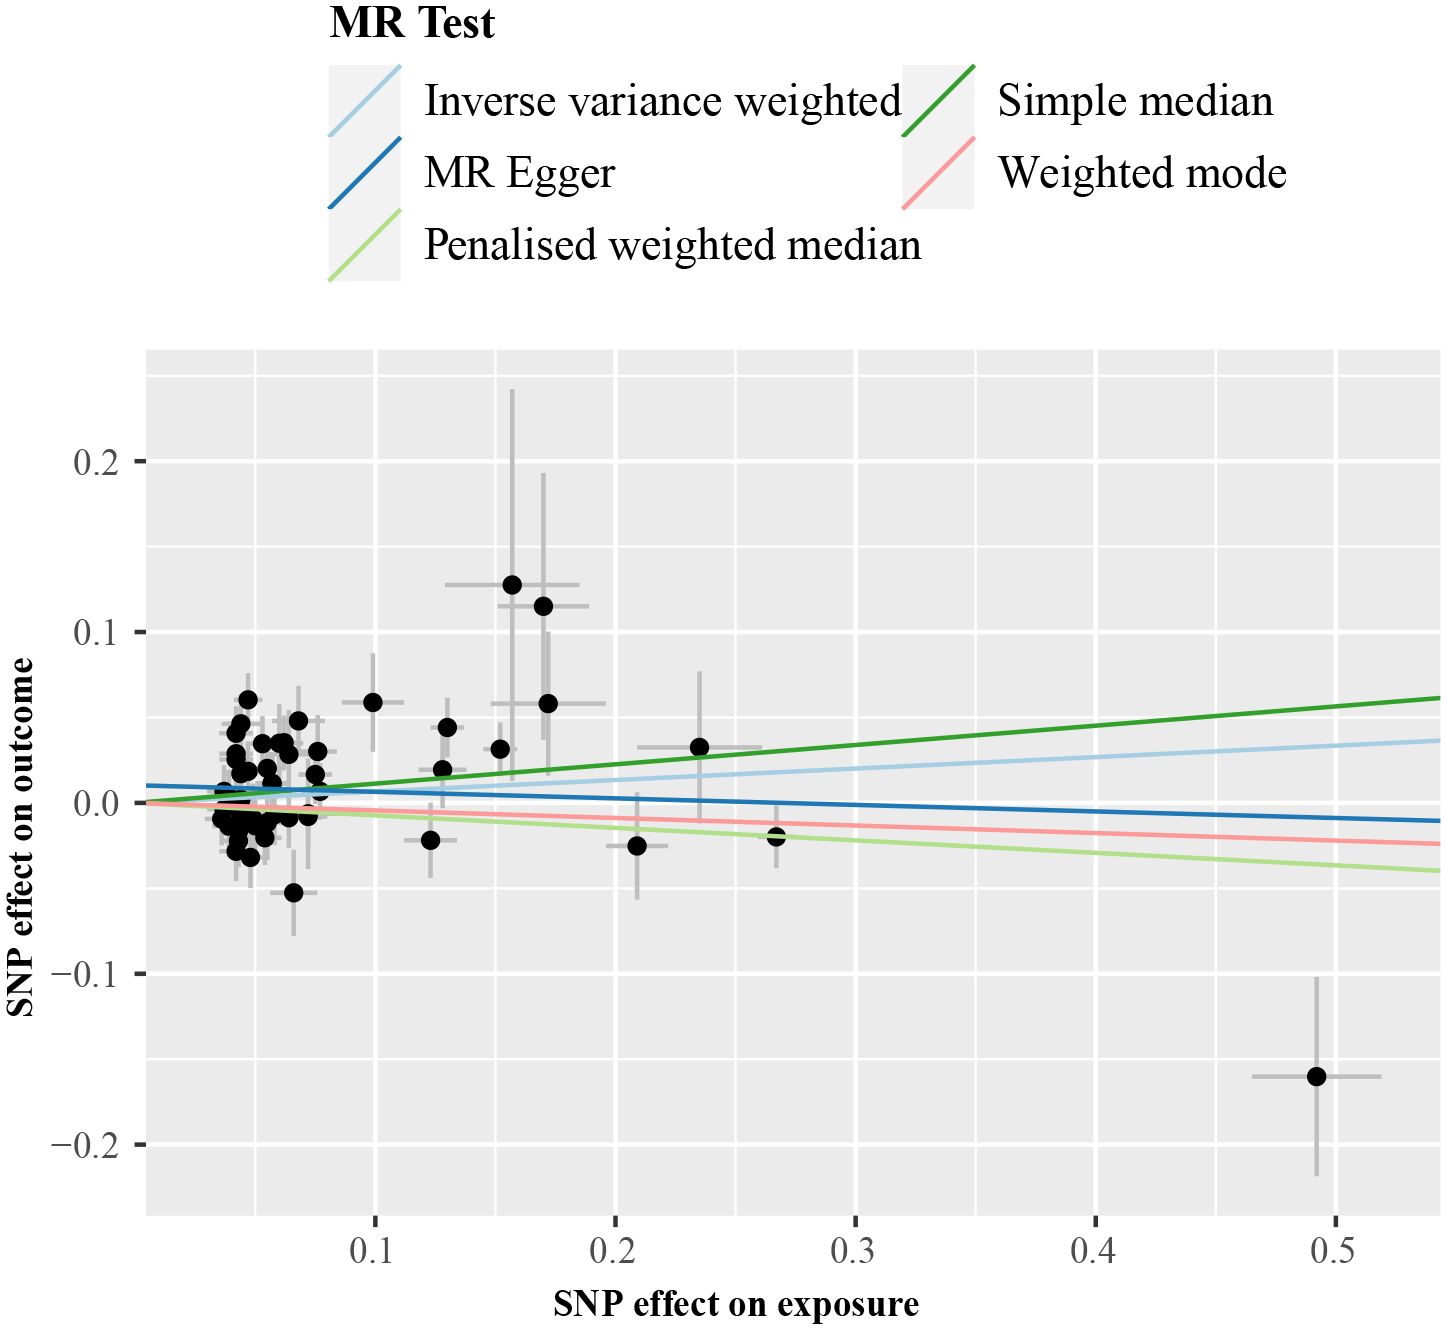
Figure 3 Scatter plot from genetically predicted cALT on CAVS. cALT, chronic elevation of alanine transaminase; CAVS, calcific aortic valve stenosis; MR, Mendelian randomization; SNP, single nucleotide polymorphism.
IVW analyses conducted on additional NAFLD-related traits, which included both imaging-based NAFLD (using 17 SNPs, Supplementary Tables 1, 3) and biopsy-confirmed NAFLD (using 29 SNPs, Supplementary Tables 1, 4), were non-significant (Figure 2). Consistent results were obtained using penalised weighted median and weighted mode for both traits (Figure 2, Supplementary Figures 2, 3). MR-Egger intercept test revealed a notable intercept for both traits (P < 0.05), suggesting the presence of potential pleiotropy. No outliers were identified in leave-one-out plots (Supplementary Figures 7, 8). MR-PRESSO identified several outliers for both traits, but there was no significant difference in the causal estimates before and after removing outliers.
3.4 Genetic association between NAFLD and CAVS after excluding impaired VLDL secretion-associated genes
We subsequently repeated the analyses after excluding genes that are associated with impaired VLDL secretion (APOE, BCL7B, MTTP, TM6SF2, and PNPLA3; F statistic: 465.2; Supplementary Table 2). IVW method with the remaining 47 SNPs showed a statistically significant association between cALT-related SNPs and the risk of CAVS (odds ratio = 1.13 [95% CI: 1.01–1.25]; P = 0.032; Figure 4). Similar associations were found when simple median, penalised weighted median, and weighted mode methods were applied, with odds ratios of 1.15 (95% CI: 1.00–1.31), 1.23 (95% CI: 1.07–1.40), and 1.23 (95% CI: 1.05–1.45), respectively (Figures 4, 5). Heterogeneity was observed with Cochran’s Q test (Q: 94.4, P < 0.001). MR-Egger intercept test revealed a non-significant intercept (P = 0.554). No outliers were identified in leave-one-out plot (Supplementary Figure 9). However, MR-PRESSO identified 2 outliers, and the exclusion these SNPs did not substantially affect the result (odds ratio = 1.17 [95% CI: 1.06–1.29]; P = 0.003).
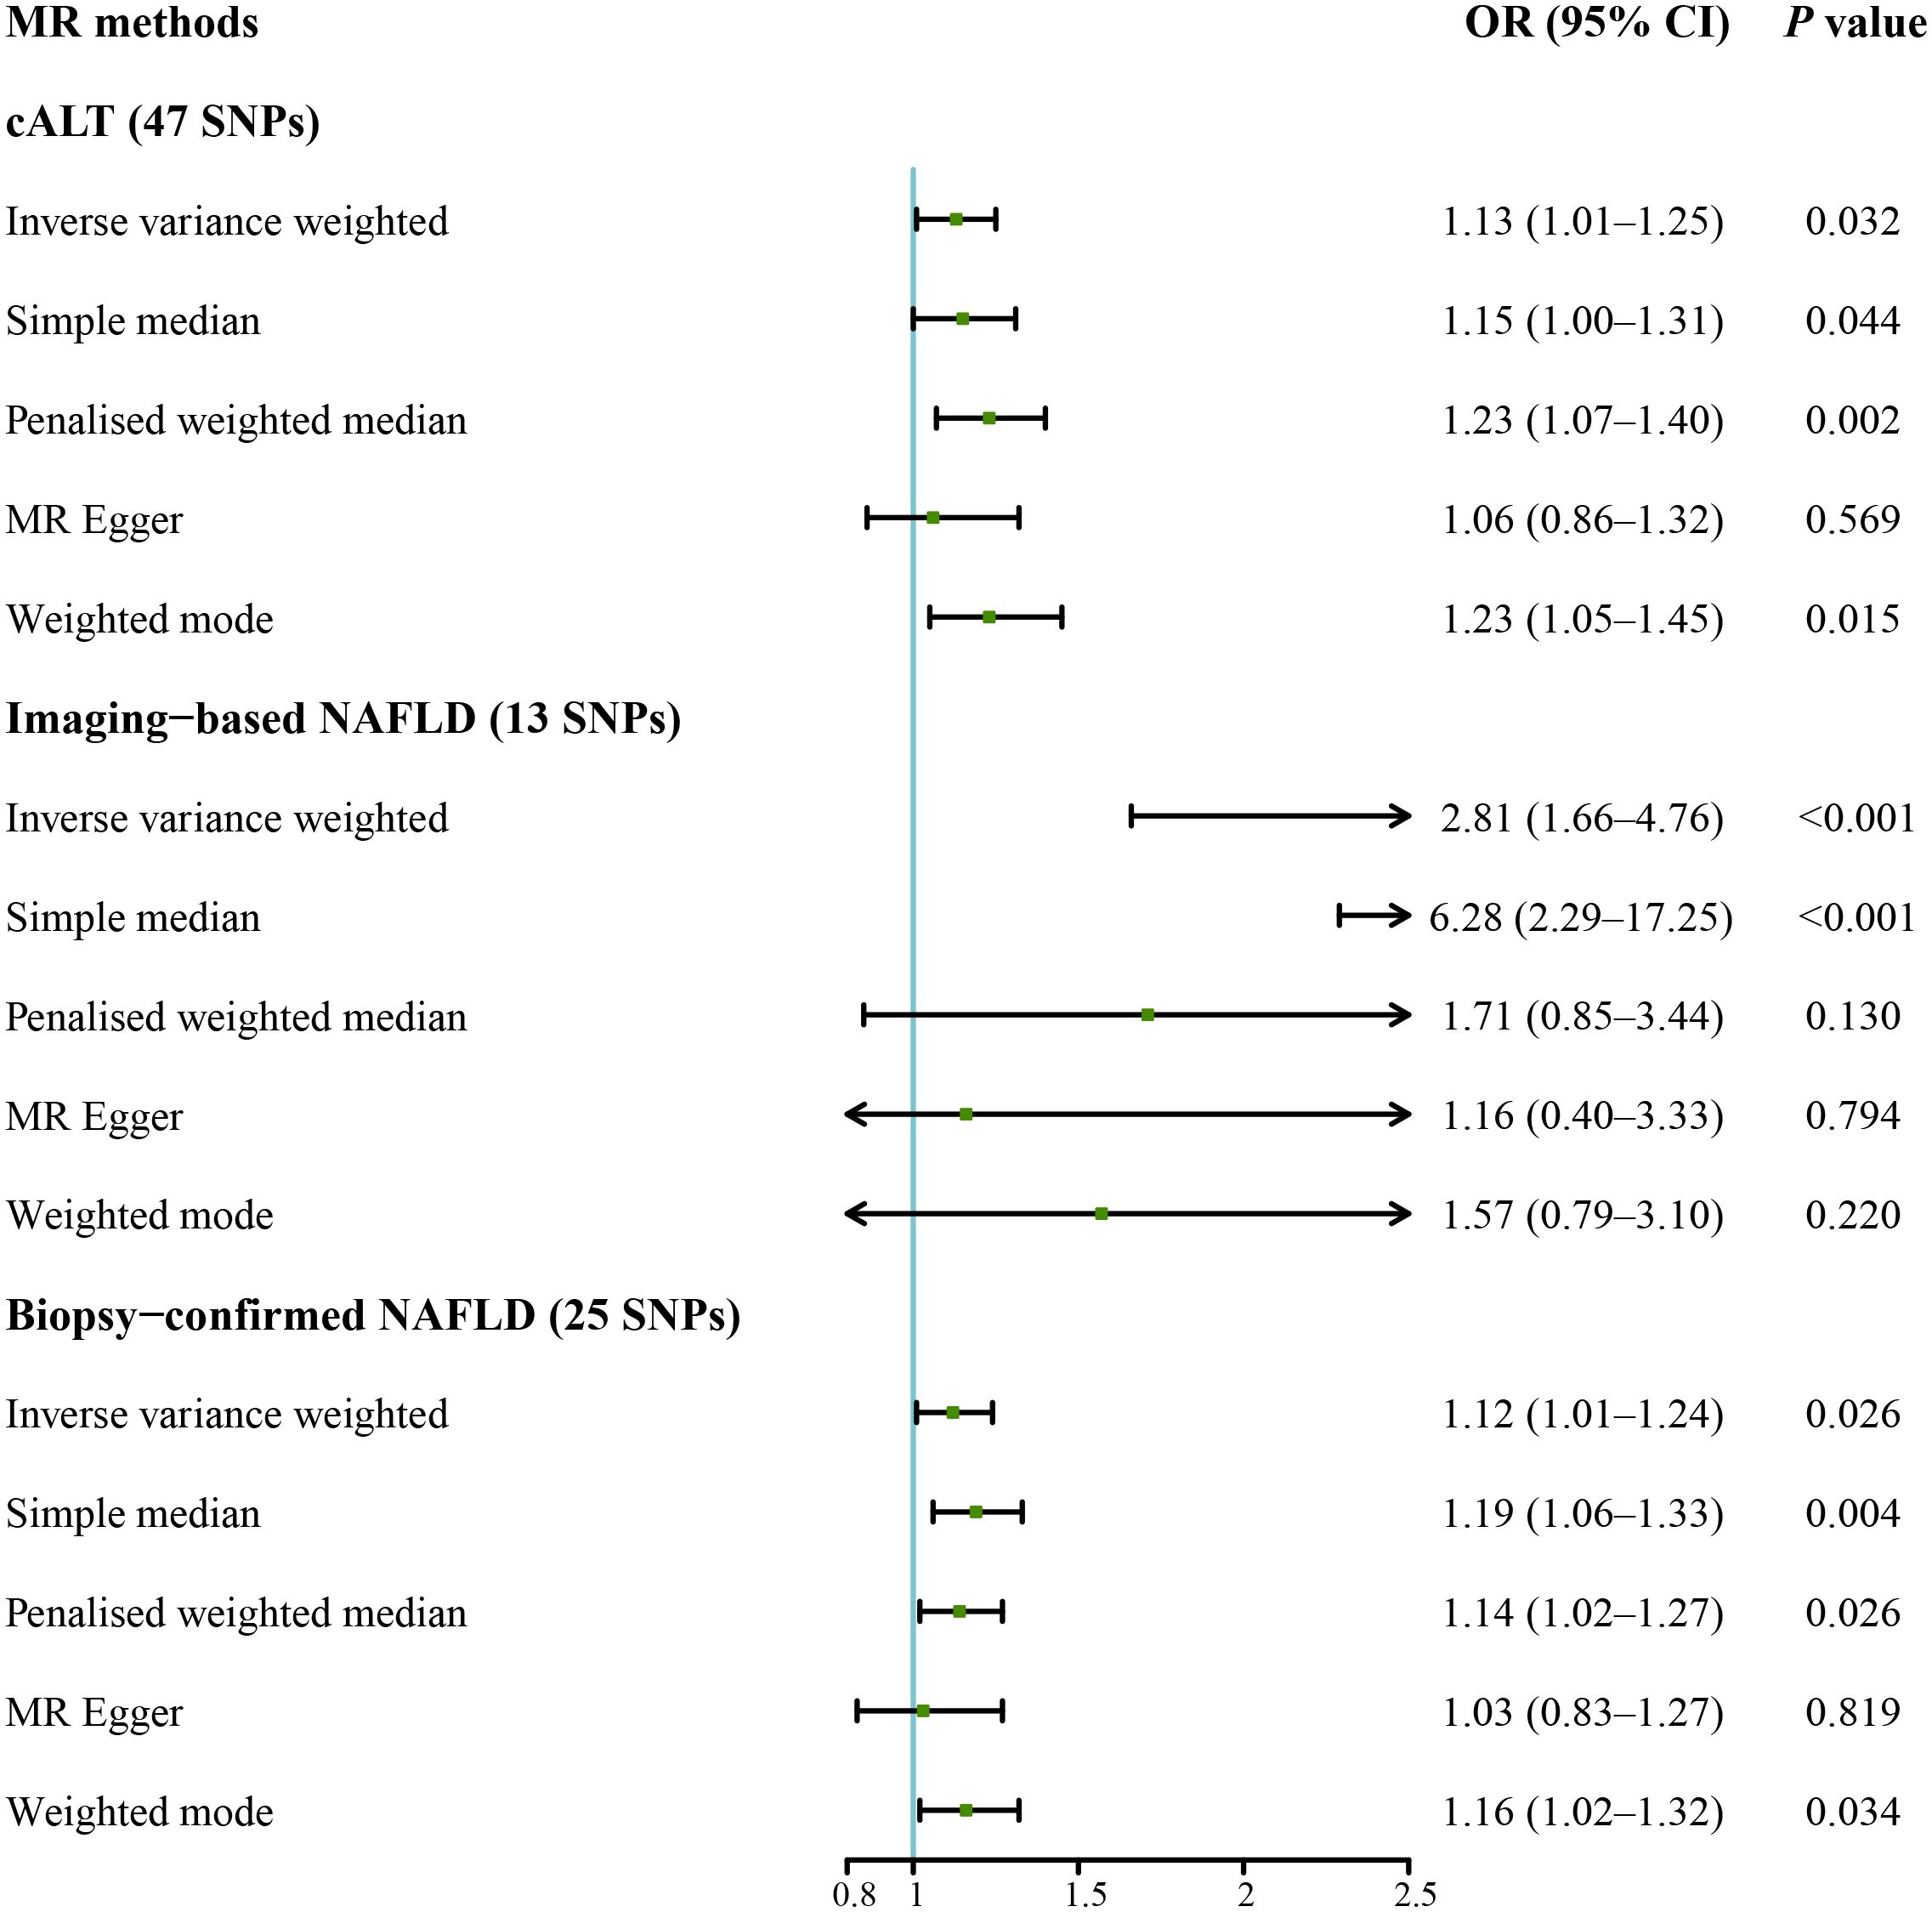
Figure 4 Forest plot of MR results of NAFLD with CAVS after exclusion of genes associated with impaired VLDL secretion. cALT, chronic elevation of alanine transaminase; CAVS, calcific aortic valve stenosis; CI, confidence interval; MR, Mendelian randomization; NAFLD, non-alcoholic fatty liver disease; OR, odds ratio; SNPs, single nucleotide polymorphisms; VLDL, very low-density lipoprotein.
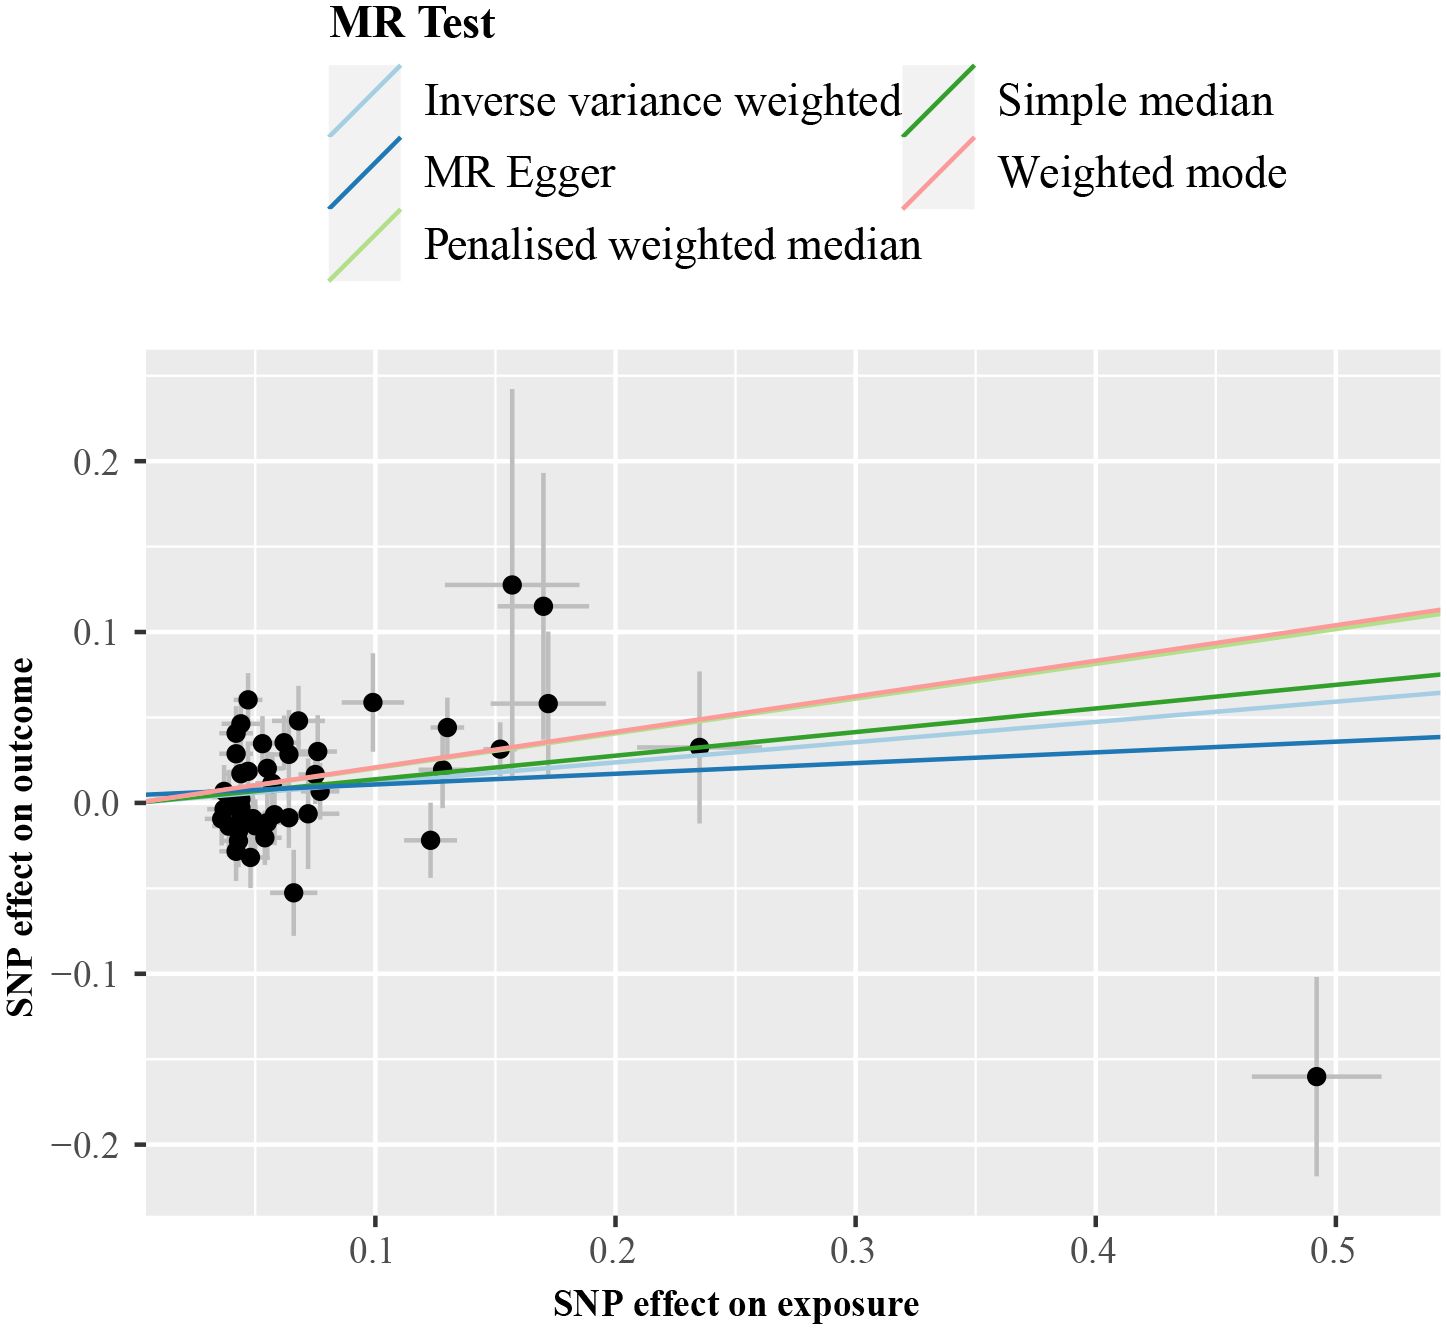
Figure 5 Scatter plot from genetically predicted cALT on CAVS after exclusion of genes associated with impaired VLDL secretion. cALT, chronic elevation of alanine transaminase; CAVS, calcific aortic valve stenosis; MR, Mendelian randomization; SNP, single nucleotide polymorphism; VLDL, very low-density lipoprotein.
IVW MR analysis for the imaging data, including the remaining 13 SNPs after removing genes linked to a decline in VLDL secretion (F statistic: 25.9; Supplementary Table 3) showed statistically significant association between genetically predicted imaging-based NAFLD and risk of CAVS (odds ratio = 2.81 [95% CI: 1.66–4.76]; P < 0.001; Figure 4). Similar result was observed with the simple median method (odds ratio = 6.28 [95% CI: 2.29–17.25]; P < 0.001; Figure 4, Supplementary Figure 4). No heterogeneity was detected by Cochran’s Q test (Q: 11.5, P = 0.399), and MR-Egger intercept test demonstrated a nonsignificant intercept (P = 0.091). No outliers were identified in leave-one-out plot (Supplementary Figure 10), and MR-PRESSO method did not detect any outliers.
IVW analysis for the biopsy-confirmed NAFLD, including 25 SNPs (F statistics: 309.1; Supplementary Table 4), showed a statistically significant association between biopsy-confirmed NAFLD and increased risk of CAVS (odds ratio = 1.12 [95% CI: 1.01–1.24]; P = 0.026; Figure 4). Similar results were obtained using simple median, penalised weighted median, and weighted mode methods, with odds ratios of 1.19 (95% CI: 1.06–1.33), 1.14 (95% CI: 1.02–1.27), and 1.16 (95% CI: 1.02–1.32), respectively (Figure 4, Supplementary Figure 5). However, MR-Egger method yielded different result (Figure 4, Supplementary Figure 5). Heterogeneity was observed with Cochran’s Q test (Q: 54.2, P < 0.001), while MR-Egger intercept test revealed a nonsignificant intercept (P = 0.357). No outliers were identified in leave-one-out plot (Supplementary Figure 11). However, MR-PRESSO identified 1 outlier, yet its exclusion did not substantially impact the result (odds ratio = 1.17 [95% CI: 1.07–1.29]; P = 0.001). The results of the aforementioned MR analyses were summarized in Supplementary Table 5.
4 Discussion
Our findings provide several noteworthy findings: (1) NAFLD was independently associated with an increased risk of incident AVC in the observational analyses; (2) there was no consistent association between genetically predicted NAFLD and CAVS when considering all NAFLD susceptibility genes. However, after excluding genes associated with impaired VLDL secretion, the associations became significant between genetically predicted NAFLD and CAVS for all NAFLD-related traits, including cALT, imaging‐based and biopsy-confirmed NAFLD, as supported by multiple MR methods.
Previous studies have demonstrated a cross-sectional association between NAFLD and aortic valve sclerosis (13, 14). The observed association may be confounded by a series of coexisting cardiovascular risk factors, such as poor glycemic control, dyslipidemia and endocrine disorder (10, 34–36). In the present post hoc analysis of the MESA study, we confirmed the prospective association between NAFLD and an increased risk of incident AVC even after accounting for these potential confounding factors. These indicate that additional mechanisms beyond traditional cardiovascular and metabolic risk factors may contribute to this association. NAFLD exacerbated insulin resistance (37), caused atherogenic dyslipidemia, inflammation, and increased collagen synthesis, all of which have been implicated in the pathophysiology of valvular calcification (5). In addition, NAFLD also promoted ferroptosis (38), which was shown to be one of the main mechanisms of AVC (39). This further supports the possibility that the toxic systemic effects of NAFLD may be responsible for the observed association between NAFLD and the risk of AVC incidence.
In addition, some selected IVs (APOE, BCL7B, MTTP, TM6SF2, and PNPLA3) were reported to be related to impaired VLDL secretion, which directly affects blood lipid levels (40). After excluding these IVs, our two-sample MR analyses provide a novel perspective that NAFLD may causally impact the development of CAVS. The reasons for excluding genes related to impaired VLDL secretion were as follows. First, hyperlipidemia was recognized as a risk factor for CVD, and the above genetic variants also directly affected serum lipids, suggesting the possible influence of horizontal pleiotropy (40, 41). According to our results, when considering these IVs, the MR-Egger intercept test showed a statistically significant intercept. After exclusion of these IVs, the intercept became non-significant, indicating that we eliminated the influence of horizontal pleiotropy. In addition to considering the horizontal pleiotropy, we also excluded these IVs based on the biological reasons (42, 43). The stable isotope study has shown that increased flux of free fatty acids and higher rates of lipid synthesis are the primary causes of NAFLD (42). Furthermore, compared to individuals without NAFLD, participants with NAFLD typically exhibited an increase in VLDL secretion rather than a decrease (43).
This study has several strengths and limitations. First, to the best of our knowledge, it is the first to utilize two-sample MR analysis to examine the genetic association between NAFLD and CAVS. Second, we employed 3 gene‐exposure data of 3 different NAFLD‐related traits in combination with the use of different MR methods, which contributed to the robustness and validity of our findings. Notably, there are minor discrepancy in the results of the 3 different NAFLD-related traits. It was possibly because we identified SNPs associated with cALT based on GWAS. Thus, NAFLD susceptibility genes unrelated to cALT were not included in the MR analyses, which could affect our results. Additionally, the different sensitivities of the 3 different NAFLD-related traits to various histological stages of NAFLD may also contribute to these differences. Third, we used the latest and largest-scale available NAFLD GWAS results for the present analyses. Of note, the methodology of the foundational GWAS primarily identified NAFLD genes associated with cALT. It was likely that some NAFLD susceptibility genes, especially those unrelated to serum ALT levels, were omitted in our MR analysis. However, these NAFLD susceptibility genes were consistent with the imaging and biopsy evidence of NAFLD, suggesting that these selected genes are reliable NAFLD markers (28). Another limitation was that the original GWAS did not differentiate between the histological stages of NAFLD, a crucial distinction considering fibrosis’s specific association with cardiovascular mortality (44). Furthermore, while we excluded genes influencing NAFLD via impaired VLDL secretion, it did not guarantee the eradication of all potential horizontal pleiotropy, especially given that many of the considered SNPs exhibited expression beyond the liver.
In conclusion, our study confirmed that NAFLD was independently associated with an increased risk of incident AVC. The two-sample MR analyses further showed that genetically predicted NAFLD was also associated with CAVS incidence after excluding genetic variants related to impaired VLDL secretion. These findings underscore the relevance of the NAFLD in the development of CAVD and carry important implications for its prevention and treatment strategies.
Data availability statement
The original contributions presented in the study are included in the article/Supplementary Material. Further inquiries can be directed to the corresponding authors.
Author contributions
QH: Conceptualization, Formal analysis, Writing – original draft. YZ: Data curation, Formal analysis, Methodology, Writing – original draft. YL: Methodology, Writing – original draft. JG: Investigation, Writing – original draft. SL: Investigation, Writing – original draft. PY: Resources, Writing – original draft. JG: Supervision, Writing – review & editing. ZL: Conceptualization, Project administration, Writing – review & editing.
Funding
The author(s) declare financial support was received for the research, authorship, and/or publication of this article. This work was supported by grants from the National Natural Science Foundation of China (82070247, 82370237, 82200442), the Guangdong Basic and Applied Basic Research Foundation (2022A1515012263) and the China Postdoctoral Science Foundation (2022M721507). The MESA was funded with federal funds from the National Heart, Lung, and Blood Institute contracts Nos. (N01-HC-95159 through N01-HC-169), and with grants from the National Center for Research Resources (UL1-TR-000040, UL1-TR-001079, and UL1-RR-025005).
Acknowledgments
We thank the investigators, the staffs, and participants in the MESA for their highly valued contributions.
Conflict of interest
The authors declare that the research was conducted in the absence of any commercial or financial relationships that could be construed as a potential conflict of interest.
Publisher’s note
All claims expressed in this article are solely those of the authors and do not necessarily represent those of their affiliated organizations, or those of the publisher, the editors and the reviewers. Any product that may be evaluated in this article, or claim that may be made by its manufacturer, is not guaranteed or endorsed by the publisher.
Supplementary material
The Supplementary Material for this article can be found online at: https://www.frontiersin.org/articles/10.3389/fendo.2024.1421642/full#supplementary-material
Abbreviations
AVC, aortic valve calcification; BMI, body mass index; cALT, chronic elevation of alanine aminotransferase; CAVD, calcific aortic valve disease; CAVS, calcific aortic valve stenosis; CVD, cardiovascular disease; GWAS, genome-wide association study; HU, Hounsfield Units; HR, hazard ratio; IVs, instrumental variables; IVW, inverse variance weighted; MESA, Multi-Ethnic Study of Atherosclerosis; MR, Mendelian randomization; NAFLD, non-alcoholic fatty liver disease; SNPs, single nucleotide polymorphisms; VLDL, very low-density lipoprotein.
References
1. Riazi K, Azhari H, Charette JH, Underwood FE, King JA, Afshar EE, et al. The prevalence and incidence of NAFLD worldwide: a systematic review and meta-analysis. Lancet Gastroenterol Hepatol. (2022) 7:851–61. doi: 10.1016/S2468-1253(22)00165-0
2. Younossi ZM, Golabi P, de Avila L, Paik JM, Srishord M, Fukui N, et al. The global epidemiology of NAFLD and NASH in patients with type 2 diabetes: A systematic review and meta-analysis. J Hepatol. (2019) 71:793–801. doi: 10.1016/j.jhep.2019.06.021
3. Powell EE, Wong VW, Rinella M. Non-alcoholic fatty liver disease. Lancet. (2021) 397:2212–24. doi: 10.1016/S0140-6736(20)32511-3
4. Targher G, Byrne CD, Tilg H. NAFLD and increased risk of cardiovascular disease: clinical associations, pathophysiological mechanisms and pharmacological implications. Gut. (2020) 69:1691–705. doi: 10.1136/gutjnl-2020-320622
5. Kraler S, Blaser MC, Aikawa E, Camici GG, Lüscher TF. Calcific aortic valve disease: from molecular and cellular mechanisms to medical therapy. Eur Heart J. (2022) 43:683–97. doi: 10.1093/eurheartj/ehab757
6. Xu K, Xie S, Huang Y, Zhou T, Liu M, Zhu P, et al. Cell-type transcriptome Atlas of Human aortic valves reveal cell heterogeneity and endothelial to mesenchymal transition involved in calcific aortic valve disease. Arterioscler Thromb Vasc Biol. (2020) 40:2910–21. doi: 10.1161/ATVBAHA.120.314789
7. Yadgir S, Johnson CO, Aboyans V, Adebayo OM, Adedoyin RA, Afarideh M, et al. Global, regional, and national burden of calcific aortic valve and degenerative mitral valve diseases, 1990–2017. Circulation. (2020) 141:1670–80. doi: 10.1161/CIRCULATIONAHA.119.043391
8. Guddeti RR, Patil S, Ahmed A, Sharma A, Aboeata A, Lavie CJ, et al. Lipoprotein(a) and calcific aortic valve stenosis: A systematic review. Prog Cardiovasc Dis. (2020) 63:496–502. doi: 10.1016/j.pcad.2020.06.002
9. Osnabrugge RL, Mylotte D, Head SJ, Van Mieghem NM, Nkomo VT, LeReun CM, et al. Aortic stenosis in the elderly: disease prevalence and number of candidates for transcatheter aortic valve replacement: a meta-analysis and modeling study. J Am Coll Cardiol. (2013) 62:1002–12. doi: 10.1016/j.jacc.2013.05.015
10. Thanassoulis G, Massaro JM, Cury R, Manders E, Benjamin EJ, Vasan RS, et al. Associations of long-term and early adult atherosclerosis risk factors with aortic and mitral valve calcium. J Am Coll Cardiol. (2010) 55:2491–8. doi: 10.1016/j.jacc.2010.03.019
11. Stols-Gonçalves D, Hovingh GK, Nieuwdorp M, Holleboom AG. NAFLD and atherosclerosis: Two sides of the same dysmetabolic coin? Trends Endocrinol Metab. (2019) 30:891–902. doi: 10.1016/j.tem.2019.08.008
12. Sung KC, Yoo TK, Lee MY, Byrne CD, Zheng MH, Targher G. Comparative associations of nonalcoholic fatty liver disease and metabolic dysfunction-associated fatty liver disease with coronary artery calcification: A cross-sectional and Longitudinal Cohort Study. Arterioscler Thromb Vasc Biol. (2023) 43:482–91. doi: 10.1161/ATVBAHA.122.318661
13. Ergül E, Emlek N, Yılmaz AS, Öztürk M, Aydın C. Non-alcoholic fatty liver disease and liver fibrosis score have an independent relationship with the presence of mitral annular calcification. Int J Cardiovasc Imaging. (2023) 39:1431–6. doi: 10.1007/s10554–023-02358–2
14. Mantovani A, Pernigo M, Bergamini C, Bonapace S, Lipari P, Valbusa F, et al. Heart valve calcification in patients with type 2 diabetes and nonalcoholic fatty liver disease. Metabolism. (2015) 64:879–87. doi: 10.1016/j.metabol.2015.04.003
15. Sekula P, Del Greco MF, Pattaro C, Köttgen A. Mendelian randomization as an approach to assess causality using observational data. J Am Soc Nephrol. (2016) 27:3253–65. doi: 10.1681/ASN.2016010098
16. Bild DE, Bluemke DA, Burke GL, Detrano R, Diez Roux AV, Folsom AR, et al. Multi-Ethnic Study of Atherosclerosis: objectives and design. Am J Epidemiol. (2002) 156:871–81. doi: 10.1093/aje/kwf113
17. Zeb I, Li D, Nasir K, Katz R, Larijani VN, Budoff MJ. Computed tomography scans in the evaluation of fatty liver disease in a population based study: the multi-ethnic study of atherosclerosis. Acad Radiol. (2012) 19:811–8. doi: 10.1016/j.acra.2012.02.022
18. Tota-Maharaj R, Blaha MJ, Zeb I, Katz R, Blankstein R, Blumenthal RS, et al. Ethnic and sex differences in fatty liver on cardiac computed tomography: the multi-ethnic study of atherosclerosis. Mayo Clin Proc. (2014) 89:493–503. doi: 10.1016/j.mayocp.2013.12.015
19. Bydder GM, Chapman RW, Harry D, Bassan L, Sherlock S, Kreel L. Computed tomography attenuation values in fatty liver. J Comput Tomogr. (1981) 5:33–5. doi: 10.1016/0149-936X(81)90054-0
20. De Brito JN, McDonough DJ, Mathew M, VanWagner LB, Schreiner PJ, Gabriel KP, et al. Young adult physical activity trajectories and midlife nonalcoholic fatty liver disease. JAMA Netw Open. (2023) 6:e2338952. doi: 10.1001/jamanetworkopen.2023.38952
21. Elmariah S, Delaney JA, O'Brien KD, Budoff MJ, Vogel-Claussen J, Fuster V, et al. Bisphosphonate use and prevalence of valvular and vascular calcification in women MESA (The Multi-Ethnic Study of Atherosclerosis). J Am Coll Cardiol. (2010) 56:1752–9. doi: 10.1016/j.jacc.2010.05.050
22. Budoff MJ, Takasu J, Katz R, Mao S, Shavelle DM, O'Brien KD, et al. Reproducibility of CT measurements of aortic valve calcification, mitral annulus calcification, and aortic wall calcification in the multi-ethnic study of atherosclerosis. Acad Radiol. (2006) 13:166–72. doi: 10.1016/j.acra.2005.09.090
23. Agatston AS, Janowitz WR, Hildner FJ, Zusmer NR, Viamonte M Jr., Detrano R. Quantification of coronary artery calcium using ultrafast computed tomography. J Am Coll Cardiol. (1990) 15:827–32. doi: 10.1016/0735-1097(90)90282-T
24. Katz R, Budoff MJ, Takasu J, Shavelle DM, Bertoni A, Blumenthal RS, et al. Relationship of metabolic syndrome with incident aortic valve calcium and aortic valve calcium progression: the Multi-Ethnic Study of Atherosclerosis (MESA). Diabetes. (2009) 58:813–9. doi: 10.2337/db08-1515
25. Hao QY, Gao JW, Yuan ZM, Gao M, Wang JF, Schiele F, et al. Remnant cholesterol and the risk of coronary artery calcium progression: Insights from the CARDIA and MESA study. Circ Cardiovasc Imaging. (2022) 15:e014116. doi: 10.1161/CIRCIMAGING.122.014116
26. Vujkovic M, Ramdas S, Lorenz KM, Guo X, Darlay R, Cordell HJ, et al. A multiancestry genome-wide association study of unexplained chronic ALT elevation as a proxy for nonalcoholic fatty liver disease with histological and radiological validation. Nat Genet. (2022) 54:761–71. doi: 10.1038/s41588-022-01078-z
27. Gaziano JM, Concato J, Brophy M, Fiore L, Pyarajan S, Breeling J, et al. Million Veteran Program: A mega-biobank to study genetic influences on health and disease. J Clin Epidemiol. (2016) 70:214–23. doi: 10.1016/j.jclinepi.2015.09.016
28. Ren Z, Simons P, Wesselius A, Stehouwer CDA, Brouwers M. Relationship between NAFLD and coronary artery disease: A Mendelian randomization study. Hepatology. (2023) 77:230–8. doi: 10.1002/hep.32534
29. Pierce BL, Ahsan H, Vanderweele TJ. Power and instrument strength requirements for Mendelian randomization studies using multiple genetic variants. Int J Epidemiol. (2011) 40:740–52. doi: 10.1093/ije/dyq151
30. Burgess S, Scott RA, Timpson NJ, Davey Smith G, Thompson SG. Using published data in Mendelian randomization: a blueprint for efficient identification of causal risk factors. Eur J Epidemiol. (2015) 30:543–52. doi: 10.1007/s10654-015-0011-z
31. Sun D, Zhou T, Heianza Y, Li X, Fan M, Fonseca VA, et al. Type 2 diabetes and hypertension. Circ Res. (2019) 124:930–7. doi: 10.1161/CIRCRESAHA.118.314487
32. Bowden J, Davey Smith G, Burgess S. Mendelian randomization with invalid instruments: effect estimation and bias detection through Egger regression. Int J Epidemiol. (2015) 44:512–25. doi: 10.1093/ije/dyv080
33. Peng H, Wang S, Wang M, Ye Y, Xue E, Chen X, et al. Nonalcoholic fatty liver disease and cardiovascular diseases: A Mendelian randomization study. Metabolism. (2022) 133:155220. doi: 10.1016/j.metabol.2022.155220
34. Katsiki N, Mikhailidis DP, Mantzoros CS. Non-alcoholic fatty liver disease and dyslipidemia: An update. Metabolism. (2016) 65:1109–23. doi: 10.1016/j.metabol.2016.05.003
35. Katz R, Wong ND, Kronmal R, Takasu J, Shavelle DM, Probstfield JL, et al. Features of the metabolic syndrome and diabetes mellitus as predictors of aortic valve calcification in the Multi-Ethnic Study of Atherosclerosis. Circulation. (2006) 113:2113–9. doi: 10.1161/CIRCULATIONAHA.105.598086
36. Ouyang L, Yu C, Xie Z, Su X, Xu Z, Song P, et al. Indoleamine 2,3-dioxygenase 1 deletion-mediated kynurenine insufficiency in vascular smooth muscle cells exacerbates arterial calcification. Circulation. (2022) 145:1784–98. doi: 10.1161/CIRCULATIONAHA.121.057868
37. Meex RCR, Watt MJ. Hepatokines: linking nonalcoholic fatty liver disease and insulin resistance. Nat Rev Endocrinol. (2017) 13:509–20. doi: 10.1038/nrendo.2017.56
38. Wang W, Chai L, Chen X, Li Z, Feng L, Hu W, et al. Imaging changes in the polarity of lipid droplets during NAFLD-Induced ferroptosis via a red-emitting fluorescent probe with a large Stokes shift. Biosens Bioelectron. (2023) 231:115289. doi: 10.1016/j.bios.2023.115289
39. Xu R, Huang Y, Zhu D, Guo J. Iron promotes Slc7a11-deficient valvular interstitial cell osteogenic differentiation: A possible mechanism by which ferroptosis participates in intraleaflet hemorrhage-induced calcification. Free Radic Biol Med. (2022) 184:158–69. doi: 10.1016/j.freeradbiomed.2022.03.013
40. Liu DJ, Peloso GM, Yu H, Butterworth AS, Wang X, Mahajan A, et al. Exome-wide association study of plasma lipids in >300,000 individuals. Nat Genet. (2017) 49:1758–66. doi: 10.1038/ng.3977
41. Brouwers M, Simons N, Stehouwer CDA, Isaacs A. Non-alcoholic fatty liver disease and cardiovascular disease: assessing the evidence for causality. Diabetologia. (2020) 63:253–60. doi: 10.1007/s00125-019-05024-3
42. Lambert JE, Ramos-Roman MA, Browning JD, Parks EJ. Increased de novo lipogenesis is a distinct characteristic of individuals with nonalcoholic fatty liver disease. Gastroenterology. (2014) 146:726–35. doi: 10.1053/j.gastro.2013.11.049
43. Adiels M, Taskinen MR, Packard C, Caslake MJ, Soro-Paavonen A, Westerbacka J, et al. Overproduction of large VLDL particles is driven by increased liver fat content in man. Diabetologia. (2006) 49:755–65. doi: 10.1007/s00125-005-0125-z
Keywords: calcific aortic valve disease, non-alcoholic fatty liver disease, aortic valve calcification, Mendelian randomization analyses, risk
Citation: Hao Q-Y, Zeng Y-H, Lin Y, Guo J-B, Li S-C, Yang P-Z, Gao J-W and Li Z-H (2024) Observational and genetic association of non-alcoholic fatty liver disease and calcific aortic valve disease. Front. Endocrinol. 15:1421642. doi: 10.3389/fendo.2024.1421642
Received: 22 April 2024; Accepted: 25 June 2024;
Published: 09 July 2024.
Edited by:
Guanghong Jia, University of Missouri, United StatesReviewed by:
Liu Ouyang, Georgia State University, United StatesIshita Tandon, University of Arkansas, United States
Copyright © 2024 Hao, Zeng, Lin, Guo, Li, Yang, Gao and Li. This is an open-access article distributed under the terms of the Creative Commons Attribution License (CC BY). The use, distribution or reproduction in other forums is permitted, provided the original author(s) and the copyright owner(s) are credited and that the original publication in this journal is cited, in accordance with accepted academic practice. No use, distribution or reproduction is permitted which does not comply with these terms.
*Correspondence: Ze-Hua Li, emVodWFsaUBzbXUuZWR1LmNu; Jing-Wei Gao, Z2Fvanc1QG1haWwyLnN5c3UuZWR1LmNu
†These authors have contributed equally to this work