
94% of researchers rate our articles as excellent or good
Learn more about the work of our research integrity team to safeguard the quality of each article we publish.
Find out more
ORIGINAL RESEARCH article
Front. Endocrinol., 08 November 2023
Sec. Obesity
Volume 14 - 2023 | https://doi.org/10.3389/fendo.2023.1290639
This article is part of the Research TopicMolecular Mechanisms Underlying Exercise-Alleviated Sarcopenic ObesityView all 5 articles
 Xuezhi Rao1,2†Zhijie Xu1,3†Jingchun Zhang4Jiaxiang Zhou5*Jian Huang6Zhanhao Toh7Ruwen Zheng6*Zhiyu Zhou8,9*
Background: Both benign prostatic hyperplasia (BPH) and sarcopenic obesity (SO) are common conditions among older adult/adults males. The prevalent lifestyle associated with SO is a significant risk factor for the development of BPH. Therefore, we investigated the causal relationship between SO factors and BPH.
Method: The instrumental variables for SO factors were selected using the inverse variance-weighted method, which served as the primary approach for Mendelian randomization analysis to assess the causal effect based on summary data derived from genome-wide association studies of BPH.
Result: The increase in BMR (OR = 1.248; 95% CI = (1.087, 1.432); P = 0.002) and ALM (OR = 1.126; 95% CI = (1.032, 1.228); P = 0.008) was found to be associated with an elevated risk of BPH. However, no genetic causality between fat-free mass distribution, muscle mass distribution, and BPH was observed.
Conclusion: Our findings indicate that a genetic causal association between BMR, ALM and BPH. BMR and ALM are risk factors for BPH. The decrease in BMR and ALM signified the onset and progression of SO, thus SO is a protective factor for BPH.
With the increasing global aging population (1), the prevalence of benign prostatic hyperplasia (BPH) is resulting in a significant economic burden. Consequently, the prevention and treatment of BPH will pose a major challenge in the future (2). Several Mendelian randomization studies have consistently demonstrated that waist circumference, sedentary behavior (3), thyroid disorders (4), higher education level (5), and bioavailable testosterone (6) are risk factors for BPH.
Obesity plays a crucial and precarious role in the pathogenesis of BPH (7–12). However, previous studies have indicated a lack of causal relationship between body mass index (BMI) and BPH (3). This contradicts the findings from existing clinical trial observations (13). Disparities in this context may arise from varying prevalence of distinct obesity subtypes in diverse research efforts (14). BMI, while reflecting overall obesity, obscures nuances like abdominal or sarcopenic obesity (SO), hindering differentiation of obesity types statistically. Recognizing these varied obesity profiles is crucial due to their differing risks in BPH development. Waist circumference (WC) plays a pivotal role in diagnosing abdominal obesity, closely related to prostate volume and IPSS scores (15, 16), as affirmed in recent MR studies. Relying solely on BMI obscures understanding of obesity’s interplay with BPH, differing from observational trials and MR findings. Adoption of representative obesity subtype markers is thus vital. The correlation between WC and BPH is supported by observational studies and MR research (3), highlighting SO’s substantial impact on older individuals’ lives. In order to gain a deeper comprehension of the relationship between obesity and BPH, it is necessary to do further research into the correlation between SO and BPH. BPH is an age-related condition, with a higher incidence observed among the older adult/adults population, 50% of men over the age of 50 shown to have evidence of BPH, BPH prevalence comes to 80% in those over 70 years (7). Among the older adult/adults population, the most prevalent form of obesity is SO (17, 18). Addressing SO (19) and BPH (1) are important for preventing longterm disability in the older adults at high risk. To better understand the causal relationship between SO and BPH, we used SO-related indices that have not been previously studied. Previous investigations have suggested that increased waist circumference (WC) is a risk factor for BPH (3), which is a trait related to SO. In this study, we focused on analyzing indices related to SO, which is characterized by both obesity and decreased muscle mass (20). Basal metabolic rate (BMR) and appendicular lean mass (ALM) are factors associated with SO (21), the decrease in BMR and ALM signifies the onset and progression of SO. Since there is no direct measure of appendicular skeletal muscle mass index (ASMI) traits, ALM can serve as a main substitute to assess muscle mass and reflect the degree of muscle atrophy (22).
In this current study, we aimed to investigate the impact of SO on BPH by assessing the causal relationship between BMR, ALM, and BPH. Furthermore, we sought to explore the potential role of fat-free mass (FFM) distribution and muscle mass (MM) distribution as risk factors in the development of BPH.
Figure 1 presented the study design and the assumptions of Mendelian randomization (MR) in our study. We performed two-sample univariable and multivariable MR based on the previous Epidemiology study. This IV analysis mimics randomized controlled trial with respect to the random allocation of single nucleotide polymorphisms (SNPs) in offspring (independent of confounding factors such as sex and age). The data used in this study were obtained from recent genome-wide association studies (GWAS). Specifically, we extracted the data from the IEU OpenGWAS database, which was developed by the MRC Integrative Epidemiology Unit (IEU) at the University of Bristol (23, 24). This database offered a comprehensive collection of GWAS summary datasets that have been meticulously curated. Users can gain access to the platform by visiting the website https://gwas.mrcieu.ac.uk. In this study, we focused on BMR, ALM, and sixteen other traits that might influence the occurrence of BPH, including body fat percentage (BFP), whole body fat mass (WBFM), whole body fat-free mass (WBFFM), whole body water mass (WBWM), leg fat percentage (LFP), leg fat mass (LFM), leg fat-free mass (LFFM), leg predicted mass (LPM), arm fat percentage (AFP), arm fat mass (AFM), arm fat-free mass (AFFM), arm predicted mass (APM), trunk fat percentage (TFP), trunk fat mass (TFM), trunk fat-free mass (TFFM) and trunk predicted mass (TPM).
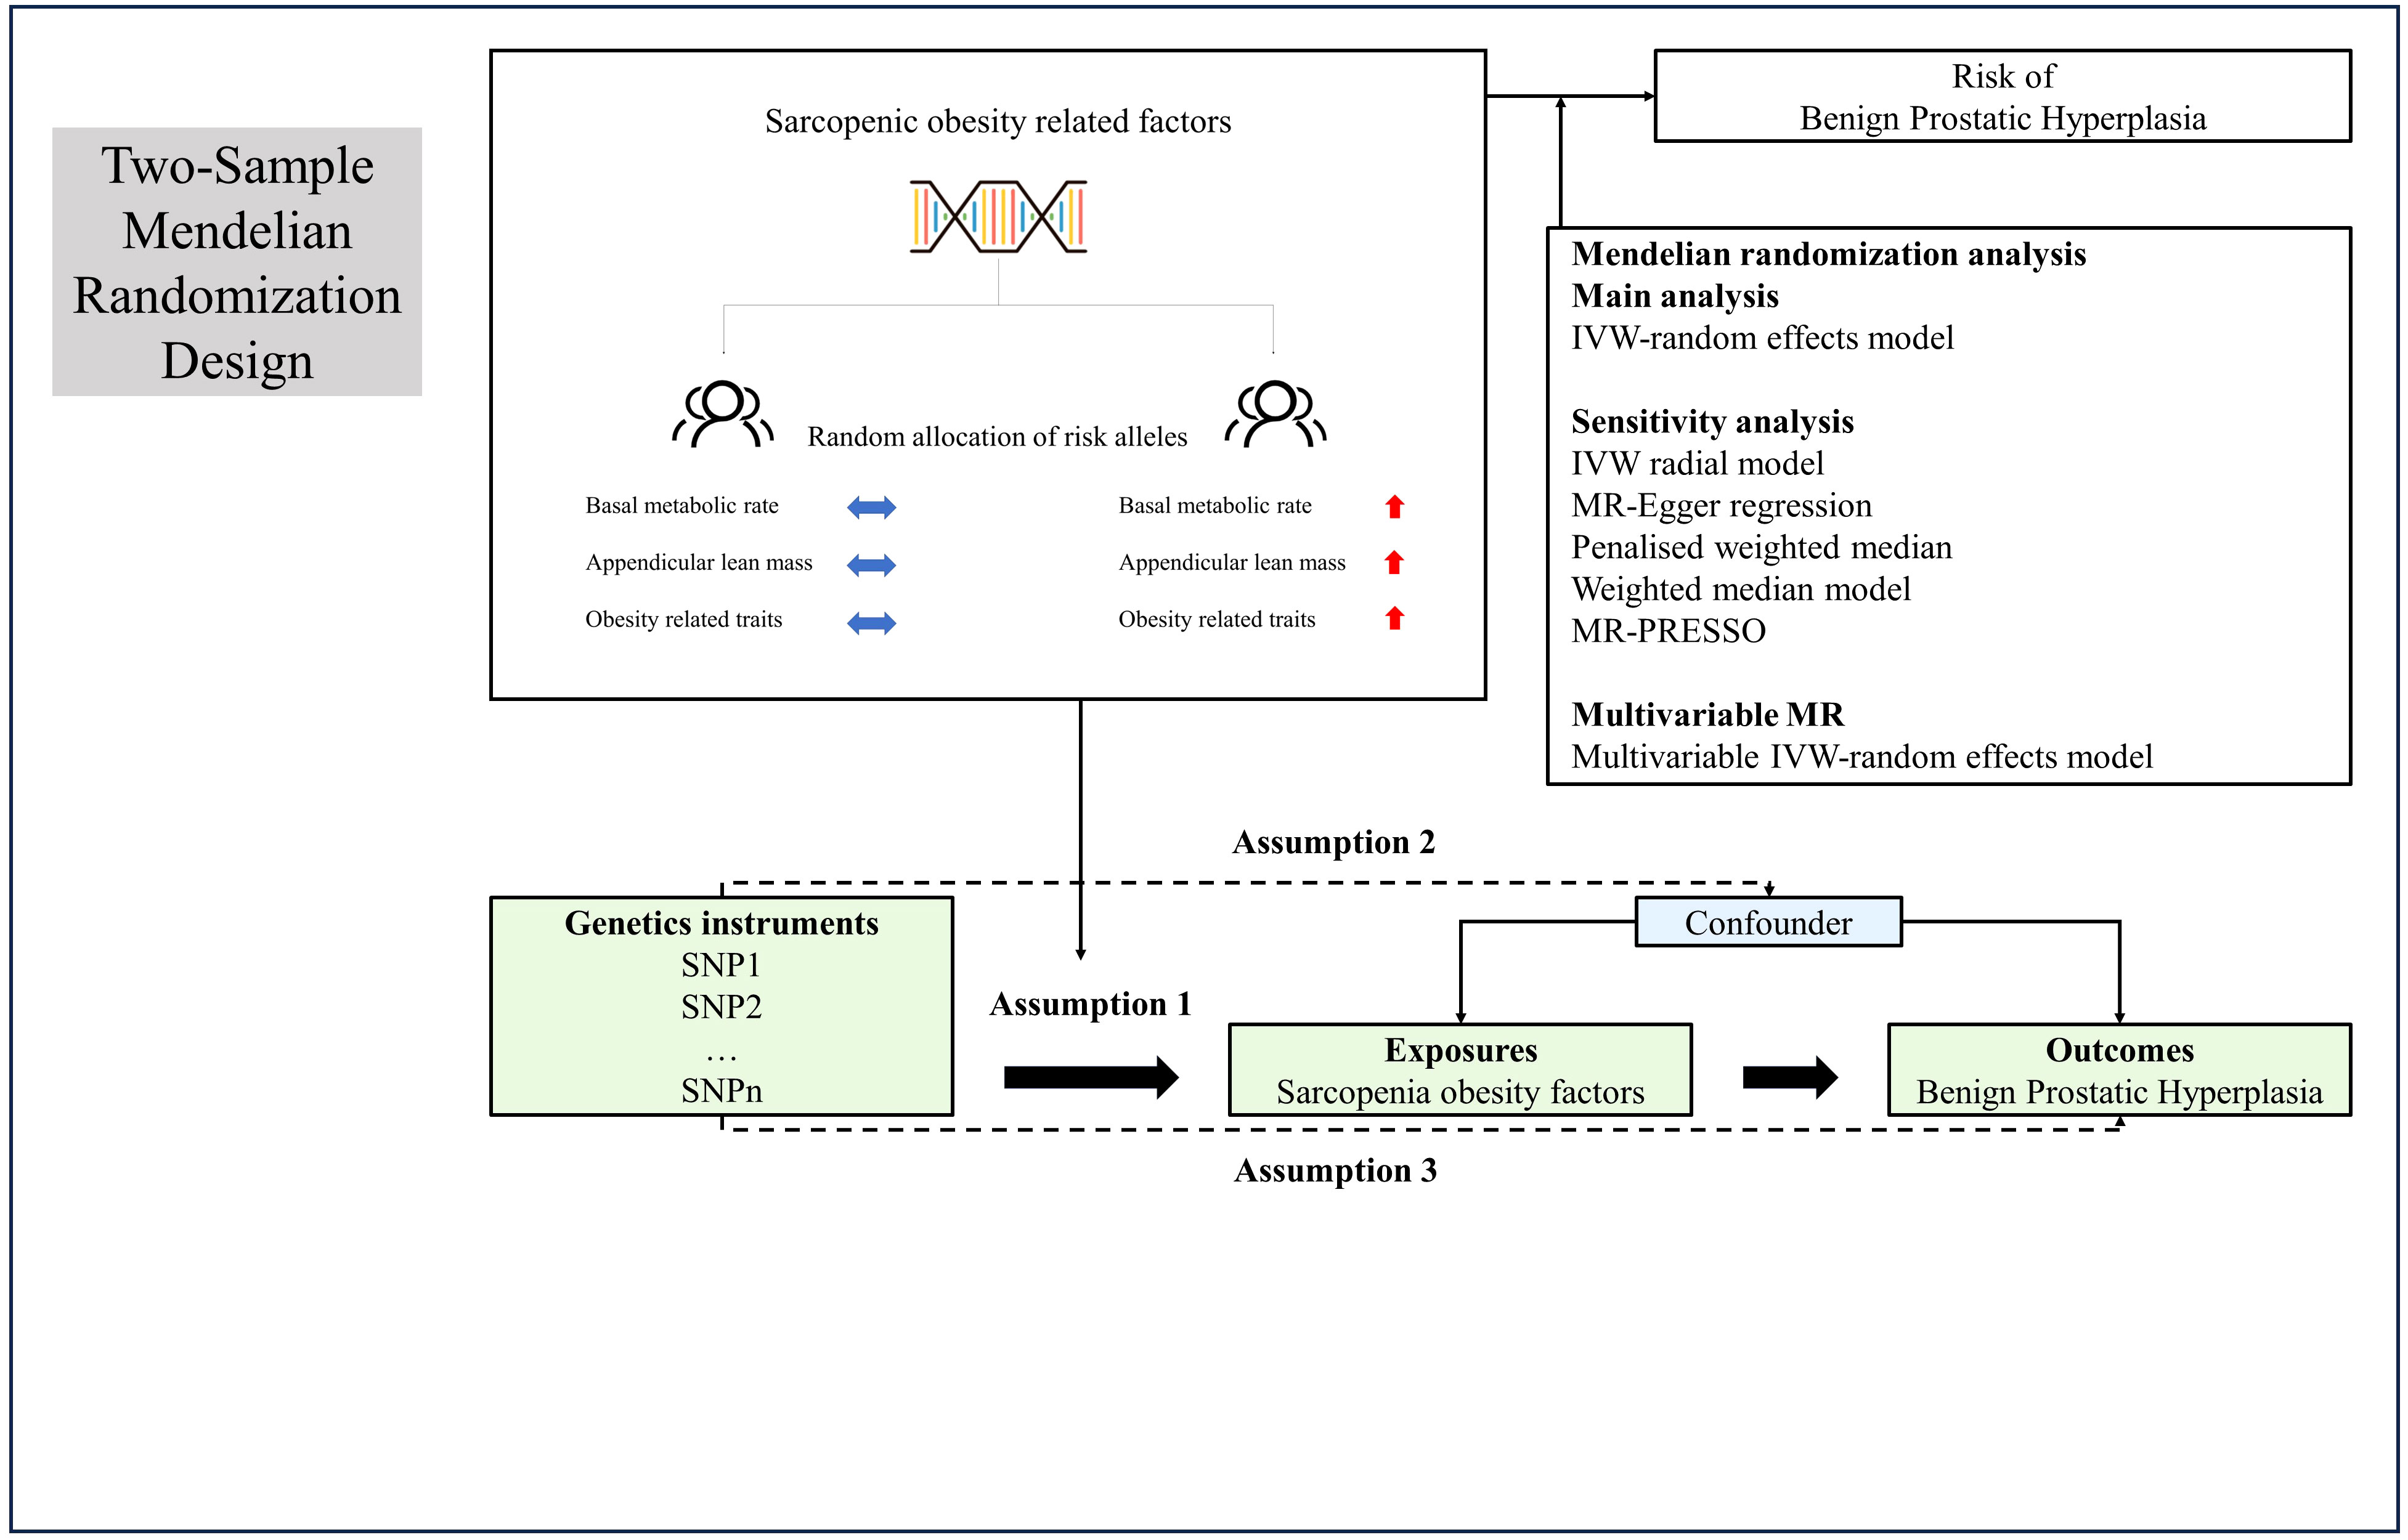
Figure 1 Overview and assumptions of the Mendelian randomization study design. Assumption 1: the instrumental variables should be closely related to the risk factor of interest; assumption 2: the instrumental variables should not be associated with potential confounders, and assumption 3: the instrumental variables should affect the risk of outcome only through risk factors and not through other alternative pathways. LD, Linkage disequilibrium; SNP, single nucleotide polymorphisms; IVW, inverse-variance weighted; PRESSO, Pleiotropy Residual Sum and Outlier.
In this investigation, we scrutinized the following traits: BMR, ALM, Obesity factors and BPH. GWAS evaluations were undertaken in contributors of European lineage, predicated upon K-means clustering (K = 4), subsequent to routine exclusions, that include withdrawn consent, suspected sex chromosome aneuploidy, and discordance between genetically inferred and self-reported sex (25). Appropriate IVs for the MR evaluations were culled from disparate GWAS summary findings. SNPs that met the rigorous criterion of genome-wide significance (p < 5 × 10⁻⁸) were selected during the initial phase. Subsequently, relevant SNPs were retained based on the linkage disequilibrium criterion, stipulated by an R² < 0.001 according to the Genome reference panel (26). SNPs exhibiting an association with the outcome variables at a significance level of p < 5 × 10⁻⁸ were methodically excluded from consideration. Variants signifying correlations with BMR, ALM, Obesity factors and BPH, meeting conventional GWAS thresholds (P < 5 × 10⁻⁸), were harnessed to fabricate genetic instruments tailored to each phenotype. A genetic instrument embodies one or numerous genetic variances imbued with attributes conducive to their utilization as an IV within the purview of MR (27). Throughout the harmonization process encompassing both exposure and outcome data sets, palindromic SNPs and those devoid of requisite information were meticulously purged. The robustness of the IVs was evaluated via the computation of F-statistics, with values beneath the threshold of 10 indicating an inherently weak instrument strength, thereby necessitating their removal from the analysis (28, 29).
The BMR and ALM metrics were derived from the UK Biobank (UKB) dataset, which included a sample size of 331,307 individuals for BMR and 205,513 individuals for ALM. Regarding the BPH phenotype, we utilized participants from the FinnGen, comprising 13,118 cases and 72,799 controls. For more comprehensive information on all the included phenotypes, please refer to Supplementary Tables 1–3.
The flow chart of our study, as depicted in Figure 2, outlines the inclusion and exclusion criteria for candidate SNPs in each exposure-outcome pair. To perform the analysis, we employed the TwoSample MR and MR-PRESSO packages in R software (version 4.3.1). We employed a P value threshold of 5 × 10⁻⁸ to identify significant SNPs for each exposure variable. To ensure independence and significance, we performed linkage disequilibrium (LD)-based clumping with parameters R2 < 0.001 and kb = 10,000 (30). These selected SNPs were then utilized for the outcome variable to calculate the effect size of each SNP. Finally, we harmonized both the exposure data and the outcome data to facilitate subsequent MR analysis.
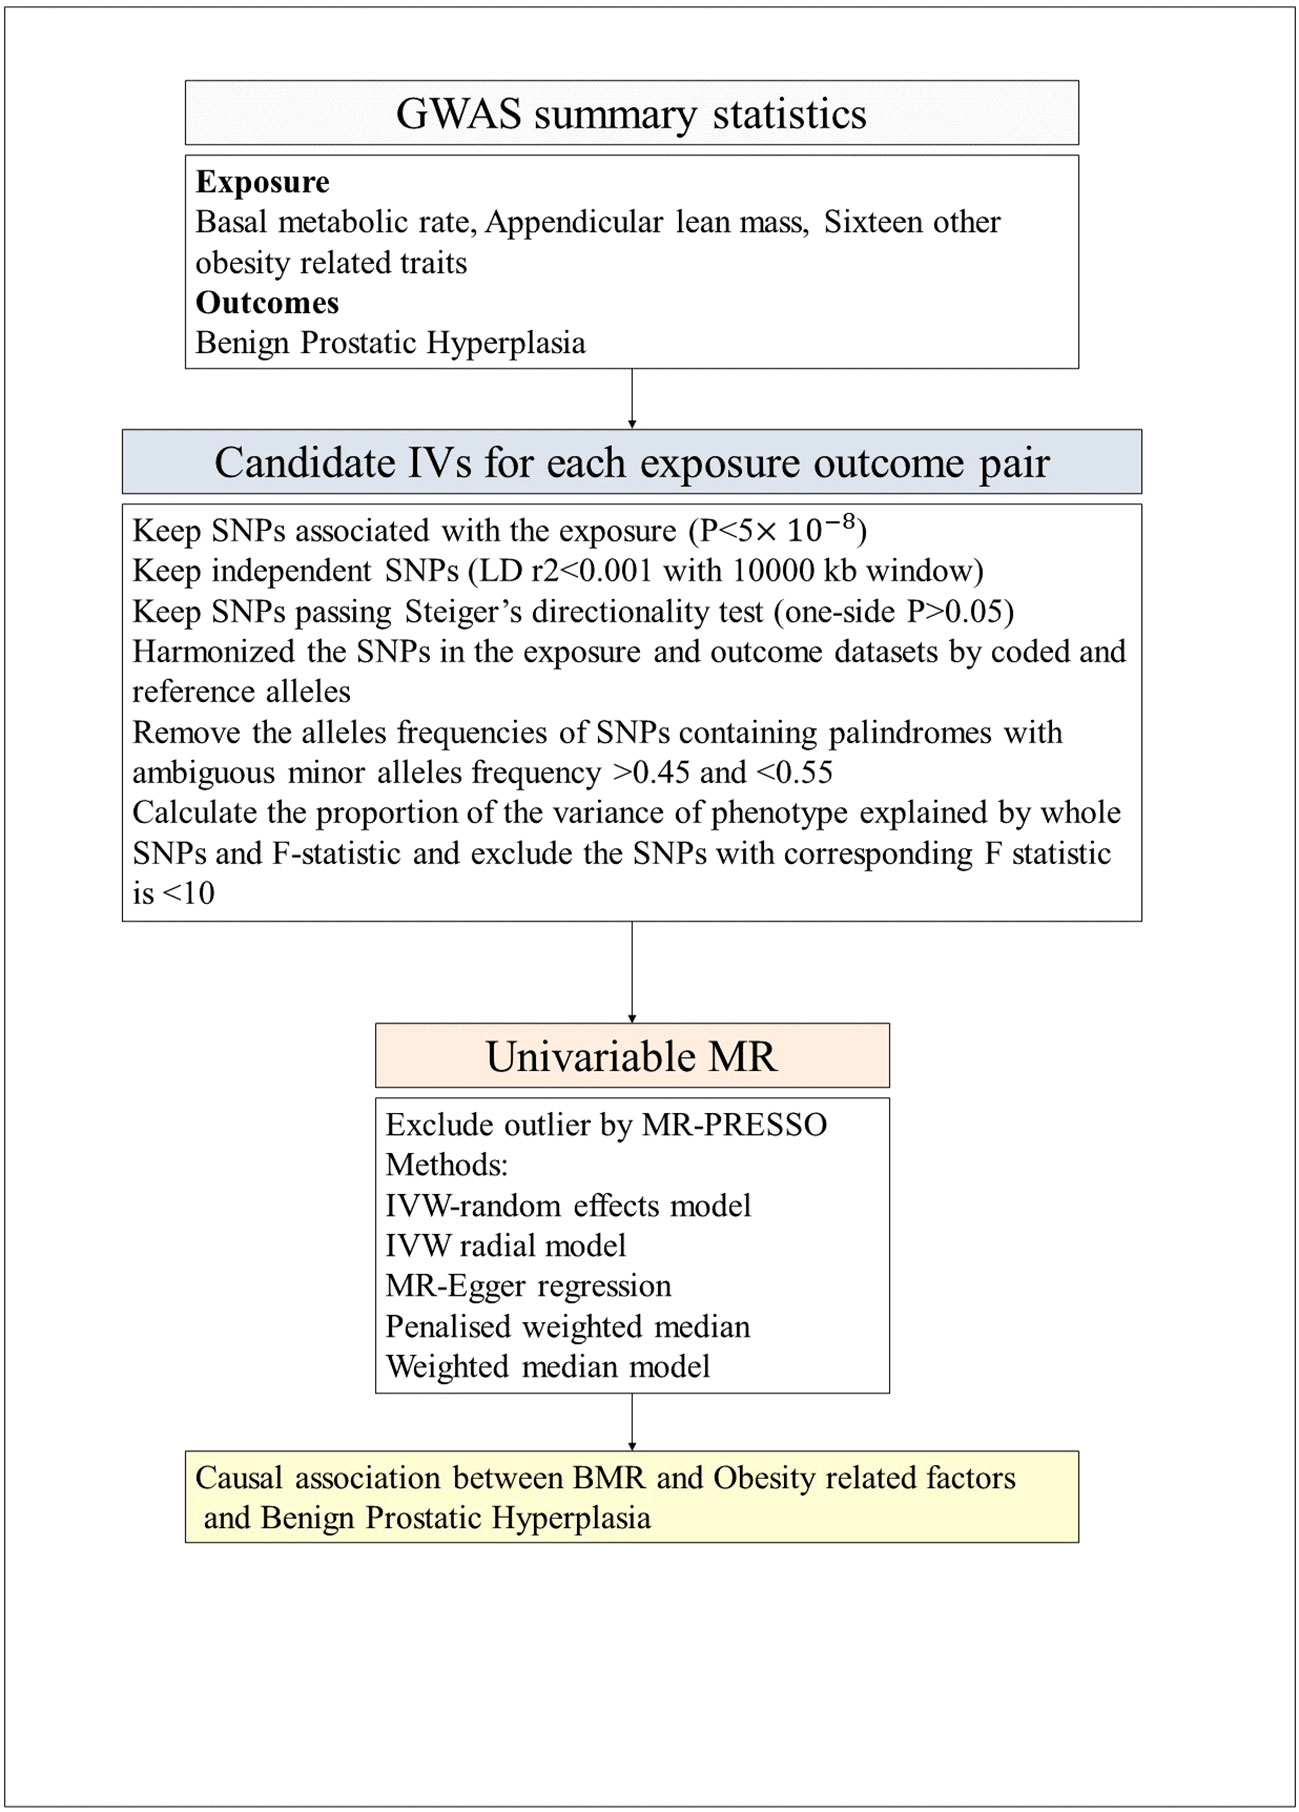
Figure 2 The flow chart of the inclusion and exclusion criterion of candidate SNPs for each exposure-outcome pair. GWAS, genome-wide association studies; LD, Linkage disequilibrium; IVW, inverse-variance weighted; PRESSO, Pleiotropy Residual Sum and Outlier; MR, Mendelian randomization; BMR, Basal metabolic rate.
A two-sample MR approach was employed to assess the association between BMR, obesity-related factors and BPH. The impact of exposure on the outcome can be estimated by calculating the ratio between the genetic outcome and genetic exposure associations. Moreover, if the genetic variants (GVs) are not in linkage disequilibrium, their ratio estimates can be combined using inverse variance weighted (IVW) methods (31) to obtain a comprehensive estimate. Causality assessment primarily relied on IVW methods when all SNPs met instrumental variable requirements. Additionally, MR-Egger regression, weighted median, weighted mode, and simple mode analyses were used for supplementary evaluation in cases involving outliers (32).
If there were no weak instrumental variables (IVs), we utilized the IVW method as the primary outcome, while considering the other methods as secondary outcomes (33). In case of significant pleiotropy detected by the MR-PRESSO method, we would address this issue by removing outlier variability and repeating the MR analysis (34). The leave-one-out test was employed to assess individual SNP effects (35). Heterogeneity was evaluated using Cochran’s Q test, with a significance level of P < 0.05 indicating substantial heterogeneity and necessitating SNP exclusion (35). The MR-Egger method provided estimates of horizontal pleiotropy through intercepts from linear regressions between SNP outcome and SNP exposure associations (36). A nominal significance level of p < 0.05 indicated statistical significance (37).
We employed multivariable MR as a statistical methodology that enables the incorporation of SNP-phenotype associations into the analysis, facilitating estimation of the direct impact of each phenotype on the outcome (38). To account for potential unbalanced horizontal pleiotropy in our analysis, we also conducted multivariable MR-Egger analyses (39).
The UVMR results are presented in Figure 3. A total of 365 SNPs related to BMR and 309 SNPs related to ALM were ultimately selected for evaluating their contributions to BPH outcome. Details of significant SNPs and relevant information for other traits can be found in Supplementary Tables 1, 2. All the SNPs exhibited sufficient strength (mean F-statistic > 10) and demonstrated the correct causal direction.
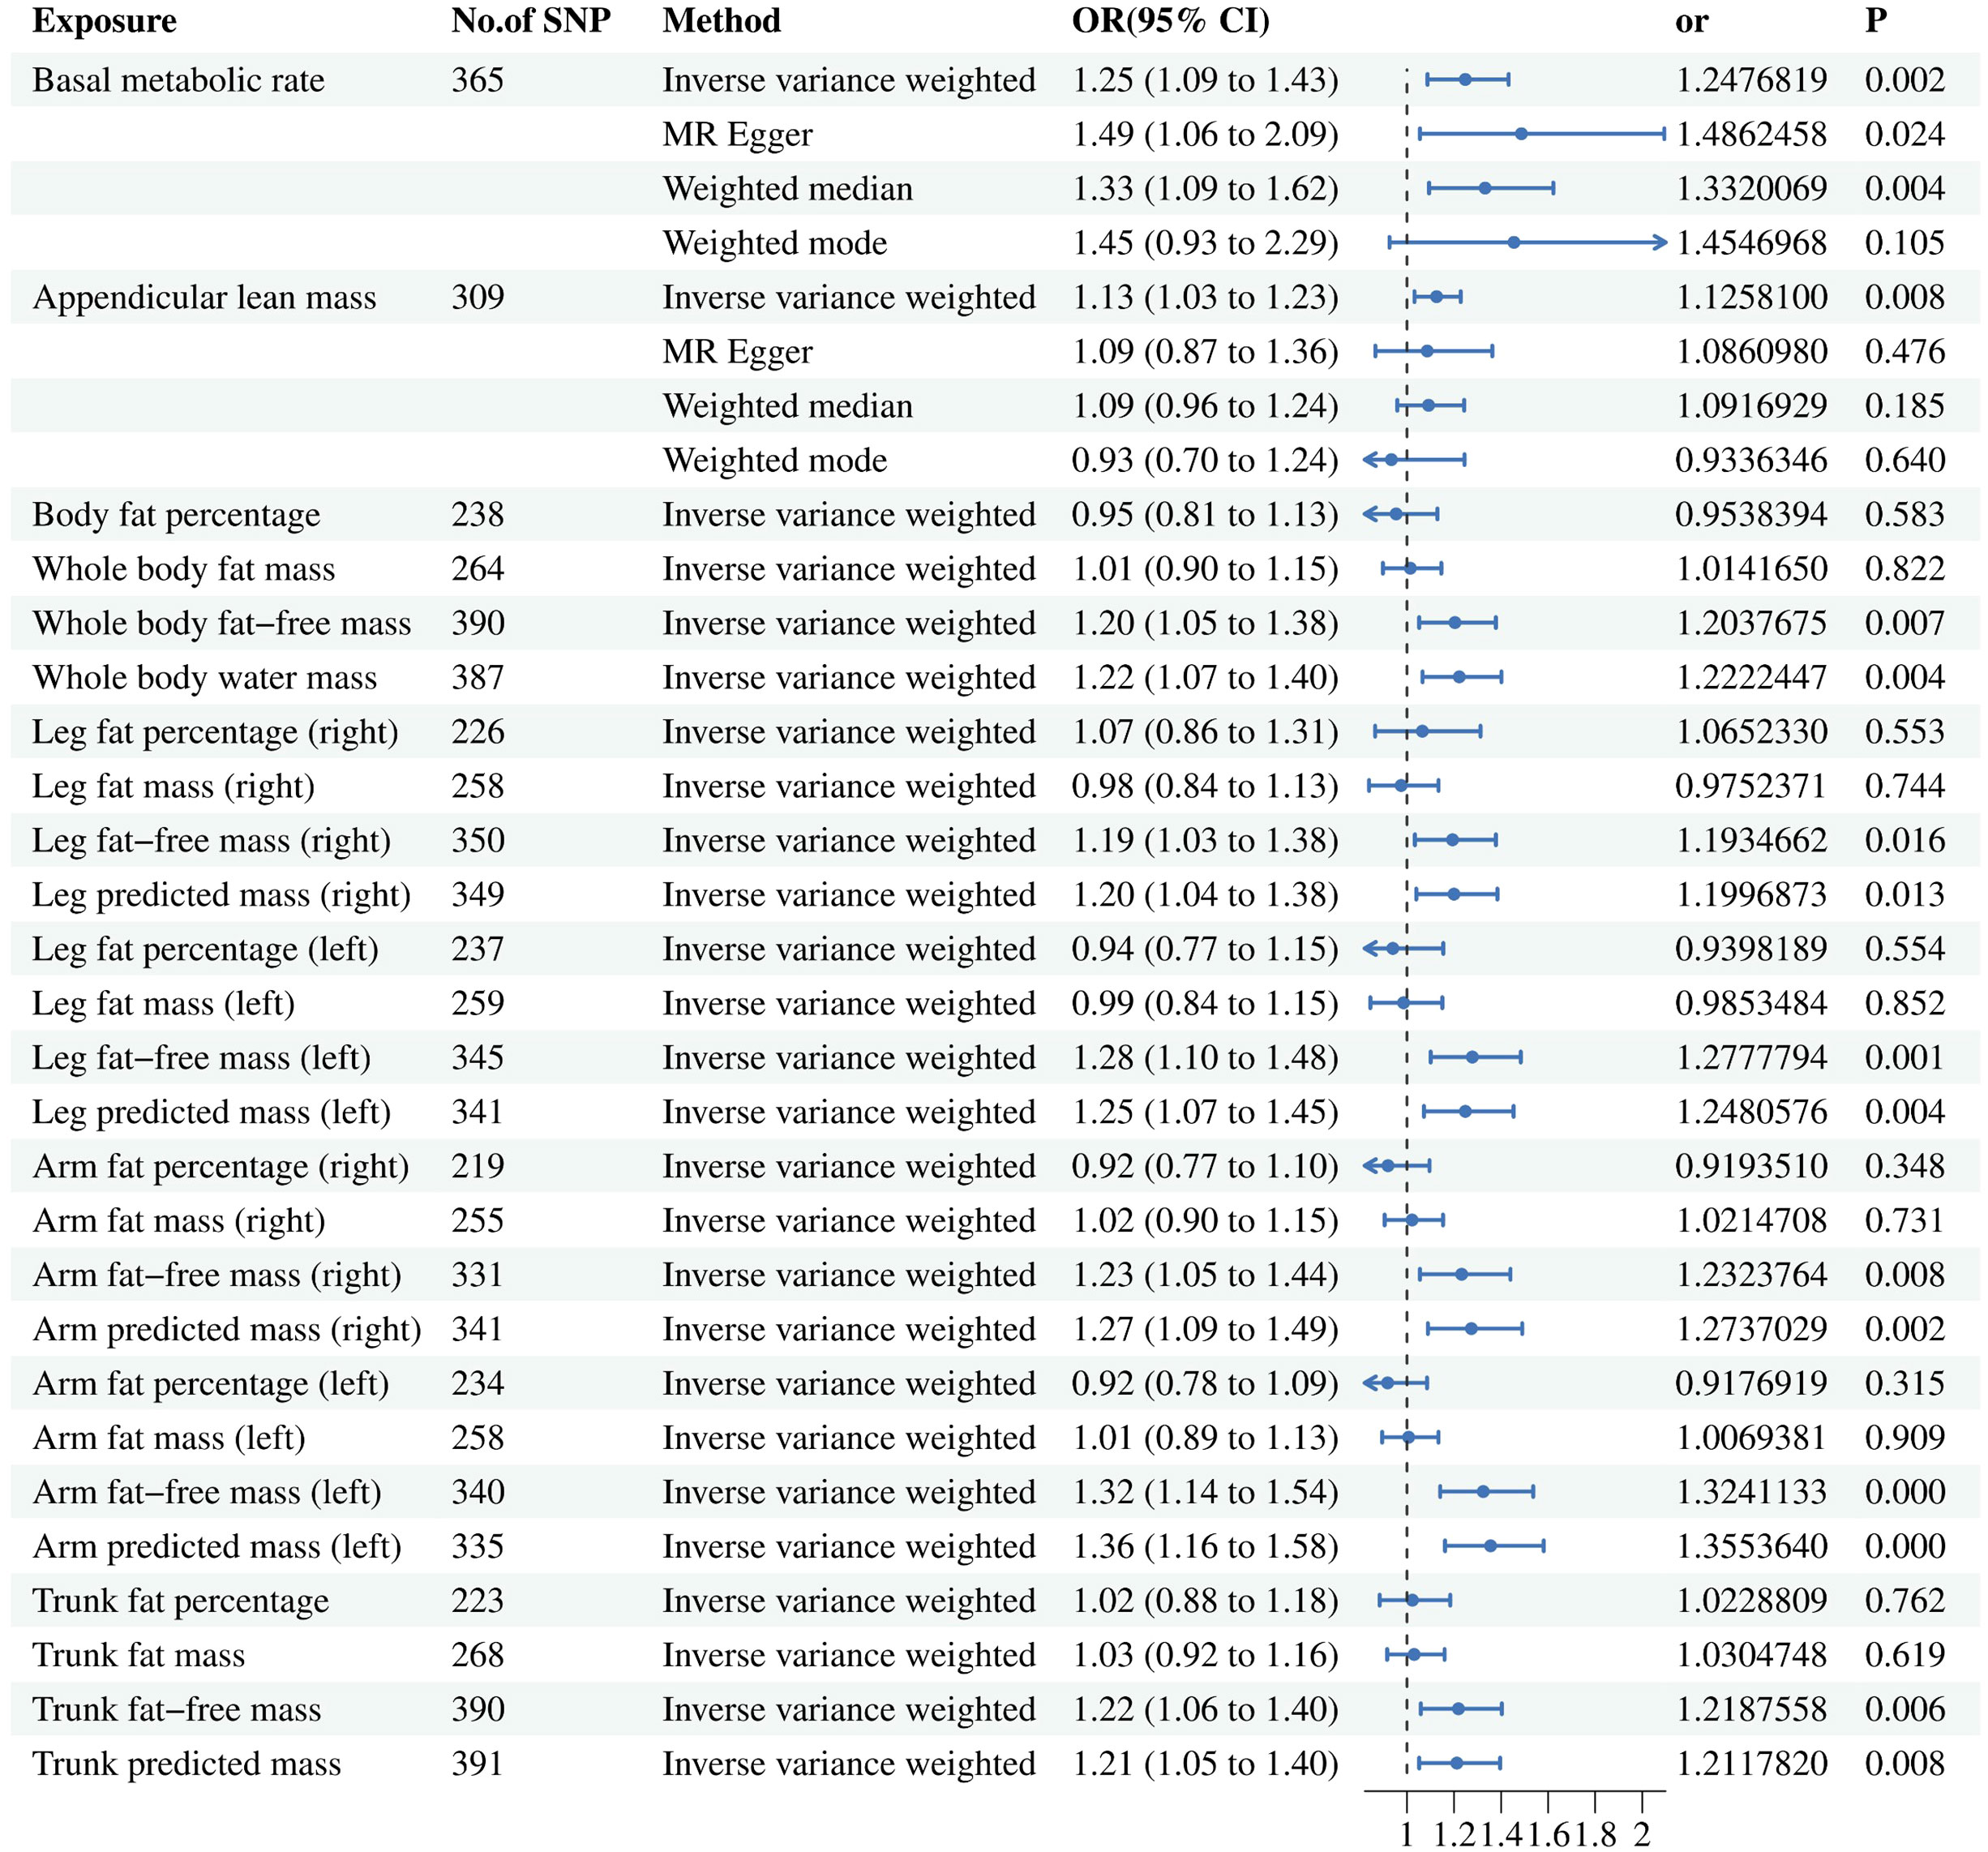
Figure 3 Associations of genetically predicted risk factors with benign prostatic hyperplasia using random effect inverse-variance weighted method. IVW, inverse-variance weighted; OR, odds ratio; CL, confidence interval; SNP, single nucleotide polymorphism.
After conducting a comprehensive meta-regression analysis, we made a significant observation that an increase in BMR (ORIVW = 1.248; 95% CI = (1.087, 1.432); P = 0.002) and ALM (ORIVW = 1.126; 95% CI = (1.032, 1.228); P = 0.008) is associated with an elevated risk of developing BPH. Furthermore, even after removing outliers through the MR-PRESSO analysis, the association between BMR and ALM with BPH remained robust as indicated by non-significant distortion test results (P > 0.05). However, it should be noted that no statistically significant relationship was observed between ALM and BPH using the other three methods. In the context of more precise muscle mass and fat distribution, the fat-free mass related factors have causal relationship with BPH, while the fat-percentage factors have not.
Details of significant SNPs and relevant information for MVMR traits can be found in Supplementary Tables 4-6. All the SNPs exhibited sufficient strength (mean F-statistic > 10) and demonstrated the correct causal direction. All MVMR results were listed in Figures 4 and 5. The MVMR analysis did not reveal any genetic causal associations. The genetic causality between the distribution of FFM, MM, and BPH was not observed. The leave-one-out sensitivity analysis, funnel plots, scatter diagram and forest map can be fund from Supplementary Figure 3-1 to Supplementary Figure 3-4. None horizontal pleiotropy were found. Heterogeneity were found in MVMR, the heterogeneity test result can be found in Supplementary Table 8.
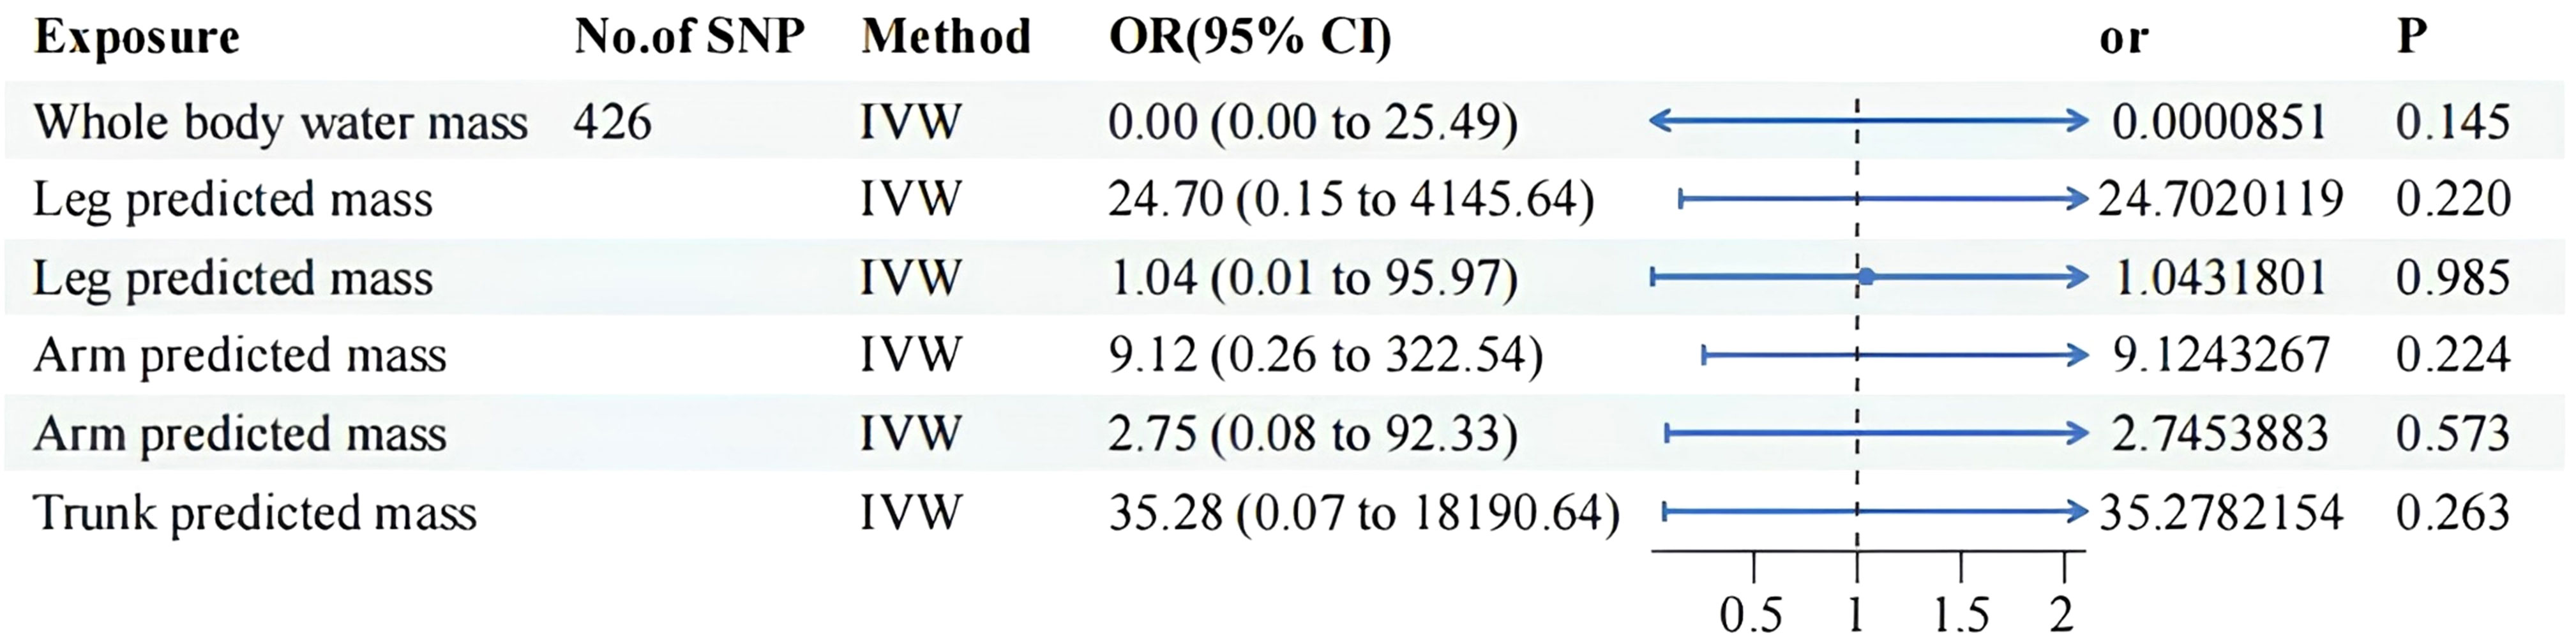
Figure 4 MVMR result of predicted mass related factors using random effect inverse-variance weighted method. IVW, inverse-variance weighted; OR, odds ratio; CI confidence interval; SNP, single nucleotide polymorphism.
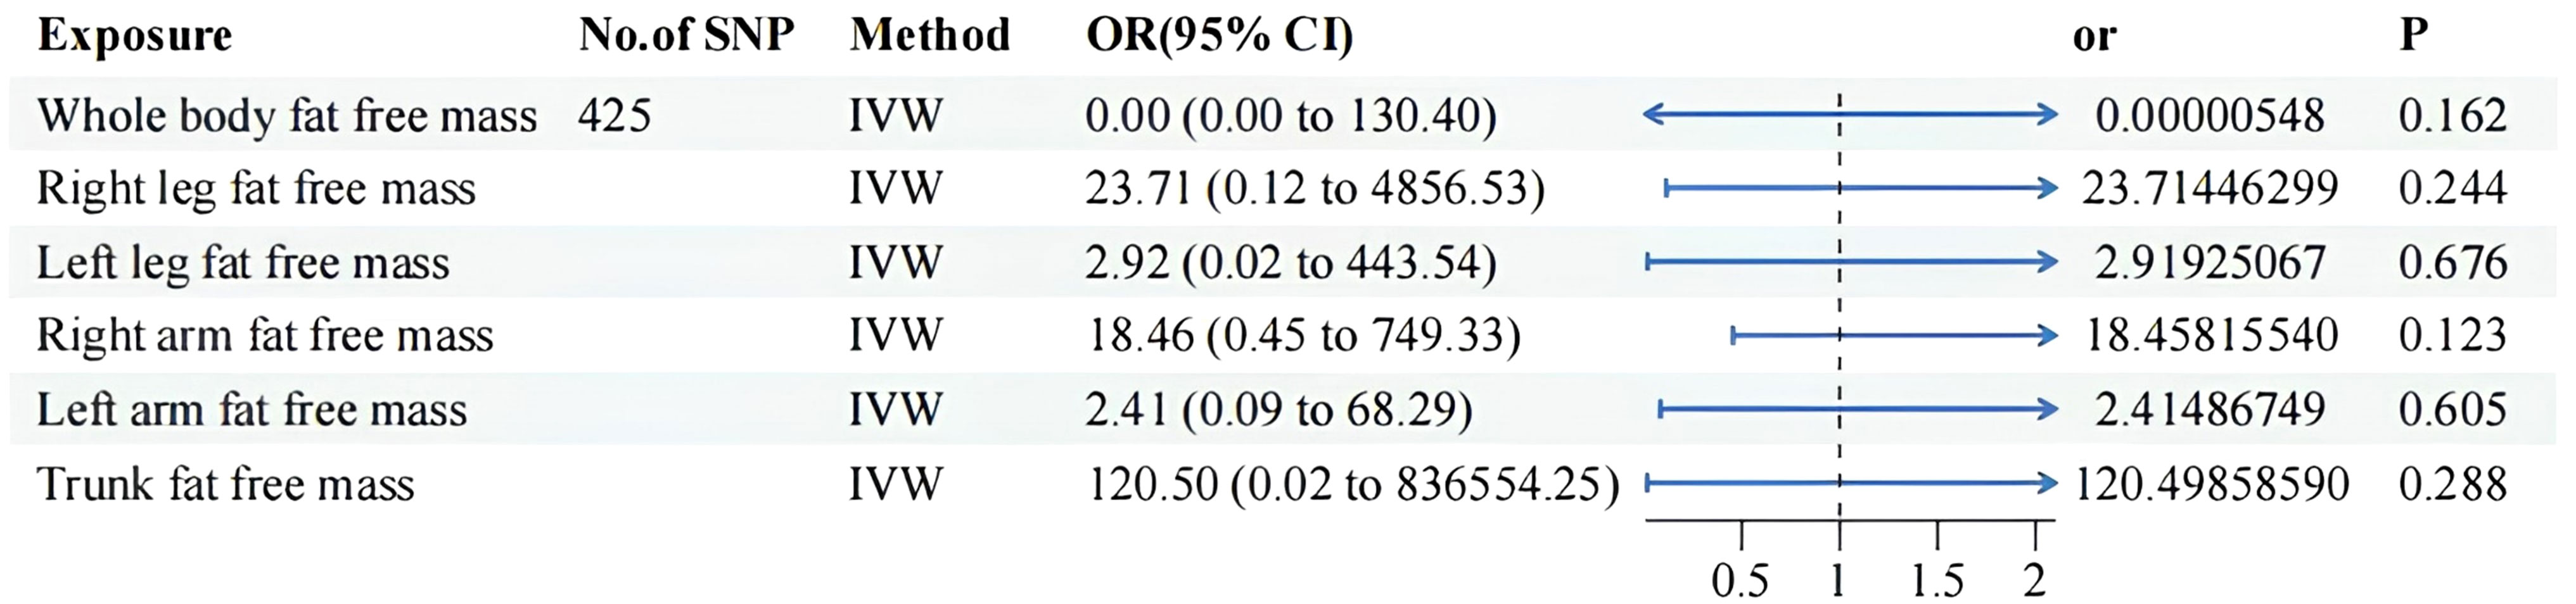
Figure 5 MVMR result of fat free mass related factors using random effect inverse-variance weighted method. IVW, inverse-variance weighted; OR, odds ratio; CI confidence interval; SNP, single nucleotide polymorphism.
To the best of our knowledge, hitherto no MR studies have embarked upon an exploration of the causal relationship between SO and BPH. Our study used the MR approach to identify the genetic causal association between BMR, ALM and BPH, indicating that BMR and ALM serves as a significant risk factor for the development of BPH. Each component of body fat-free mass may contribute to an increased susceptibility to BPH. However, no substantial evidence was observed in this study to suggest a causal relationship between fat mass and BPH. Most of the research observed BMR and ALM decreased in SO (40). Our MR results suggested the increase of BMR and ALM would rise the risk of occurring BPH. Our results indicated that the SO is a protective factor to BPH.
In an observational study, they found that an elevation in BMR significantly elevated the risk of developing BPH (41), which were consistent with our MR results. BMR is widely utilized as an index for measuring the basal metabolic rate in human bodies (42) and finds extensive application in studies related to obesity, aging, and other relevant fields.
BMR serves as a crucial indicator for predicting the progression of SO in individuals (20). The reported prevalence of SO among adults is 3.40% (21). A decrease in BMR heightens the risk of developing SO (21) and often indicates an increased proportion of visceral fat (21). In addition to being obese, patients with SO commonly exhibit sedentary behaviors, prolonged periods of sitting or bed rest, and an increase in waist circumference. Some individuals within this group may even present with Metabolic Syndrome (MetS) (11). All these factors collectively contribute to the risk factors associated with the onset of BPH. According to our research, it is evident that patients with SO are less likely to developing BPH. Normally, with age advancement, there is a tendency for BMR to decrease (20). Within the context of obesity-related disorders, divergent perspectives arise. A study indicates that as weight increases, BMR gradually rises (43). However, other studies suggested that obese individuals have a lower BMR compared to normal individuals (44, 45). It is important to note that these two observational outcomes may not contradict each other. As weight increases, BMR rises (46); however, in cases where weight is comparable, the BMR of obese patients is lower compared to the normal population (47). This can be attributed to the muscle-fat ratio in obese individuals and alterations in their muscle type (48).
BMR is regulated by a complex network of hormones and metabolic pathways. Both testosterone (49) and thyroid (50) hormones have the ability to increase BMR. In populations with obesity (51), aging, and MetS (52), there were a significant decrease in BMR. The value of BMR is determined by the intricate interplay of various factors. Bioavailable testosterone (6), thyroid hormones (4), obesity (7), aging, and MetS (52) all act as risk factors for the development of BPH. This highlights the complexity of BMR in the pathogenesis of BPH. These aforementioned factors serve as potential mediators through which BMR may influence the onset of BPH. Reduced bioavailable testosterone lowers BMR, increasing obesity risk. Conversely, elevated bioavailable testosterone is a key contributor to BPH onset. Low thyroid hormone levels decrease BMR, enhancing obesity risk (53), while high levels increase BPH risk (4). Those with obesity often show increased BMR (54), often mirroring their weight progression. Numerous studies identify obesity as a significant BPH risk factor. Elderly obesity rates are rising, largely due to chronic diseases and metabolic imbalances. In the general population, BMR decreases with age, but BPH incidence grows (17). The rise in metabolic disturbances in aging may explain increased older adult/adults obesity (53). Intriguingly, those diagnosed with metabolic syndrome consistently register a BMR inferior to their counterparts (55), with BMR exhibiting a profound association with metabolic age (52); an ascendant BMR frequently heralds a rejuvenated metabolic age.
Among various factors, only age concurrently elevates the risk for both obesity and BPH. This suggests that while both SO and BPH predominantly afflict older adult/adults males, there exists a dichotomous relationship between them. Clinically, SO patients without an increase in waist circumference and BMI present a diminished risk of BPH and are less likely to experience urinary obstruction.
In clinical diagnostics, uroflowmetry is a guideline-recommended pivotal tool for evaluating BPH obstructive symptoms, with the severity of these symptoms dictating the need for surgical intervention (56). With the advancement of portable home devices, the acquisition of UF data has become increasingly accessible and cost-effective (57). Comprehensive UF information aids in the precise assessment of LUTS symptoms. An enlarged WR poses a risk factor for SO (3, 58). An increase in WR is correlated with BPH obstructive symptoms, impacting the frequency score of the IPSS and Qmax in BPH patients (56).
BPH surgery techniques are tailored to prostate volume. Small prostates often utilize methods like HoLEP and TURP, while larger ones may opt for Simple Prostatectomy or ThuLEP (59). Though TURP is prevalent, HoLEP and ThuLEP are highly recommended. Metabolic Syndrome can affect TURP’s efficacy, and abdominal obesity correlates with better life quality (60). ThuLEP is preferable for obese individuals (61). For open surgeries, RASP provides benefits in safety and efficiency (62–64). Our studies show that while SO acts as a BPH deterrent, increased waist circumference, and rising older adult/adults obesity rates necessitate more vigilant BPH tracking and proactive interventions.
For patients undergoing prolonged bed rest, BMR constitutes the primary energy expenditure (65). Androgen replacement therapy is commonly employed to attenuate the progression of muscle atrophy (49). However, it should be noted that androgen replacement therapy may result in an elevation of BMR (49), thereby increasing the risk of BPH. Additionally, some scholars utilize thyroid hormone analogs to intervene in patients’ BMR (50). In clinical practice, regular monitoring of prostate volume and IPSS scores were advisable when utilizing androgen or thyroid hormone analogs for patient intervention. This facilitates timely adjustments in therapy strategies to prevent treatment induced BPH. For bedridden patients, the presence of BPH significantly increases the risk of urinary obstruction (66). Consequently, urinary catheterization is often necessary to facilitate urination in such cases. However, this introduces complexities in caregiving and elevates the risk of infections. Therefore, effective risk management for BPH among bedridden patients becomes imperative.
We have also identified a causal association between ALM and BPH. ALM serves as a direct indicator of muscle atrophy (22). In individuals with abdominal obesity, there is a positive correlation between ALM and waist circumference (67). Lower levels of ALM often indicate an increased risk of disability occurrence and poorer physical function (68). Physical activities unrelated to exercise intensity can also contribute to the enhancement of ALM (69). The relationship between ALM and fat remains uncertain, with conflicting reports on their association (69, 70). Current research suggests that ALM is closely linked to basal metabolic rate (71). Further investigation is required to elucidate the involvement of ALM in the pathogenesis of BPH.
Observational studies are susceptible to the influence of confounding factors, which may compromise their internal validity. To address this limitation, MR has emerged as a widely used alternative approach. MR utilizes GVs that are randomly allocated at conception, thereby minimizing the impact of confounding factors (72). Currently, there is a lack of MR studies specifically investigating the causal relationship between SO factors and BPH.
This study has several limitations. Firstly, a portion of the BPH cases in this study originated from self-reported patients in the UKB. Self-reported disease conditions might overlook some BPH cases and mistakenly include other lower urinary tract disorders. Secondly, our findings are only applicable to individuals of European lineage, and the impact of BPH in other lineages remains unexplored. Additionally, due to the lack of distinction between male and female cohorts in the UKB database of SO factors, this study encounters gender-related bias. If this missing data segment could be supplemented in future studies, it would enable more precise causal inferences and better control over potential confounding factors. Additionally, due to limitations in the database, we were unable to assess the health status of the sample population, potentially introducing latent confounding bias. Furthermore, this study employed SO factors-related genetic variants as instrumental variables to establish a causal relationship between SO factors and BPH. With limited number and strength of genetic instrument SNPs, some of the conclusions reached in this study should be cautiously interpreted. Currently, there is no existing research exploring the potential mechanisms underlying the association between SO and BPH. Evaluating the role of SO in BPH from a genetic perspective may only provide partial insights into its impact within this context.
In summary, our findings suggest a genetic causal association between BMR, ALM and BPH. However, no genetic causal relationship was observed between FFM distribution, MM distribution, and BPH. The decrease in BMR and ALM signifies the onset and progression of SO. Which means SO might be a protective factor for BPH.
The original contributions presented in the study are included in the article/Supplementary Material. Further inquiries can be directed to the corresponding authors.
XR: Conceptualization, Data curation, Formal Analysis, Funding acquisition, Investigation, Methodology, Visualization, Writing – original draft, Writing – review & editing. ZX: Conceptualization, Investigation, Methodology, Software, Visualization, Writing – original draft, Writing – review & editing. JCZ: Formal Analysis, Writing – review & editing. JXZ: Investigation, Methodology, Writing – review & editing. JH: Investigation, Writing – review & editing. ZT: Writing – review & editing. RZ: Conceptualization, Data curation, Investigation, Writing – review & editing. ZZ: Conceptualization, Investigation, Methodology, Supervision, Writing – review & editing.
The author(s) declare financial support was received for the research, authorship, and/or publication of this article. This work was financially supported by the National Natural Science Foundation of China (U22A20162, 31900583, 32071351, 81772400, 82102604, 81960395, 81904287); foundation of Shenzhen Committee for Science and Technology Innovation (JCYJ20190809142211354), Sanming Project of Medicine in Shenzhen (SZSM201911002).
We are grateful to the participants of the UKBB and FinnGen. During the preparation of this work the authors didn’t use any service or tools. The authors reviewed and edited the content as needed and take full responsibility for the content of the publication.
The authors declare that the research was conducted in the absence of any commercial or financial relationships that could be construed as a potential conflict of interest.
All claims expressed in this article are solely those of the authors and do not necessarily represent those of their affiliated organizations, or those of the publisher, the editors and the reviewers. Any product that may be evaluated in this article, or claim that may be made by its manufacturer, is not guaranteed or endorsed by the publisher.
The Supplementary Material for this article can be found online at: https://www.frontiersin.org/articles/10.3389/fendo.2023.1290639/full#supplementary-material
Supplementary Figure 1 | BMR related diagrams.
Supplementary Figure 2 | ALM related diagrams.
Supplementary Figure 3 | 1 MR leave-one-out sensitivity analysis for other factors. 2 Funnel plots for other factors. 3 Scatter diagram for other factors. 4 Forest map for other factors.
Supplementary Table 1 | SNPs of BMR for BPH in TSMR.
Supplementary Table 2 | SNPs of ALM for BPH in TSMR.
Supplementary Table 3 | SNPs of other related factors for BPH in TSMR.
Supplementary Table 4 | The SNPs selected for other obesity factors to perform Multivariable MR analysis.
Supplementary Table 5 | The SNPs selected for predicted mass related factors to perform Multivariable MR analysis.
Supplementary Table 6 | The SNPs selected for fat free mass related factors to perform Multivariable MR analysis.
1. Beard JR, Officer A, de Carvalho IA, Sadana R, Pot AM, Michel JP, et al. The World report on ageing and health: a policy framework for healthy ageing. Lancet Lond Engl (2016) 387(10033):2145–54. doi: 10.1016/S0140-6736(15)00516-4
2. Launer BM, McVary KT, Ricke WA, Lloyd GL. The rising worldwide impact of benign prostatic hyperplasia. BJU Int (2021) 127(6):722–8. doi: 10.1111/bju.15286
3. Wang YB, Yang L, Deng YQ, Yan SY, Luo LS, Chen P, et al. Causal relationship between obesity, lifestyle factors and risk of benign prostatic hyperplasia: a univariable and multivariable Mendelian randomization study. J Transl Med (2022) 20(1):495. doi: 10.1186/s12967-022-03722-y
4. Huang Y, Chen C, Zhou W, Zhang Q, Zhao Y, He D, et al. Genetically predicted alterations in thyroid function are associated with the risk of benign prostatic disease. Front Endocrinol (2023) 14:1163586. doi: 10.3389/fendo.2023.1163586
5. Wang M, Jian Z, Gao X, Yuan C, Jin X, Li H, et al. Causal associations between educational attainment and 14 urological and reproductive health outcomes: A Mendelian randomization study. Front Public Health (2021) 9:742952. doi: 10.3389/fpubh.2021.742952
6. Lin L, Wang W, Xiao K, Guo X, Zhou L. Genetically elevated bioavailable testosterone level was associated with the occurrence of benign prostatic hyperplasia. J Endocrinol Invest (2023) 46(10):2095–102. doi: 10.1007/s40618-023-02060-0
7. Ng M, Baradhi KM. Benign prostatic hyperplasia, in: StatPearls (2023). StatPearls Publishing. Available at: http://www.ncbi.nlm.nih.gov/books/NBK558920/ (Accessed August 7, 2023).
8. Lopez DS, Peskoe SB, Tsilidis KK, Hoffman-Bolton J, Helzlsouer KJ, Isaacs WB, et al. Association of variants in genes related to the immune response and obesity with BPH in CLUE II. Prostate Cancer Prostatic Dis (2014) 17(4):353–8. doi: 10.1038/pcan.2014.36
9. Wang S, Mao Q, Lin Y, Wu J, Wang X, Zheng X, et al. Body mass index and risk of BPH: a meta-analysis. Prostate Cancer Prostatic Dis (2012) 15(3):265–72. doi: 10.1038/pcan.2011.65
10. Fowke JH, Koyama T, Fadare O, Clark PE. Does inflammation mediate the obesity and BPH relationship? An epidemiologic analysis of body composition and inflammatory markers in blood, urine, and prostate tissue, and the relationship with prostate enlargement and lower urinary tract symptoms. PloS One (2016) 11(6):e0156918. doi: 10.1371/journal.pone.0156918
11. Lee SH, Kim JC, Lee JY, Kim JH, Oh CY, Lee SW, et al. Effects of obesity on lower urinary tract symptoms in Korean BPH patients. Asian J Androl (2009) 11(6):663–8. doi: 10.1038/aja.2009.62
12. Tyagi P, Motley SS, Koyama T, Kashyap M, Gingrich J, Yoshimura N, et al. Molecular correlates in urine for the obesity and prostatic inflammation of BPH/LUTS patients. Prostate (2018) 78(1):17–24. doi: 10.1002/pros.23439
13. Lee SU, Lee SH, So AH, Park JI, Lee S, Oh IH, et al. Association between benign prostatic hyperplasia and suicide in South Korea: A nationwide retrospective cohort study. PloS One (2022) 17(3):e0265060. doi: 10.1371/journal.pone.0265060
14. Obesity: identification, assessment and management. London: National Institute for Health and Care Excellence (NICE); (2023).
15. Parsons JK, Carter HB, Partin AW, Windham BG, Metter EJ, Ferrucci L, et al. Metabolic factors associated with benign prostatic hyperplasia. J Clin Endocrinol Metab (2006) 91(7):2562–8. doi: 10.1210/jc.2005-2799
16. Kristal AR, Arnold KB, Schenk JM, Neuhouser ML, Weiss N, Goodman P, et al. Race/ethnicity, obesity, health related behaviors and the risk of symptomatic benign prostatic hyperplasia: results from the prostate cancer prevention trial. J Urol (2007) 177(4):1395–1400; quiz 1591. doi: 10.1016/j.juro.2006.11.065
17. Colleluori G, Villareal DT. Aging, obesity, sarcopenia and the effect of diet and exercise intervention. Exp Gerontol (2021) 155:111561. doi: 10.1016/j.exger.2021.111561
18. Malandrino N, Bhat SZ, Alfaraidhy M, Grewal RS, Kalyani RR. Obesity and aging. Endocrinol Metab Clin North Am (2023) 52(2):317–39. doi: 10.1016/j.ecl.2022.10.001
19. Patterson RE, Frank LL, Kristal AR, White E. A comprehensive examination of health conditions associated with obesity in older adults. Am J Prev Med (2004) 27(5):385–90. doi: 10.1016/j.amepre.2004.08.001
20. Guan L, Li T, Wang X, Yu K, Xiao R, Xi Y. Predictive roles of basal metabolic rate and body water distribution in sarcopenia and sarcopenic obesity: the link to carbohydrates. Nutrients (2022) 14(19):3911. doi: 10.3390/nu14193911
21. Luo X, Cai B, Jin W. The prevalence rate of adult sarcopenic obesity and correlation of appendicular skeletal muscle mass index with body mass index, percent body fat, waist-hip ratio, basal metabolic rate, and visceral fat area. Metab Syndr Relat Disord (2023) 21(1):48–56. doi: 10.1089/met.2022.0035
22. Sarcopenia: characteristics, mechanisms and functional significance. PubMed. Available at: https://pubmed.ncbi.nlm.nih.gov/20200012/ (Accessed July 11, 2023).
23. Elsworth B, Lyon M, Alexander T, Liu Y, Matthews P, Hallett J, et al. The MRC IEU OpenGWAS data infrastructure. Genome Research Center, Sunnyside Boulevard Woodbury, NY: Cold Spring Harbor Laboratory (2020). p. 2020.08.10.244293. doi: 10.1101/2020.08.10.244293.
24. The MR-Base platform supports systematic causal inference across the human phenome. PubMed. Available at: https://pubmed.ncbi.nlm.nih.gov/29846171/ (Accessed August 14, 2023).
25. Anderson CA, Pettersson FH, Clarke GM, Cardon LR, Morris AP, Zondervan KT. Data quality control in genetic case-control association studies. Nat Protoc (2010) 5(9):1564–73. doi: 10.1038/nprot.2010.116
26. 1000 Genomes Project Consortium, Abecasis GR, Auton A, Brooks LD, DePristo MA, Durbin RM, et al. An integrated map of genetic variation from 1,092 human genomes. Nature (2012) 491(7422):56–65. doi: 10.1038/nature11632
27. Smith GD, Ebrahim S. “Mendelian randomization”: can genetic epidemiology contribute to understanding environmental determinants of disease? Int J Epidemiol (2003) 32(1):1–22. doi: 10.1093/ije/dyg070
28. Burgess S, Thompson SG. Bias in causal estimates from Mendelian randomization studies with weak instruments. Stat Med (2011) 30(11):1312–23. doi: 10.1002/sim.4197
29. Burgess S, Thompson SG CRP, CHD Genetics Collaboration. Avoiding bias from weak instruments in Mendelian randomization studies. Int J Epidemiol (2011) 40(3):755–64. doi: 10.1093/ije/dyr036
30. Davies NM, Holmes MV, Davey Smith G. Reading Mendelian randomisation studies: a guide, glossary, and checklist for clinicians. BMJ (2018) 362:k601. doi: 10.1136/bmj.k601
31. Bowden J, Davey Smith G, Haycock PC, Burgess S. Consistent estimation in Mendelian randomization with some invalid instruments using a weighted median estimator. Genet Epidemiol (2016) 40(4):304–14. doi: 10.1002/gepi.21965
32. Wang R. Mendelian randomization study updates the effect of 25-hydroxyvitamin D levels on the risk of multiple sclerosis. J Transl Med (2022) 20(1):3. doi: 10.1186/s12967-021-03205-6
33. Associations between plasma fatty acid concentrations and schizophrenia: a two-sample Mendelian randomisation study. PubMed. Available at: https://pubmed.ncbi.nlm.nih.gov/34735824/ (Accessed August 14, 2023).
34. Verbanck M, Chen CY, Neale B, Do R. Detection of widespread horizontal pleiotropy in causal relationships inferred from Mendelian randomization between complex traits and diseases. Nat Genet (2018) 50(5):693–8. doi: 10.1038/s41588-018-0099-7
35. Mendelian randomization study of inflammatory bowel disease and bone mineral density. PubMed. Available at: https://pubmed.ncbi.nlm.nih.gov/33167994/ (Accessed August 14, 2023).
36. Burgess S, Thompson SG. Interpreting findings from Mendelian randomization using the MR-Egger method. Eur J Epidemiol (2017) 32(5):377–89. doi: 10.1007/s10654-017-0255-x
37. Diabetes Mellitus, Glycemic Traits, and Cerebrovascular Disease: A Mendelian Randomization Study. PubMed. Available at: https://pubmed.ncbi.nlm.nih.gov/33495378/ (Accessed August 14, 2023).
38. Sanderson E, Davey Smith G, Windmeijer F, Bowden J. An examination of multivariable Mendelian randomization in the single-sample and two-sample summary data settings. Int J Epidemiol (2019) 48(3):713–27. doi: 10.1093/ije/dyy262
39. Hemani G, Bowden J, Davey Smith G. Evaluating the potential role of pleiotropy in Mendelian randomization studies. Hum Mol Genet (2018) 27(R2):R195–208. doi: 10.1093/hmg/ddy163
40. Donini LM, Busetto L, Bischoff SC, Cederholm T, Ballesteros-Pomar MD, Batsis JA, et al. Definition and diagnostic criteria for sarcopenic obesity: ESPEN and EASO consensus statement. Obes Facts (2022) 15(3):321–35. doi: 10.1159/000521241
41. Park JS, Koo KC, Kim HK, Chung BH, Lee KS. Impact of metabolic syndrome-related factors on the development of benign prostatic hyperplasia and lower urinary tract symptoms in Asian population. Med (Baltimore) (2019) 98(42):e17635. doi: 10.1097/MD.0000000000017635
42. Hulbert AJ, Else PL. Basal metabolic rate: history, composition, regulation, and usefulness. Physiol Biochem Zool PBZ (2004) 77(6):869–76. doi: 10.1086/422768
43. Burlyaeva EA, Prunceva TA, Semenov MM, Stakhanova AA, Korotkova TN, Elizarova EV. [Body composition and basal metabolic rate in overweight and obese patients]. Vopr Pitan (2022) 91(5):78–86. doi: 10.33029/0042-8833-2022-91-5-78-86
44. Faria SL, Faria OP, Menezes CS, de Gouvêa HR, de Almeida Cardeal M. Metabolic profile of clinically severe obese patients. Obes Surg (2012) 22(8):1257–62. doi: 10.1007/s11695-012-0651-y
45. Holmer H, Pozarek G, Wirfält E, Popovic V, Ekman B, Björk J, et al. Reduced energy expenditure and impaired feeding-related signals but not high energy intake reinforces hypothalamic obesity in adults with childhood onset craniopharyngioma. J Clin Endocrinol Metab (2010) 95(12):5395–402. doi: 10.1210/jc.2010-0993
46. Li H, Li D, Wang X, Ding H, Wu Q, Li H, et al. The role of dietary patterns and dietary quality on body composition of adolescents in Chinese college. Nutrients (2022) 14(21):4544. doi: 10.3390/nu14214544
47. Shah M, Geissler CA, Miller DS. Metabolic rate during and after aerobic exercise in post-obese and lean women. Eur J Clin Nutr (1988) 42(6):455–64.
48. Miller IM, Rytgaard H, Mogensen UB, Miller E, Ring HC, Ellervik C, et al. Body composition and basal metabolic rate in Hidradenitis Suppurativa: a Danish population-based and hospital-based cross-sectional study. J Eur Acad Dermatol Venereol JEADV (2016) 30(6):980–8. doi: 10.1111/jdv.13522
49. Welle S, Jozefowicz R, Forbes G, Griggs RC. Effect of testosterone on metabolic rate and body composition in normal men and men with muscular dystrophy. J Clin Endocrinol Metab (1992) 74(2):332–5. doi: 10.1210/jcem.74.2.1730811
50. De Geronimo V, Cannarella R, La Vignera S. Thyroid function and obesity: from mechanisms to the benefits of levothyroxine in obese patients. Endocr Metab Immune Disord Drug Targets (2021) 21(11):1954–60. doi: 10.2174/1871530321666210118162625
51. Adamczyk P, Siwacki S, Ponikowska I, Juszczak K. Calculation of basal metabolic rate in patients with morbid obesity treated in spa conditions. J Hum Nutr Diet Off J Br Diet Assoc (2022) 35(5):919–23. doi: 10.1111/jhn.12996
52. Vásquez-Alvarez S, Bustamante-Villagomez SK, Vazquez-Marroquin G, Porchia LM, Pérez-Fuentes R, Torres-Rasgado E, et al. Metabolic age, an index based on basal metabolic rate, can predict individuals that are high risk of developing metabolic syndrome. High Blood Press Cardiovasc Prev Off J Ital Soc Hypertens (2021) 28(3):263–70. doi: 10.1007/s40292-021-00441-1
53. Michalakis K, Goulis DG, Vazaiou A, Mintziori G, Polymeris A, Abrahamian-Michalakis A. Obesity in the ageing man. Metabolism (2013) 62(10):1341–9. doi: 10.1016/j.metabol.2013.05.019
54. Ravussin E, Burnand B, Schutz Y, Jéquier E. Twenty-four-hour energy expenditure and resting metabolic rate in obese, moderately obese, and control subjects. Am J Clin Nutr (1982) 35(3):566–73. doi: 10.1093/ajcn/35.3.566
55. Xu H, Choi SE, Kang JK, Park DJ, Lee JK, Lee SS. Basal metabolic rate and Charlson Comorbidity Index are independent predictors of metabolic syndrome in patients with rheumatoid arthritis. Joint Bone Spine (2020) 87(5):455–60. doi: 10.1016/j.jbspin.2020.03.015
56. Lerner LB, McVary KT, Barry MJ, Bixler BR, Dahm P, Das AK, et al. Management of lower urinary tract symptoms attributed to benign prostatic hyperplasia: AUA GUIDELINE PART I—Initial work-up and medical management. J Urol (2021) 206(4):806–17. doi: 10.1097/JU.0000000000002183
57. Pandolfo SD, Crauso F, Aveta A, Cilio S, Barone B, Napolitano L, et al. A novel low-cost uroflowmetry for patient telemonitoring. Int J Environ Res Public Health (2023) 20(4):3287. doi: 10.3390/ijerph20043287
58. Wang HH, Hsieh CJ, Lin KJ, Chu SH, Chuang CK, Chen HW, et al. Waist circumference is an independent risk factor for prostatic hyperplasia in Taiwanese males. Asian J Surg (2011) 34(4):163–7. doi: 10.1016/j.asjsur.2012.02.001
59. Lerner LB, McVary KT, Barry MJ, Bixler BR, Dahm P, Das AK, et al. Management of lower urinary tract symptoms attributed to benign prostatic hyperplasia: AUA GUIDELINE PART II—Surgical evaluation and treatment. J Urol (2021) 206(4):818–26. doi: 10.1097/JU.0000000000002184
60. Sener NC, Zengin K, Ozturk U, Bas O, Ercil H, Ekici M, et al. The impact of metabolic syndrome on the outcomes of transurethral resection of the prostate. J Endourol (2015) 29(3):340–3. doi: 10.1089/end.2014.0562
61. Trama F, Lauro GD, Illiano E, Iacono F, Romis L, Mordente S, et al. Ejaculation sparing thulium laser enucleation of the prostate: an observational prospective study. J Clin Med (2022) 11(21):6365. doi: 10.3390/jcm11216365
62. Amenta M, Oliva F, Barone B, Corsaro A, Arcaniolo D, Scarpato A, et al. Minimally invasive simple prostatectomy: Robotic-assisted versus laparoscopy. A comparative study. Arch Ital Urol Androl Organo Uff Soc Ital Ecogr Urol E Nefrol (2022) 94(1):37–40. doi: 10.4081/aiua.2022.1.37
63. Pandolfo SD, Del Giudice F, Chung BI, Manfredi C, De Sio M, Damiano R, et al. Robotic assisted simple prostatectomy versus other treatment modalities for large benign prostatic hyperplasia: a systematic review and meta-analysis of over 6500 cases. Prostate Cancer Prostatic Dis (2023) 26(3):495–510. doi: 10.1038/s41391-022-00616-4
64. Carmignani L, Clementi MC, Signorini C, Motta G, Nazzani S, Palmisano F, et al. Safety and feasibility of thullium laser transurethral resection of prostate for the treatment of benign prostatic enlargement in overweight patients. Asian J Urol (2019) 6(3):270–4. doi: 10.1016/j.ajur.2018.05.004
65. Alazzam AM, Alrubaye MW, Goldsmith JA, Gorgey AS. Trends in measuring BMR and RMR after spinal cord injury: a comprehensive review. Br J Nutr (2023) 130(10):1720–31. doi: 10.1017/S0007114523000831
66. Arnold MJ, Gaillardetz A, Ohiokpehai J. Benign prostatic hyperplasia: rapid evidence review. Am Fam Physician (2023) 107(6):613–22.
67. Raghupathy R, McLean RR, Kiel DP, Hannan MT, Sahni S. Higher abdominal adiposity is associated with higher lean muscle mass but lower muscle quality in middle-aged and older men and women: the Framingham Heart Study. Aging Clin Exp Res (2023) 35(7):1477–85. doi: 10.1007/s40520-023-02427-6
68. Baker JF, Harris T, Rapoport A, Ziolkowski SL, Leonard MB, Long J, et al. Validation of a description of sarcopenic obesity defined as excess adiposity and low lean mass relative to adiposity. J Cachexia Sarcopenia Muscle (2020) 11(6):1580–9. doi: 10.1002/jcsm.12613
69. Alkahtani S, Aljaloud K, Yakout S, Al-Daghri NM. Interactions between sedentary and physical activity patterns, lean mass, and bone density in Arab men. Dis Markers (2019) 2019:5917573. doi: 10.1155/2019/5917573
70. Orwoll ES, Peters KE, Hellerstein M, Cummings SR, Evans WJ, Cawthon PM. The importance of muscle versus fat mass in sarcopenic obesity: A re-evaluation using D3-creatine muscle mass versus DXA lean mass measurements. J Gerontol A Biol Sci Med Sci (2020) 75(7):1362–8. doi: 10.1093/gerona/glaa064
71. Tzankoff SP, Norris AH. Longitudinal changes in basal metabolism in man. J Appl Physiol (1978) 45(4):536–9. doi: 10.1152/jappl.1978.45.4.536
Keywords: sarcopenic obesity, basal metabolic rate, appendicular lean mass, benign prostatic hyperplasia, genome-wide association study, mendelian randomization
Citation: Rao X, Xu Z, Zhang J, Zhou J, Huang J, Toh Z, Zheng R and Zhou Z (2023) The causal relationship between sarcopenic obesity factors and benign prostate hyperplasia. Front. Endocrinol. 14:1290639. doi: 10.3389/fendo.2023.1290639
Received: 08 September 2023; Accepted: 20 October 2023;
Published: 08 November 2023.
Edited by:
Xiaolong Wang, Temple University, United StatesReviewed by:
Savio Domenico Pandolfo, Federico II University Hospital, ItalyCopyright © 2023 Rao, Xu, Zhang, Zhou, Huang, Toh, Zheng and Zhou. This is an open-access article distributed under the terms of the Creative Commons Attribution License (CC BY). The use, distribution or reproduction in other forums is permitted, provided the original author(s) and the copyright owner(s) are credited and that the original publication in this journal is cited, in accordance with accepted academic practice. No use, distribution or reproduction is permitted which does not comply with these terms.
*Correspondence: Ruwen Zheng, Zrw123@sina.com; Zhiyu Zhou, zhouzhy23@mail.sysu.edu.cn; Jiaxiang Zhou, qyfyzjx@126.com
†These authors have contributed equally to this work
Disclaimer: All claims expressed in this article are solely those of the authors and do not necessarily represent those of their affiliated organizations, or those of the publisher, the editors and the reviewers. Any product that may be evaluated in this article or claim that may be made by its manufacturer is not guaranteed or endorsed by the publisher.
Research integrity at Frontiers
Learn more about the work of our research integrity team to safeguard the quality of each article we publish.