
94% of researchers rate our articles as excellent or good
Learn more about the work of our research integrity team to safeguard the quality of each article we publish.
Find out more
ORIGINAL RESEARCH article
Front. Electron., 21 September 2021
Sec. Flexible Electronics
Volume 2 - 2021 | https://doi.org/10.3389/felec.2021.753145
 Lee Bar-On1*Umberto Garlando2Marios Sophocleous1Aakash Jog1Paolo Motto Ros2Nir Sade3Adi Avni3Yosi Shacham-Diamand1Danilo Demarchi1,2
Electrical impedance spectroscopy has been suggested as a sensing method for plants. Here, a theoretical approach for electrical conduction via the plant stem is presented and validated, linking its living electrical characteristics to its internal structure. An electrical model for the alternating current conduction and the associated impedance in a live plant stem is presented. The model accounts for biological and geometrical attributes. It uses the electrically prevalent coupled transmission line model approach for a simplified description of the complicated vessel structure. It considers the electrode coupling to the plant stem (either Galvanic or Faradic), and accounts for the different interactions of the setup. Then the model is simplified using the lumped element approach. The model is then validated using a four-point probe impedance spectroscopy method, where the probes are galvanically coupled to the stem of Nicotiana tabacum plants. The electrical impedance data was collected continuously and the results exhibit an excellent fitting to the theoretical model, with a fitting error of less than 1.5% for data collected on various days and plants. A parametric evaluation of the fitting corresponds to the proposed physically based model, therefore providing a baseline for future plant sensor design.
Food security for the increasing global population depends on advances in precision agriculture (FAO, 2017). Among the strategies to improve crop yield, direct plant monitoring has been suggested. Such monitoring suggests incorporating new technologies, devices and data collection into common and prevalent agriculture practices (Luvisi, 2016; Walter et al., 2017; Fritz et al., 2018). This is an important factor in what is titled as “precision agriculture”. Many reports on new emerging data acquisition and analysis methods are currently being researched, including both direct plant measurements, as well as methods for monitoring plant environmental parameters on the ground (Fritz et al., 2017), or from the air (Sophocleous, 2021) with some studies going even further by using the plant itself as an electrical communication channel (Ros et al., 2019; Jog et al., 2020). Here we focus on the approach to sense changes within the plant in a direct manner, as a measure of plant status and well-being.
In order to achieve combination of new direct monitoring technologies in agriculture, there is a need to define the different terms and plant behaviors in electronics “terminology”. We need to test electronic behavior in the plant, by applying well known electronic methods, characterize plants and change in plants, and build a system approach to monitoring, according to changes in electronic signals.
Usually an electronics monitoring system or sensor require a supporting electronic circuit, which relies on the known behaviors and systematic responses of the specimen or device tested. Such a system or characterizations are usually defined using a system model composed of different established electric elements (such as resistors, capacitors, etc.). These parameters of a model are based on basic research completed across different specimen, that allow to define parameters such as working ranges, frequency dependencies, sampling rates and so on.
In this paper we present a model of a plant stem for electrical signal conduction, which can later be applied for a sensor system design and application. This approach may allow expansion of the use of electronic monitoring devices in the field of agriculture for both research and system applications in the future, providing another step towards the incorporation of electronics into precision agriculture.
This is a novel approach, in the sense that it relies on the basic anatomical structure of the plant (which is relevant across all plant species), and the internal physiological changes, of a living plant, while simultaneously accounting for the electronic system devised to acquire data. We expect it to be a useful tool for future monitoring devices applied to plants.
Different direct monitoring methods have been reported. Amongst these are sophisticated imaging and radar technologies used to monitor visual change in crop status (Benedetti and Rossini, 1993; Bellón et al., 2017). Others focus on root behavior, soil quality and trunk health, for tree stability assessments, using rather costly and non-field-deployable tools (Sambuelli et al., 2003; Attia al Hagrey, 2007). Plant leaf changes are another monitored area. Here temperature detection using thermocouples or capacitance measurements, imaging technology and a variety of electrical measurements are translated for plant treatment adaption (Sakamoto and Kimura, 2018; Pandey et al., 2018). Sap flow monitoring has also been reported. It is considered as it represents the flow of nutrients towards the plant roots. However, it is plant-type specific and seasonal (Steppe et al., 2015). In plant research, several electrical evaluations have been undertaken. The assessment of internal plant signaling amongst cells has been studied, showing action potentials and longer travelling signals called variation potentials (Yan et al., 2009). These signals, however, indicate chemically induced changes or a response to local physical changes. Information on the overall plant status has not been reported. Attempts to electrically evaluate the response to plant trauma have been suggested, and it was concluded that local damage induces generation and propagation of variation potentials. These potentials affect the physiological processes in the plants (Vodeneev et al., 2018). Electrochemical and bio-electrochemical measurements of plants have also been carried out, showing that long-distance communication between plant tissue and cells can propagate rapidly with bio-electrochemical signals (Zimmermann et al., 2016). It has been suggested that the phloem is the carrier for these signals (Volkov, 2000; Volkov et al., 2016).
Sensors based on impedance measurements are commonly used for biological specimens, as impedance spectroscopy is a well-established method for material characterization. It is often used to evaluate change in biological materials and structures. In plant research, it has been used to evaluate response at cell level, differentiating between the response of the cell membrane, or the vacuole in the cytoplasm, etc. (Zhang and Willison, 1991; Zhao et al., 2013). Plant tissue, from different sections of the plant, has also been evaluated for several phenomena such as, disease detection, fruit ripening and the evaluation of frost response (Zheng et al., 2015; Jócsák et al., 2019; Bertemes-Filho et al., 2020). Models used to interpret the spectrum data have generally been based on available models, with adaptations to the specific specimen studied (Muñoz-Huerta et al., 2014; Repo et al., 2000). Jócsák et al. include many of these reports in their comprehensive review (Jócsák et al., 2019). For example, Zhang and Willison (1991) suggested a double shell model used with complex nonlinear least square fitting. This model was fitted to the experimental spectra of potato pieces and carrot roots. The best fit yielded good accuracy and the model components were used to find attributes the plant internal morphology. Although the work presented by Zhang and Willison (1991) yielded good fitting, it was destructive to the specimen. In our paper we bring an improved model using an in situ non-destructive setup. Our proposed model is based on a holistic approach, where the plant behavior is monitored, and the experiment setup is accounted for. In earlier years (1920s), the electrical impedance of wood was studied, although not in a living plant. Measurements were carried out on bulk wood. Initially resistivity was evaluated in DC (Direct Current). It was shown to be correlated to the wood moisture content (Stamm, 1927). Later, an attempt was made to measure the AC (Alternate Current) response of wood across a range of frequencies. The frequency range was limited, as these experiments were undertaken for the first time almost a century ago (Luyet, 1932). Following these findings, there has been limited literature published on electrical impedance spectroscopy measurements to characterize the live plant stems. Furthermore, a model based on the basic plant stem structure, for the monitoring of living plants in a non-destructive manner, has not been reported.
We address the electrical modeling aspect of the stem for overall plant status monitoring for practical sensing applications. This offers an electronic interpretation of the mechanisms involved in electrical signal change measured using impedance spectroscopy. An innovative approach is presented, examining the basic plant anatomical structure and relating it to the experimental in-vivo plant impedance setup. A hypothesis and a first-order model for electrical conduction via the plant stem are presented, suggesting an equivalent circuit model for the plant stem. The measurement method is implemented using a four-point-probe configuration, providing in-vivo readings from the plant stem (Bar-on et al., 2019; Garlando, 2020; Garlando et al., 2020; Garlando et al., 2021). These are later linked to the suggested model of the plant and experimentally validated.
In this paper, we examine the plant stem and its vascular system anatomical structure, as it is believed to be the main system influencing electrical conduction and impedance changes. This study focuses on dicot plant structure and is demonstrated using Nicotiana tabacum plants. However, due to our quasi-one-dimensional modeling approach and the model assumption, it is not limited to a specific plant type.
Investigation of the plant stem structure as a medium for electrical signal propagation requires an estimation of the dielectric and conductive paths available within the tissue structure, including both material characteristics and geometrical factors. Examining the plant stem anatomy, a rough characterization with three main areas, can be assumed. These are 1) ground tissue in both the pith area and the cortex, 2) the vascular tissue composed of both xylem and phloem canals, and 3) the epidermis dermal tissue. As the plant grows, it produces additional xylem inwards towards the pith and phloem outwards towards the epidermis, so the actual 3D structure of the vascular system in a plant is not fixed along the stem and changes during growth (Aloni, 2021).
A study of each of the different tissues of the plant stem for electrical signal conduction, requires an estimation of the higher and the lower resistive paths within the structure. Some studies suggest that for ground tissue areas (i.e. pith and cortex) the conduction of electrical signals will be across cell membranes. This is expected to yield higher resistive behavior (Volkov, 2000; Volkov, 2006). Under these assumptions, a lower resistance conduction path may exist through the transporting vascular tissues. The vascular tissues include the above-mentioned vessels and as they develop, supporting plant fiber tissue increases as well (Sorieul et al., 2016). These are made of cell walls and can be categorized as a type of cellulose known to be a poor electrical conductor (Volkov, 2006; Taiz and Zeiger, 2010). Consequently, it can be expected that the electrical signal will be confined to flow mainly via the xylem vessels and phloem sieve tubes. The xylem and phloem conduits differ in both function and geometry. The xylem tissue consists of vessels of variable lengths and diameters, while the phloem includes comparable long sieve tubes. Between the xylem and phloem there are diffusion channels like the cambium and vascular rays (Taiz and Zeiger, 2010; Aloni, 2021). Since the xylem and phloem are responsible for the water and nutrient distribution in the plant, it is assumed that electrical signal conduction will also depend on changes in water flux and osmotic potential within the vessels and sieve tubes. These monitored changes may serve as an indication to overall plant physiological status or change.
Here, we present a theoretical approach with the given experimental setup, to describe an electrical equivalent circuit model of the plant stem. As described earlier, the electrical conduction is assumed to be via the vascular cambium. Therefore, the electrode coupling, and connectivity to the plant stem are examined. A direct Galvanic coupling between the plant and the signal and sensing electrodes is first assumed. However, since the electrodes’ penetration is to a limited depth and their size is finite, not all the conducting channels are in direct contact with the electrodes. Hence, we then assume they are capacitively coupled as well.
The model emerges from basic assumptions regarding the plant stem microstructure, and is developed using well known electronic circuit modeling approaches. The model results are later validated using electrical impedance measurements carried out using a four-point probe connection.
The model is derived in the following manner:
• The initial plant setup and connectivity are defined in terms of the conduction pathways;
• A general coupled transmission line approach is suggested, linked to the overall plant structure;
• An approximation using an equivalent lumped element model derived from the above is presented.
Finally, the theoretical derivation suggests a representation consisting of resistors, capacitors and constant phase elements (CPE). This approximation is less accurate especially at high frequencies. Yet, it is often applied for complex structures that include both geometrical distributions and dependence on kinetic and biological processes (Lasia, 1995; Lasia, 2014; Barbero and Lelidis, 2017), such as in the plant stem. In addition, for practical application, as data is often obtained at the lower part of the spectrum (up to few 100 kHz), this model is very useful for sensing applications.
Galvanic coupling is applied to connect to the plant stem. In this manner, direct contact to the vascular cambium areas is achieved. Au electrodes are used for the contact, while the effect of the contact/plant interface is eliminated since in the four-point measurement configuration, the voltage sensing electrodes are decoupled form the current enforcing electrodes. The voltage is measured in the internal sensing electrodes where there is no current flow, i.e. they are at the point-of-zero-current which is assumed to be identical for both sensing electrodes (or with a fixed bias due to some chemo-physical variations). Therefore, galvanic in-vivo coupling to the plant stem, is made by direct contact with the vascular cambium, thus with the water and nutrient conduction channels. Four electrodes are inserted along the stem length, creating optimal contact for each electrode. A schematic description can be seen in Figure 1. Due to the randomly ordered bundles of xylem and phloem vessels within the vascular cambium, the exact contact area varies between the inserted electrodes and the conducting vessels. However, assuming similar electrode placement across the stem, the variations across experiments and specimens are expected to be rather low due to the use of the four-point probe configuration. Moreover, while the electrical current flows via the vessels that are in direct contact with the inserted electrode, it can be assumed that additional conduction paths, not in contact with the electrodes, contribute to the current flow via capacitive coupling. Under these electrode contact assumptions, considering the different options for direct contact to conducting vessels, four possibilities exist. For a set of two pairs of electrodes, the four options are: direct contact to the vessel on both ends, single contact with the vessel, either at the top or bottom, and no direct contact with the vessel (Figure 2). These four connection possibilities represent the different conduction paths within the actual vascular cambium. The proposed model accounts for these four different interactions. The direct contact formation and its behavior are considered, as well as the differently coupled pathways i.e. no contact or partial contact to the electrodes. Among the different connection possibilities, capacitive coupling is assumed to account for the interface between the channels.
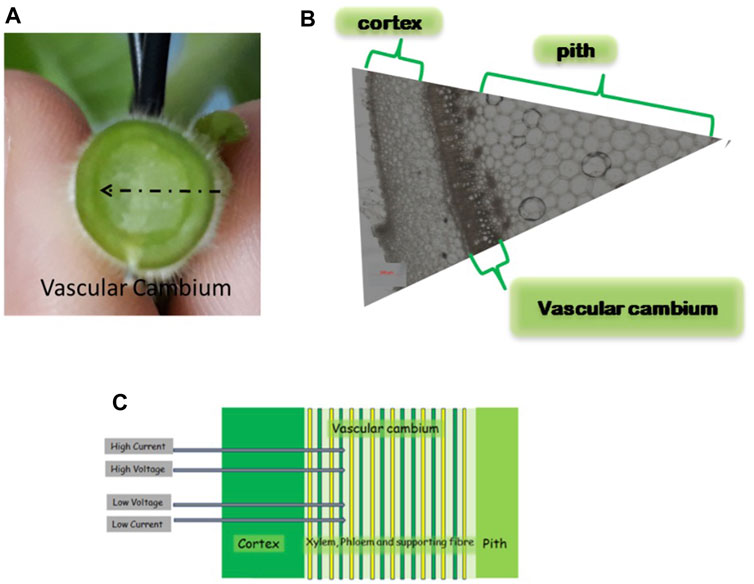
FIGURE 1. Nicotiana tabacum stem cross section image. (A) Horizontal stem cross-section. (B) Horizontal cross-section showing locations of the different tissue areas mentioned. (C) Schematic four probe electrode configuration and the cross-section of the inserted electrodes in the stem. The primary vascular system is drawn schematically neglecting branching and other 3D structures, as is later assumed in the suggested model. The image was taken at a mid-stem internode. The sample was immersed in 70% ethanol for 72 h and images were acquired using a ZEISS Axio Zoom.V16 microscope with bright-field illumination and ×8 magnification.
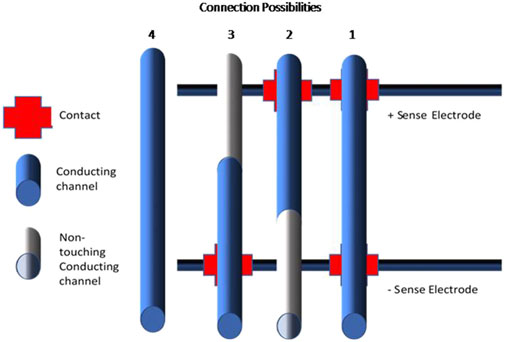
FIGURE 2. Schematic drawing of the four options relating the connection options of the conducting channels. Each of the channels 1–4 symbolizes an optional conduction path: 1 conducting path with two contacts, 2 and 3 a conducting path with a single contact, 4 a conducting path with no contacts. The type of connection: contact, no contact and conducting provides information regarding the coupling of the channel within the measurement setup, e.g. the conducting channels are coupled by an impedance, Zp,1–2, is expected to be capacitive. The sense electrodes specified indicate where the voltage measurement electrodes are connected.
The initial study investigates the behavior of a single conduction vessel as a transmission line and continues to the solution of two coupled transmission lines. The hypothesis presents a lumped element model, suggesting a description of the plant stem as a collection of electrical elements contributing to the overall electrical conduction.
Based on the plant stem physiological structure and the presented electrode coupling method, a coupled transmission line approach is suggested. The transmission line, composed of resistive and capacitive components, represents a single electrical conduction path in the vascular cambium. As the plant stem is composed of a collection of vessels, with different supporting tissue areas between them, capacitive behavior between the lines is included as these are not efficient for electrical conduction. This results in the coupled transmission line behavior. An approximation of the first order is applied, accounting solely for nearest neighbors in the coupled transmission line. The geometry is simplified to conduction via a quasi-one-dimensional transmission model. The radial structure of the plant is neglected assuming a current flow in a single direction, and taking two parallel conduction vessels, examining the interaction between them. From the vascular cambium, a single vessel symbolizes a single conduction path, such as the xylem. A fair assumption in live plants is that the xylem vessel contains water (effectively conducting ions). At this point, the phloem is neglected, assuming a more complex sieve structure, introducing intrinsically higher resistance to electron flow. The model vessel is simplified to a single cylinder-shaped continuous channel, closer to a single xylem. The walls of the xylem are composed of cell fiber tissue that is a passive mechanical structure support for water transport. Therefore, once an electrical potential gradient is imposed across the vessel, having the confined water behave resistively, an electronic double layer is assumed to be created between the xylem wall and the liquid within the vessel. An effectively charged layer along the interface of the vessel walls is created. This resembles the behavior of semiconducting porous materials and the approach for the analysis is adapted from this assumption (Lasia, 2014; Barbero and Lelidis, 2017).
We define r and l, the radius and length of the vessel respectively, and assume the following:
a. conduction can be assumed to be alongside the vessel walls;
b. the liquid within the vessel is uniform with resistivity ρs;
c. no radial potential gradient exists;
d. cylindrical tubes represent the xylem.
Under these assumptions, the capacitance per unit length is given by
Next, coupling between adjacent lines is considered in the form of a nearest neighbor approximation. Taking the potential at position x as v1(x)and v2(x), while the current is i1(x)and i2(x) respectively (see Supplementary Figure S1). The resistance per unit length is rs and the capacitance per unit length is Cwall for each conducting channel can be found.
The different vessels are accounted for according to their contact situation relative to the electrodes. The voltage in both coupled lines is a function of time and position, yielding the coupled transmission line equations:
Assuming for both channels that the average coupling capacitances are equal C12= C21, while the average serial resistance rs is as derived for a typical single vessel. This yields the known coupled diffusion equations, that can be solved for given boundary conditions and the resultant complex impedance can be calculated as a function of frequency. However, a simpler representation for easier and broader application of the model, the lumped element circuit modeling is suggested. Each transmission line can be represented by an infinite impedance ladder (see Supplementary Figure S2), including capacitive (Zc) and resistive (Zr) elements. The number of elements can be taken as needed to increase accuracy, yet typically 2–4 elements are sufficient for low-order approximation with sufficient accuracy for practical application. As in low-pass filter ladder representation, the serial elements are resistors, while the parallel elements are capacitors. This can offer a first order approximation for the behavior of the simplified geometrical structure suggested and can be extended to the coupled transmission line model (Supplementary Figure S3). Furthermore, in the actual measurement setup several parasitic effects may be encountered, influencing the overall system behavior.
Commonly used methods for solving the behavior of coupled transmission lines are lumped element models. The Π or T configurations yield a tool to assess the interaction between the lines and their characteristics. These lumped element models converge with the transmission line when the number of elements go to infinity (Supplementary Figure S4).
A single component cannot easily represent the physical structure of the plant, therefore we combine the use of Rs, Cs and constant phase elements (CPEs) in our model (Supplementary Figure S5) (Barbero and Lelidis, 2017). Each conducting channel is described as complex impedance, capacitively coupled to its neighbors. The AC leakage current in the non-conductive part of the stem is considered to be negligible.
For practical analysis, representation using a CPE in a circuit model is commonly used (Bard and Faulkner, 1980; Macdonald, 1991; Lasia, 2014; Prasad and Roy, 2020). The CPE elements can represent elements that behave in a frequency independent manner, exhibiting a constant phase angle different from −90°, typically between 0° and −90°. This approach allows estimation of the behavior of a material, or process that responds with a time constant, or effective phase shift, across various frequency ranges. It is often used as a representation that allows attention to different dispersion regimes, where each of them is dispersed at different frequencies. It is also used to electrically describe the behavior of occurring diffusion-based conduction, kinetic flow, or a biochemical process, where conduction mechanisms and pathways differ and need to be approximated for practical use.
In this case, for biological processes that are often diffusion dominated, it may be expected to encounter the Warburg coefficient (Barbero and Lelidis, 2017). It can be derived from the solution of the transport equation with the proper boundary conditions. The exact solution, using the eigen-functions of the transport equation of 1D transmission lines at the low and medium frequency ranges, can be approximated using Constant Phase Elements (CPE) with an exponent equal to 0.5.
Based on the models explained above, several simplifications are made to represent the various RC networks using constant phase elements. Thus, a simplified model is offered. This lumped-elements model consists of several branches, each branch representing a different conduction pathway in the stem. As explained (Electrical Coupling to the Plant), there are four different connection combinations, resulting from the electrodes coupling with the vascular cambium. Each one of these branches is represented by a resistor and a CPE in series. For the conducting vessels connected directly to the electrodes, there is a direct connection (R1 and Z1). Whereas, for the channels with a single-sided connection (R2 and Z2), or no direct connection at all (R3 and Z3), a coupling capacitor is added (C2 and C3 respectively). The two connection combinations, that have only one end connected, have been combined since they are essentially the same type, from a different perspective. This model is shown in Figure 3 (equations can been found in Supplementary Table S1).
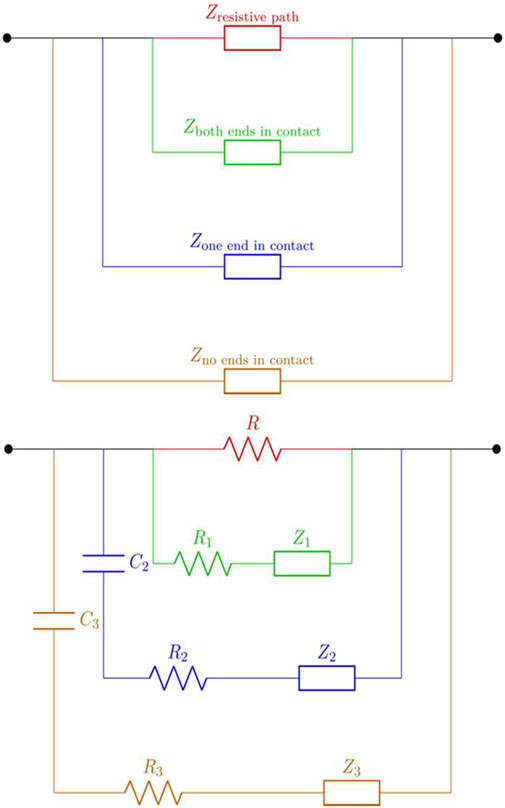
FIGURE 3. The suggested circuit model components shown in a (top) block diagram and (bottom) an equivalent circuit. The diagram presents the suggested plant structure-based model for electrical conduction. Each line represents a possible conduction path within the plant stem according to the suggest analytical model representation. In red, a completely resistive path indicating higher resistive areas; in green, a conduction channel where both ends are in contact with the electrodes. Next, in blue, a conduction path where only a single end is in contact with the electrodes, meaning that a capacitive coupling is expected. Lastly a channel that is coupled only capactively to the setup, indicating a conduction path that is in no contact with the electrodes connected.
Each branch represents the collection of the same conduction path types, i.e. both contacts connected are represented by R1 and Z1. The additional parallel element, composed only of R, represents the high resistivity plant tissue in contact with the electrodes (dermal tissue, possibly in the pith and cortex areas). As explained, the multiple vessels creating a distribution of conductive paths have both resistive and capacitive behavior across the varying frequencies. Hence, they are expected to show interaction by capacitive coupling, resembling the classical behavior of interconnect lines on a Printed Circuit Board (PCB) or Integrated Circuit (IC), and that of an electrode-dielectric interface. This simplified lumped element model is assumed to represent the electrical behavior of the plant stem up to several MHz in frequency. R1-branch represents the effective impedance of the of both-contact cases, R2-branch the one-sided contact and R3-branch the no-contact.
Different configurations are possible for EIS measurements. These include two, three and four-probe configurations. Two-probe configurations are prevalent for single frequency measurements, or in the case of ideal Ohmic contacts. The three-point configuration is often used for electrochemical measurements that include a reference electrode. Here it is proposed to use a four-point-probe setup to acquire precise and sensitive readings directly from the stem. The two external probes are designed to inject current, while the two internal probes are used to measure the voltage drop. Since the voltage is measured using a high impedance operational amplifier, this method reduces the effect of the contact impedance between the electrodes and the specimen under measurement. This is important since in the field, outside the controlled conditions of the lab, it is impossible to continuously extract the exact characteristics of those contacts that are in series to the current flow, and hence are problematic in a dual-probe configuration. Therefore, the four-point probe configuration is widely used in engineering for completing measurements where the contact between the probes and the sample are unknown, or difficult to determine. Thus, the experimental validation of the proposed model was carried out using four-point probe impedance spectroscopy setup, with electrodes galvanically coupled to the Nicotiana tabacum stem (Handbook, 2016) (an illustration and actual contact are demonstrated in Supplementary Figure S6).
A Hioki IM3570 impedance analyzer was used in an analyzer mode. Measurements were taken at 500 mV RMS, while each measurement was averaged with a factor of 4. The frequency was swept logarithmically across 50 Hz–4 MHz, collecting 801 points per sweep. Calibration including cables was completed prior to measurements. The electrodes were coupled galvanically to the plant by direct insertion into the plant stem, at a distance of 5 cm [as described in (Bar-on et al., 2019a)]. Au electrodes (0.5 mm diameter, approx. 4 cm length) were inserted into the stem, ensuring direct contact with the vascular tissues inside the stem. Measurements were carried out continuously across time periods of a few days, and the results were logged and analyzed [such a system was reported and described in detail in (Bar-on et al., 2019b)]. The experiments were repeated across seven plants, while they were each prolonged across 30–60 days at a time, and data was collected every 9 min, yielding an experiment sets of over 10,000 measurements.
The plant type was selected in terms of the knowledge of the vascular structure, robustness and the study of its genetic makeup. Nicotiana tabacum L. cv. Samsun-NN (tobacco) plants were found to be a suitable match for this study. Young plants grown for 3–4 months were used, having a stem diameter of 0.7–1.1 cm (plant length was approximately 0.7–1 m). The plants were grown in 3.9 L pots filled with coarse sand of “Negev Industrial Minerals” Ltd. Israel in a greenhouse environment where the controlled temperature was 19–28°C and natural light conditions. The VPD in the greenhouse was monitored showing repeatable behavior across different days. Irrigation with 2 L water with added Shaphir nitrate Solutions fertilization (4:2:6) of “Deshen Gat Ltd.” per pot (to ensure saturation and healthy plant growth). It was done daily during the night hours (9PM). The greenhouse was located in Tel Aviv, Israel.
Impedance spectroscopy experiments were carried out, and an example of the results is depicted on a 3D plots showing the impedance magnitude and phase with respect to frequency and time across five consecutive days (see Figure 4). A decrease in magnitude as frequency increased up to 1 MHz was observed, and phase angle values fluctuated between 0 and (−40) degrees. Data were collected across multiple specimens.
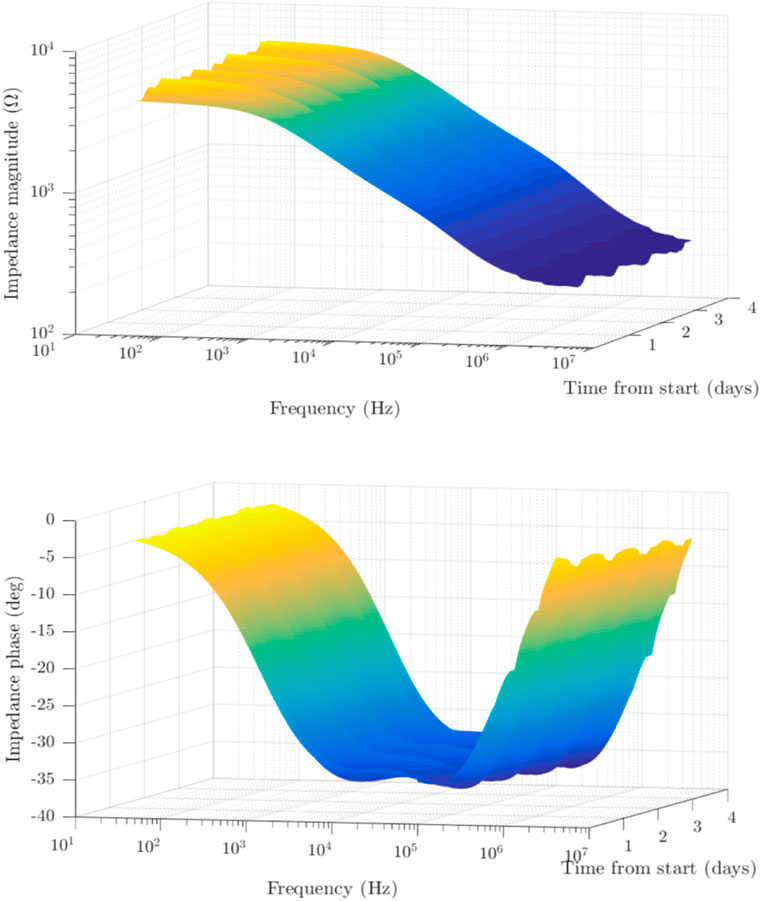
FIGURE 4. Experimentally obtained measurements of tobacco plant stem using the four-point in-vivo impedance spectroscopy setup. The data was acquired continuously across time, sampled every 20 min. The 3D representation shows the obtained impedance magnitude (top) and phase (bottom) across the measured frequency range of 50 Hz–4 MHz and across time. The variability in values can be seen to fluctuate slightly within the day, and repeat across time.
Once the experimental results were obtained, the proposed lumped element model was simulated and fitted. All experiments collected data were simulated and fitted, to the best accuracy. An evaluation of the accuracy of the model across the frequency range was performed. The impedance spectra were fitted to the lumped element model using a standard least square fitting algorithm based on the impedance magnitude spectra. Figure 5 shows the fitting of the proposed model to a representative experimentally obtained impedance spectrum (whilst Figure 6 depicts the same results in the complex plane).
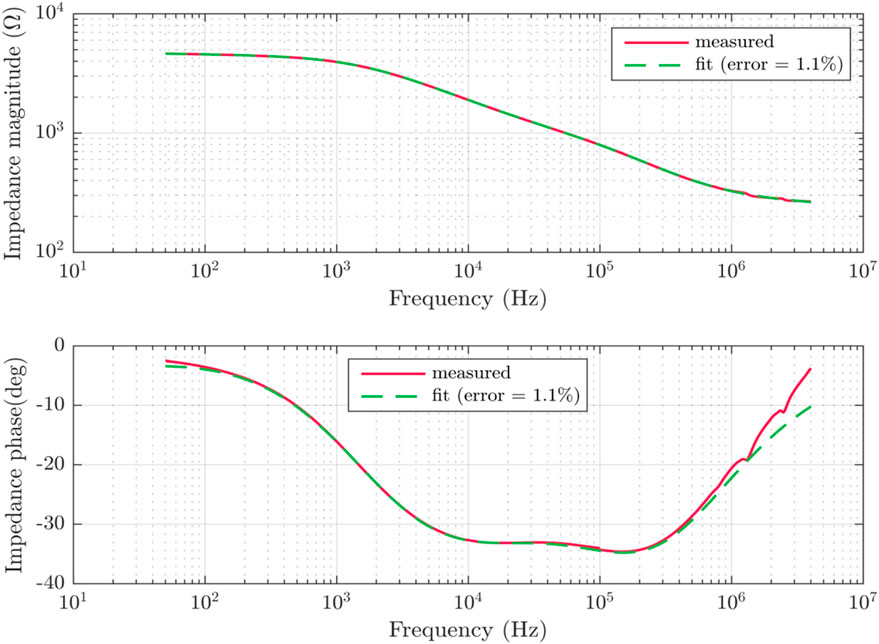
FIGURE 5. An example of the experimental impedance spectra curve data across frequency. It is shown in a Bode plot. The example shows a single impedance measurement curve and its fitting to the suggested theoretical model.
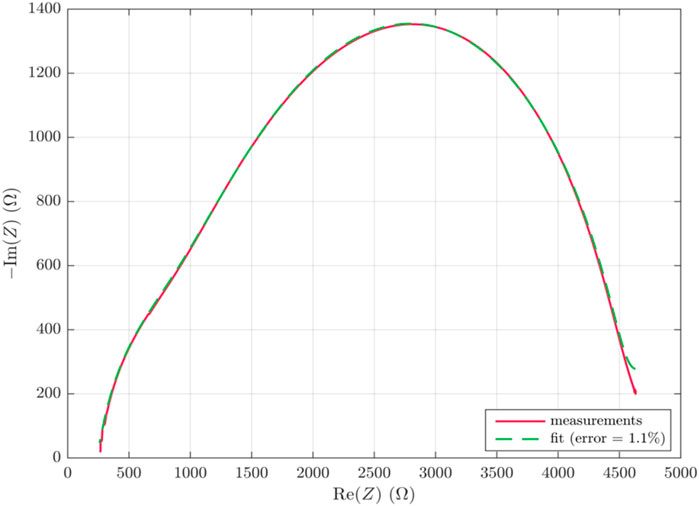
FIGURE 6. Complex plane plot of a representative impedance measurement and its model fitting.
The fitting algorithm was derived from the mathematical representation of each component in the lumped element model presented. Based on the proposed physiological model four branches were set as default for the fitting. It was run using Matlab® curve fitting toolbox. The measurement data was imported and organized in the program and then run in an iterative manner using a fitting algorithm that considers least-squares fitting. The fitting provides an estimate for each of the model coefficients, and can be presented parametrically. Initial values, and lower and upper bounds were used based on measured values of the impedance and expected model behavior according to the literature (Zhang and Willison, 1991) allowing model parameters to converge across measurements and frequencies. Thus the fitting algorithm yielded a good fit for all experimentally obtained sets of impedance spectra, with a mean relative fitting error of approximately 1.06 ± 0.12%. This error is well within the limits of experimental error, as well as the error limits of the instruments used. Figure 7 shows the time series examining this error across the different days measured, showing minimal error deviations among the various times.
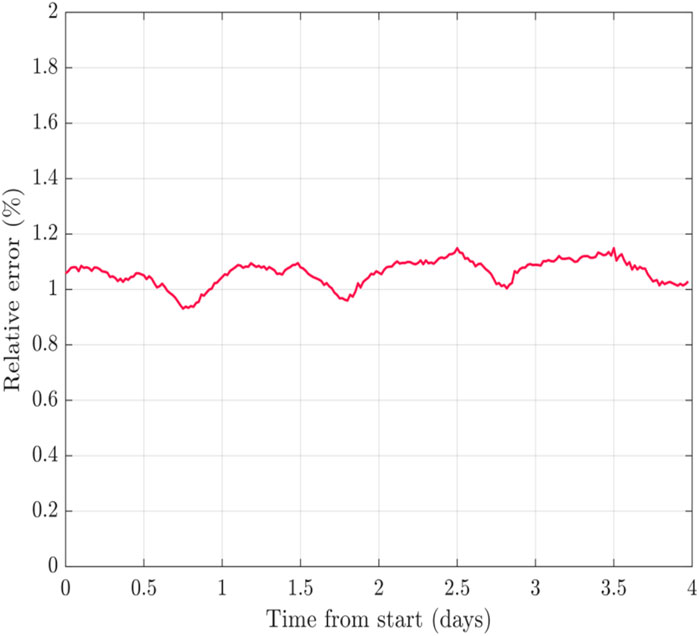
FIGURE 7. The error obtained in the fitted model shown across time. Each point in the graph represents the error in fitting for each of the impedance measurements conducted in time.
The exponent alpha for all CPEs is set to 0.5, yielding this high accuracy fit. While as anticipated, this represents a collection of diffusion dominated processes occurring in the plant [similar to the known Warburg coefficient used in electrochemical system behavior modeling (Bard and Faulkner, 1980; Macdonald, 1991; Barbero and Lelidis, 2017)]. Due to these considerations it was assumed that for the presented first order model, taking alpha to be 0.5, is a fair assumption.
Next, parametric analysis of the four branches of the proposed model was undertaken. Each branch is examined across frequency (as shown in Figure 8). The branches are then matched to the proposed model presented earlier in Figure 3 (using the same color mapping).
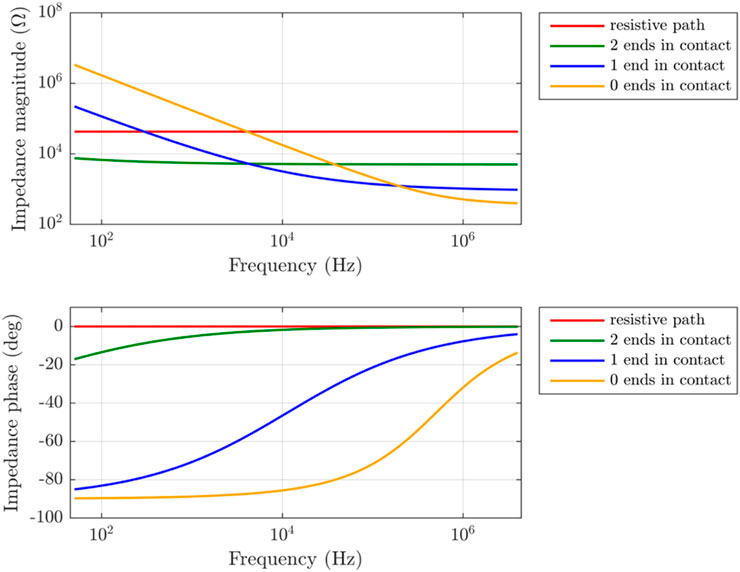
FIGURE 8. A parametric representation of the branches suggested in the model extracted from the experimental results. Each branch is represented by a single curve (color), as in the model (depicted in Figure 3). The parametric dependence of each of the model branches is shown across frequency.
Examination of each branch shows good correlation to the suggested lumped element model. Firstly, the resistive path R (marked in red), is attributed to the more resistive composites of the plant tissue material (such as ground tissue like the pith or cortex), showing resistive behavior across the frequencies. The magnitude changes slightly, and the phase angle is around 0°. Next, the conduction path where both ends are in direct contact with the electrodes (marked in green), shows lowest impedance magnitude at the lower frequencies, while showing small dependence on frequency within the measured range as expected.
The one-sided contact shows relatively high impedance at low frequencies, which can be attributed to capacitive-like behavior, resulting from the areas not in direct contact with the electrode at lower frequencies. As the frequency increases a significant decrease is visible. Finally, inspecting the behavior of the channels with no direct contact (marked in yellow), at low frequencies it shows the highest impedance magnitude, while the phase is around 90°, resembling perfect capacitive behavior. Once the frequency reaches approximately 10 kHz, a decrease in the impedance magnitude and change in the phase values is visible. This indicates that around 10 kHz, these coupled vessels start to contribute to conduction. These results support the proposed model presented for each of the different conducting branches. Therefore, based on the results obtained and the fitting accuracy of the proposed model at less than 1.5% error, it can be concluded that the proposed simplified CPE-based model can describe the electrical behavior of a living plant stem with adequate accuracy.
A theoretical modeling approach for the plant stem has been suggested for future sensors design. In-vivo electrical impedance spectroscopy on a living plant stem has been completed, and an equivalent circuit model of the stem has been derived. The model has been validated using the obtained in-vivo results, which were fitted to the model showing an impressively low error of approximately 1% throughout the investigated spectrum (50 Hz–4 MHz). The proposed equivalent circuit model was based on the four connection possibilities of the electrodes in the plant stem and the plant stem physiology. An analytical approach was initially presented, and the complicated RC-based initial multi-element model was simplified to a CPE-based model that fits the assumptions presented to represent the plant stem anatomical structure. The proposed equivalent circuit components can have a physical meaning. Therefore, it is suggested that their values can be used to evaluate the changes in plant physiological status and response, in a non-destructive and in-vivo manner. The model generates data about each parameter. The study of each parameter will allow to link each to a different effects on the plant providing a better understanding of the plant status, and its conditions. The ability to parametrically address the data, and segregate plant response will allow for improved engineering of a system in future.
The theoretical model was derived under assumptions for a dicot plant. Although these are reasonable for various dicot plants, experimental validation was carried out solely across tobacco plants. Due to the similar anatomical structure in the plant world of dicot plants, the qualitative behavior can be expected across different species. However, in order to extend the model for further plant types, including various dicot plants and monocot plants, further studies are required. In the literature, although electronic equivalent circuits have been suggested for plant measurements, a link between the suggested model and the actual plant anatomical structure has not been offered (Zhang and Willison, 1991; Zhao et al., 2013; Jócsák et al., 2019). Here we have provided a theoretical approach to the modeling derived from the plant anatomy, and shown that experimentally it can be validated with high accuracy. This shows that the theoretical assumptions are reasonable. Such an approach has not been found in the literature.
The proposed model is expected to be used as a method for plant monitoring in real-time as well as allow for improved design of electrical impedance spectroscopy systems for field testing. It may be used as a simple tool for incorporating electronic monitoring systems directly on plants in the field, allowing for better system design and implementation.
Future studies will focus on understanding the relationships between plant physiological status factors and the different values of the proposed model components. Note that the current model was devised for galvanic coupled between the source and sense electrodes to the stem, however, it can be extended to pure capacitively coupled configuration.
The raw data supporting the conclusion of this article will be made available by the authors, without undue reservation.
LB-O, a PhD graduate student, was involved in the conception of the methods, the mathematical derivation of the models, testing and analytics of the data. UG, a post-doctoral student, was involved in the experimental setup, execution and analysis. MS, was involved in the data analysis and fitting algorithms. AJ, graduate student, was involved in the research on the electrical methods, the mathematical derivation of the models, testing and analytics of the data. PR, a post-doctoral researcher, was involved in the data analysis and fitting algorithms. NS, head of the greenhouse facilities, in charge of the experiment facilitation. AV, co-Pi of this research, in charge of the plant experiment, modeling and critical discussion of the data. YS-D, head of the lab in Israel, conception of the idea, supervising the student work and physical modeling. DD, head the lab at Italy, electrical testing, data fitting and model parameters’ extraction.
This research was funded the Ministry of Science and Technology, Israel (Grant No. 3-14345 titled “Single cells Sensor”), the Israel Science Foundation (Grant No. 1616/17), and the Manna Centre for Food Security, Tel Aviv University.
The authors declare that the research was conducted in the absence of any commercial or financial relationships that could be construed as a potential conflict of interest.
All claims expressed in this article are solely those of the authors and do not necessarily represent those of their affiliated organizations, or those of the publisher, the editors and the reviewers. Any product that may be evaluated in this article, or claim that may be made by its manufacturer, is not guaranteed or endorsed by the publisher.
The authors would like to thank Prof. Roni Aloni (Tel Aviv University) for his expertise, and the Italian Ministry of Foreign Affairs for their support in collaboration with the Politecnico di Torino.
The Supplementary Material for this article can be found online at: https://www.frontiersin.org/articles/10.3389/felec.2021.753145/full#supplementary-material
Bar-on, L., Jog, A., and Shacham-Diamand, Y. (2019a). Four Point Probe Electrical Spectroscopy Based System for Plant Monitoring. IEEE Int. Symp. Circuits Syst. (1–5). 2019. doi:10.1109/iscas.2019.8702623
Bar-On, L., Peradotto, S., Sanginario, A., Ros, P. M., Shacham-Diamand, Y., and Demarchi, D. (2019b). “In-Vivo Monitoring for Electrical Expression of Plant Living Parameters by an Impedance Lab System,” 2019 26th. IEEE Int. Conf. Electron. Circuits Syst., 178–180.
Barbero, G., and Lelidis, I. (2017). “Analysis of Warburg’s impedance and its equivalent electric circuits. Phys. Chem. Chem. Phys. 19 (36), 24934–24944. doi:10.1039/c7cp04032f
Bard, L. R., and Faulkner, A. J. (1980). Electrochemical Methods -Fundamentals and Applications. New Jersey: Wiley & Sons.
Bellón, B., Bégué, A., Lo Seen, D., de Almeida, C. A., and Simões, M. (2017). A remote sensing approach for regional-scale mapping of agricultural land-use systems based on NDVI time series. Remote Sens. 9 (6). doi:10.3390/rs9060600
Benedetti, R., and Rossini, P. (1993). On the use of NDVI profiles as a tool for agricultural statistics: The case study of wheat yield estimate and forecast in Emilia Romagna. Remote Sensing Environ. 45 (3), 311–326. doi:10.1016/0034-4257(93)90113-c
Bertemes-Filho, P., Bertemes, W. L., Cavalieri, R., Torres Paré, A., Spessatto, J., and Savi, D. (2020). Ripening Classification of Bananas (Musa Acuminate) Using Electrical Impedance Spectroscopy and Support Vector Machine. Int. J. Biosens. Bioelectron. 6 (4), 99–101. doi:10.15406/ijbsbe.2020.06.00195
FAO (2017). “The future of food and agriculture–Trends and challenges,” in Annual Report (Rome: FAO).
Fritz, S., See, L., Bayas, J. C. L., and Waldner, F. (2017). A comparison of global agricultural monitoring systems and current gaps. Agric. Syst. 168, 258–272.
Fritz, S., See, L., Bayas, J. C. L., and Waldner, F. (2018). A comparison of global agricultural monitoring systems and current gaps. Agric. Syst. 168, 2019.
Garlando, U., Bar-On, L., Avni, A., Shacham, Y., and Demarchi, D. (2020). Plants and Environmental Sensors for Samrt Agriculture, an overview. IEEE Sensors 2020, 1–4.
Garlando, U., Bar-On, L., Ros, P. M., Sanginario, A., Calvo, S., Martina, M., et al. (2021). Analysis of In Vivo Plant Stem Impedance Variations in Relation with External Conditions Daily Cycle. IEEE Int. Symp. Circuits Syst. (Iscas) 2021, 1–5. doi:10.1109/iscas51556.2021.9401242
Garlando, U., Bar-On, L., Ros, P. M., Sanginario, A., Peradotto, S., Shacham-Diamand, Y., et al. (2020). “Towards Optimal Green Plant Irrigation: Watering and Body Electrical Impedance” in 2020 IEEE International Symposium on Circuits and Systems. California: ISCAS, 1–5. doi:10.1109/ISCAS45731.2020.9181290
Jócsák, I., Végvári, G., and Vozáry, E. (2019). Electrical impedance measurement on plants: a review with some insights to other fields. Theor. Exp. Plant Physiol. 31 (3), 359–375. doi:10.1007/s40626-019-00152-y
Jog, A., Bar-on, L., Avni, A., and Shacham-Diamand, Y. (2020). Feasibility of Signal Transmission for Plant Body Channel Communication in Tobacco. IEEE SENSORS 2020, 1–4. doi:10.1109/SENSORS47125.2020.9278943
Lasia, A. (2014). General Method of Obtaining Impedance of Complex Reactions. New York: Springer, 147–153. doi:10.1007/978-1-4614-8933-7_6
Lasia, A. (1995). Impedance of porous electrodes. J. Electroanal. Chem. 397 (1), 27–33. doi:10.1016/0022-0728(95)04177-5
Luvisi, A. (2016). Electronic identification technology for agriculture, plant, and food. A review. Agron. Sust. Dev. 36 (1), 1–14. doi:10.1007/s13593-016-0352-3
Luyet, B. J. (1932). Variation of the electric resistance of plant tissues for alternating currents of different frequencies during death. J. Gen. Physiol. 15. doi:10.1085/jgp.15.3.283
Zhang, M. I. N., and Willison, M., “Electrical Impedance Analysis in Plant Tissues: A Double Shell Model,” J. Exp. Bot., vol. Volume 42, no. Issue 11, pp. 1465–1475. 1991. doi:10.1093/jxb/42.11.1465
Muñoz-Huerta, R. F., de j Ortiz-Melendez, A., Guevara-Gonzalez, R. G., Torres-Pacheco, I., Ruiz, G. H., Contreras-Medina, L. M., et al. (2014). An analysis of electrical impedance measurements applied for plant status estimation in lettuce. Sensors (Switzerland) 14 (7), 11492–11503. doi:10.3390/s140711492
Pandey, R., Teig-Sussholz, O., Schuster, S., Avni, A., and Shacham-Diamand, Y. (2018). Integrated electrochemical Chip-on-Plant functional sensor for monitoring gene expression under stress. Biosens. Bioelectron. 117 (April), 493–500. doi:10.1016/j.bios.2018.06.045
Prasad, A., and Roy, M. (2020). Bioimpedance analysis of vascular tissue and fluid flow in human and plant body: A review. Biosyst. Eng. 197, 170–187. doi:10.1016/j.biosystemseng.2020.06.006
Repo, T., Zhang, G., Ryyppö, A., and Rikala, R. (2000). The electrical impedance spectroscopy of scots pine (Pinus sylvestris L.) shoots in relation to cold acclimation. J. Exp. Bot. 51 (353), 2095–2107. doi:10.1093/jexbot/51.353.2095
Ros, P. M., Macrelli, E., Sanginario, A., Shacham-Diamand, Y., and Demarchi, D. (2019). “Electronic System for Signal Transmission Inside Green Plant Body,” in IEEE International Symposium on Circuits and Systems (California: IISCAS)), 1–5. doi:10.1109/iscas.2019.8702577
Sakamoto, T., and Kimura, S. (2018). Plant Temperature Sensors. Sensors 18 (12), 4365. doi:10.3390/s18124365
Sambuelli, L., Socco, L. V., and Godio, A. (2003). “, 1. Ultrasonic, electrica and radar measurements for living trees assessmentLeonardo, no.
Attia al Hagrey, S., “Geophysical imaging of root-zone, trunk, and moisture heterogeneity,” vol. 58, no. 4, pp. 839–854. 2007. doi:10.1093/jxb/erl237
Sophocleous, M. (2021). Towards Fully Automated Decision-Making Systems for Precision Agriculture. IGI Glob., 71–93. doi:10.4018/978-1-7998-5000-7.ch004
Sorieul, M., Dickson, A., Hill, S. J., and Pearson, H. (2016). Plant fibre: molecular structure and biomechanical properties, of a complex living material, influencing its deconstruction towards a biobased composite. Materials 9 (8), 618. doi:10.3390/ma9080618
Stamm, A. J. (1927). The Electrical Resistance of Wood as a Measure of Its Moisture Content. Ind. Eng. Chem. 19 (9), 1021–1025. doi:10.1021/ie50213a022
Steppe, K., Vandegehuchte, M. W., Tognetti, R., and Mencuccini, M. (2015). Sap flow as a key trait in the understanding of plant hydraulic functioning. Tree Physiol. 35 (4), 341–345. doi:10.1093/treephys/tpv033
Vodeneev, V., Mudrilov, M., Akinchits, E., Balalaeva, I., and Sukhov, V. (2018). Parameters of electrical signals and photosynthetic responses induced by them in pea seedlings depend on the nature of stimulus. Funct. Plant Biol. 45, 160–170. doi:10.1071/fp16342
Volkov, A. G. (2000). Green plants: Electrochemical interfaces. J. Electroanal. Chem. 483 (1), 150–156. doi:10.1016/s0022-0728(99)00497-0
Volkov, A. G., Nyasani, E. K., Tuckett, C., Blockmon, A. L., Reedus, J., and Volkova, M. I. (2016). Cyclic voltammetry of apple fruits: Memristors in vivo. Bioelectrochemistry 112, 9–15. doi:10.1016/j.bioelechem.2016.07.001
Walter, A., Finger, R., Huber, R., and Buchmann, N. (2017). Opinion: Smart farming is key to developing sustainable agriculture. Proc. Natl. Acad. Sci. USA 114 (24), 6148–6150. doi:10.1073/pnas.1707462114
Yan, X., Wang, Z., Huang, L., Wang, C., Hou, R., Xu, Z., et al. (2009). Research progress on electrical signals in higher plants. Prog. Nat. Sci. 19 (5), 531–541. doi:10.1016/j.pnsc.2008.08.009
Zhao, D. J., Wang, Z., Wen, X., and Li, J. (2013). Recording extracellular signals in plants: A modeling and experimental study. Math. Comput. Model. Elsevier 58 (3–4), 556–563. doi:10.1016/j.mcm.2011.10.065
Zheng, L., Wang, Z., Sun, H., Zhang, M., and Li, M. (2015). Real-time evaluation of corn leaf water content based on the electrical property of leaf. Comput. Electron. Agric. 112, 102–109. doi:10.1016/j.compag.2014.11.007
Keywords: plant impedance, plant electrical model, plant equivalent circuit, electrical impedance spectroscopy, precision agriculture
Citation: Bar-On L, Garlando U, Sophocleous M, Jog A, Motto Ros P, Sade N, Avni A, Shacham-Diamand Y and Demarchi D (2021) Electrical Modelling of In-Vivo Impedance Spectroscopy of Nicotiana tabacum Plants. Front. Electron. 2:753145. doi: 10.3389/felec.2021.753145
Received: 04 August 2021; Accepted: 06 September 2021;
Published: 21 September 2021.
Edited by:
Khaled Nabil Salama, King Abdullah University of Science and Technology, Saudi ArabiaReviewed by:
Ahmed H. Madian, Nile University, EgyptCopyright © 2021 Bar-On, Garlando, Sophocleous, Jog, Motto Ros, Sade, Avni, Shacham-Diamand and Demarchi. This is an open-access article distributed under the terms of the Creative Commons Attribution License (CC BY). The use, distribution or reproduction in other forums is permitted, provided the original author(s) and the copyright owner(s) are credited and that the original publication in this journal is cited, in accordance with accepted academic practice. No use, distribution or reproduction is permitted which does not comply with these terms.
*Correspondence: Lee Bar-On, leebaron@mail.tau.ac.il
Disclaimer: All claims expressed in this article are solely those of the authors and do not necessarily represent those of their affiliated organizations, or those of the publisher, the editors and the reviewers. Any product that may be evaluated in this article or claim that may be made by its manufacturer is not guaranteed or endorsed by the publisher.
Research integrity at Frontiers
Learn more about the work of our research integrity team to safeguard the quality of each article we publish.