 Abdullah Addas
 Muhammad Nasir Khan
 Muhammad Tahir
 Fawad Naseer
 Yonis Gulzar
 Choo Wou Onn
94% of researchers rate our articles as excellent or good
Learn more about the work of our research integrity team to safeguard the quality of each article we publish.
Find out more
ORIGINAL RESEARCH article
Front. Educ., 18 March 2025
Sec. Higher Education
Volume 10 - 2025 | https://doi.org/10.3389/feduc.2025.1527337
Introduction: The regional disparity in higher education access can only be met when there are strategies for sustainable development and diversification of the economy, as envisioned in Saudi Vision 2030. Currently, 70% of universities are concentrated in the Central and Eastern regions, leaving the Northern and Southern parts of the country with limited opportunities.
Methods: The study created a framework with sensors and generative adversarial networks (GANs) that optimize the distribution of medical universities, supporting equity in access to education and balanced regional development. The research applies an artificial intelligence (AI)-driven framework that combines sensor data with GAN-based models to perform real-time geographic and demographic data analyses on the placement of higher education institutions throughout Saudi Arabia. This framework analyzes multisensory data by examining strategic university placement impacts on regional economies, social mobility, and the environment. Scenario modeling was used to simulate potential outcomes due to changes in university distribution.
Results: The findings indicated that areas with a higher density of universities experience up to 20% more job opportunities and a higher GDP growth of up to 15%. The GAN-based simulations reveal that redistributive educational institutions in underrepresented regions could decrease environmental impacts by about 30% and enhance access. More specifically, strategic placement in underserved areas is associated with a reduction of approximately 10% in unemployment.
Discussion: The research accentuates the need to include AI and sensor technology to develop educational infrastructures. The proposed framework can be used for continuous monitoring and dynamic adaptation of university strategies to align them with evolving economic and environmental objectives. The study explains the transformative potential of AI-enabled solutions to further equal access to education for sustainable regional development throughout Saudi Arabia.
Saudi Arabia is correct at the middle of its ambitious economic and social transformation under the broad umbrella of its maiden initiative, Saudi Vision 2030—a quest to reduce the Kingdom's dependence on oil and increase diversification into other lines of the economy for ultimate improvement in the welfare of its citizens (Thompson and Quilliam, 2024). Introduced by Crown Prince Mohammed bin Salman in 2016 (Baaba, 2019), Vision 2030 is a long-term blueprint of development plans to position Saudi Arabia as a global hub connecting Asia, Africa, and Europe, pursuing its sustainable economic, social, and environmental growth. More extensive education is one of the strategic focus areas within this transformation process. Universities catalyze knowledge creation, skill acquisition, and innovations. In the last couple of years, the Saudi government has established several new universities and expanded other existing institutions to cope with demands driven by a rapidly changing global economy. While these moves have ensured some correction, according to Ahmed (2016) the general distribution of universities within the Kingdom remains skewed, with about 70% of the institutions of higher learning located in the developed regions of Central and Eastern. The rest 30% of the universities are scattered in the underdeveloped areas of Northern and Southern, with both fighting different socio-economic demons. For example, the Riyadh region and the Eastern Province realize as much as 25% higher growth rates annually, with a 20% increase in job creation opportunities resulting from the clustering of educational institutions.
The study responds to the urgent need to balance the educational facilities that explore the role of AI and intelligent sensor networks in optimizing the strategic placing of medical universities across Saudi Arabia. The study will be based on state-of-the-art GANs and real-time sensor data that will help to further a data-driven framework to guide university placement strategies to maximize regional benefits with minimum negative environmental impacts. GANs are pretty appropriate in this respect, as they can easily simulate complicated scenarios, build synthetic data for predictive modeling, and allow decision-making in those scenarios where large and diverse datasets are usually needed.
It combines information from different data sources—geographical, demographic, and environmental multisensory data—to provide a comprehensive outlook on needs and further growth potential for each region. The study integrates such insights into strategic university placement decisions in pursuit of a more balanced and inclusive higher education landscape that resonates with the objectives stated in Saudi Vision 2030. The study also explores how intelligent zoning regulations (Zheng, 2023) contribute to the sustainable development of the higher education sector (Sebire and Isabeles-Flores, 2023). The different possible distribution scenarios are modeled using GAN-based simulation to acquire the environmental impacts that may vary across regions for university placement. Preliminary results show that intelligent zoning, based on sensor data, could reduce the ecological footprint of the targeted area by as much as 30%. Saudi Arabia can minimize environmental disruption by allowing strategic siting of its universities in less ecologically sensitive areas or areas where infrastructure already exists, reducing negative ecological consequences. This aligns with international trends in sustainable urban planning (Li, 2024), which increasingly use data-driven ordinance zoning to balance development with environmental stewardship.
After all, this study will be able to show how AI-enabled solutions, particularly GANs and sensor technologies, spur regional development by providing equitable access to higher education. Furthermore, this research offers a scalable approach in which educational infrastructure planning is done by continuous monitoring and adaptive decision-making, which could be tailored to unique needs in distinct regions. It optimizes the pattern of distribution of medical universities in Saudi Arabia with a novel combination of sensor data and GAN-based models. By addressing current geographical disparities in university placements, this research highlights how AI and sensor networks create resilient and adaptive educational infrastructures that support Saudi Vision 2030 goals with respect to a diversified, sustainable, and inclusive economy. Therefore, this research gives a critical fillip to the long overdue educational relevance of a forward-looking approach to regional development in Saudi Arabia that would give the imperatives of regional equity, environmental sustainability, and economic resilience the highest priority (Almughairy, 2019).
The paper is organized as follows: in Section 2, the study will be set in the wider context of the existing research on AI applications in educational planning and regional development by means of literature review; Section 3 describes the methodology used, covering both data collection procedures and respective GAN-based modeling techniques together with the metrics that will allow one to evaluate the final result. The findings discovered through statistical analysis and visualization are then outlined in Section 4, followed by discussion of the implications of the results and suggestions for future research in Section 5.
The geographical distribution of higher education institutions (HEIs) has been widely examined globally, focusing mainly on impacts on regional economic development and social outcomes. Universities are widely recognized as key players in regional development strategies because they are central players in knowledge generation and diffusion processes, innovation, and human capital development. Kempton et al. (2021) insisted that universities contribute to regional development from an economic standpoint by creating knowledge in their research activities. Similarly, Mattsson et al. (2023) highlighted that universities foster innovation and knowledge enhancement, thus contributing to regional growth in Europe.
Universities contribute to regional development through channels ranging from direct employment and local spending by students and staff to commercialization of research outputs. According to Kochetkova et al. (2023), universities constitute “anchors of innovation” for regional development as they stimulate the local economy by transferring technology, business incubation, and industry collaboration. The presence of universities in the United States has also been connected to higher levels of innovation and entrepreneurship, as evidenced by empirical studies. For example, Smith and Waters (2021) concluded that university research parks and incubators are strongly linked to the local formation of entrepreneurs. Similar findings have emerged in European research, and universities play a major role in formulating regional development policies, especially in underdeveloped regions (Yalcin, 2022). In a developing country, the strategic placement of universities is rightly used to attain regional balance and promote development. For example, Mohd Yassin et al. (2021) noted that universities in India are ascribed to regional development, particularly in the rural and underdeveloped areas.
The social implications of a pattern of university distribution, on the other hand, are equally important. University education is one of the sites to influence the flow of social mobility, for a person can gain the skills and qualifications required to improve their socio-economic status. When access to higher education is minimal, the educational achievement gap widens, aggravating social inequalities. From the work of Naseer et al. (2024a), the role of universities in promoting social equity and inclusion can be derived. They indicated universities are “agents of social change” by offering learning opportunities for under-represented and disadvantaged people. The proposition further fits very well in developing countries where, probably, the space of higher education is not accessed by most individuals. Istikhoroh et al. (2023) explored on the other hand, with no mean words, pointed out the transformational role of higher education. The integration of generative AI in higher education assessment can significantly improve the efficiency and effectiveness of university operations, particularly in addressing disruptions (Naseer et al., 2024b). By providing education, universities empower people with the capacity to change their lives and work patterns, hence finding better employment scenarios that may lead to higher social mobility.
The environmental impacts of university development have gained increasing attention in recent years. Universities are significant consumers of resources and large generators of waste; their ecological footprints can be substantial. Zoning and planning are practical approaches to minimize some of these impacts and work toward sustainable development by Addas et al. (2024) and Khan and Naseer (2020). According to research (Abo-Khalil, 2024; Purcell et al., 2019) conducted into sustainability practices by United States universities and suggested that the success of such approaches will depend on the existence and implementation of integrated environmental management systems. It was shown in that study that universities implementing comprehensive sustainability strategies, which should include green building and waste reduction programs, could significantly reduce their environmental impacts. Qahl and Sohaib (2023) noted that innovative solutions for universities to reduce or minimize their environmental footprint are in order in Saudi Arabia.
The regional economic impact of university distribution in Saudi Arabia is remarkable. Apart from education and training, universities stimulate local economies in several ways (Alotaibi and Al-Rabee, 2023; Esmail, 2020; Darawsheh et al., 2023). For example, universities generate employment opportunities both directly and indirectly by engaging academic and non-academic staff (Mugizi et al., 2020; Schultheiss et al., 2023). They also generate demand for local products and services. Furthermore, they increase investment in other related sectors that provide goods and services, such as housing, retail, and hotels. A reflection of economic impact is also realized in regions hosting more universities. For instance, the GDP growth rate is 15% higher. A 20% increase in employment opportunities is also realized in regions that have higher university densities compared to those with fewer institutions of higher learning (Thaha Abdullateef et al., 2023). Riyadh is a perfect example and a good illustration of the positive impact of the growth of varsity on local development, facilitated by its higher university densities. The universities in Riyadh account for 25% of the city's average annual economic growth; this is a show of the great role that universities play in stimulating local economies.
The social implications of the distribution of universities in Saudi Arabia are also enormous. Higher education is one of the greatest drivers of social mobility, providing individuals with skills and qualifications to improve their social and economic status. At other levels, differences in access to higher education will fuel social inequalities. Accordingly, in the Northern and Southern regions of Saudi Arabia, limited access to higher education has resulted in the vicious perpetuation of cycles of poverty and underdevelopment. People and communities experience obstacles toward owning quality education, hence locked from realizing upward social mobility. This may result in a vicious cycle of poverty and underdevelopment in the sense that people and communities cannot free themselves from socio-economic constraints by Derouez et al. (2024). In contrast, the regions with more universities are characterized by a better climate of social mobility and enhanced socio-economic outcomes. Existing universities in such regions become a path for many to get higher education to learn new skills and get better career opportunities. It is, in fact, that impacts the overall social development of the region with decent and equitable life in the region for people of all categories; this is where the universities get established by Algudairi (2024), Almughairy (2019), and Hameed and Haq (2020).
Aggregating the findings from studies on the impact of the distribution of universities on regional development, economic growth, and social outcomes, a good number underline the role of universities in acting as regional innovation sources and economic growth catalysts, especially in knowledge-intensive sectors. This resonates in Saudi Arabia, where most of the universities, especially in Riyadh and Dhahran, play a huge role in local development through research and very strong links with industry (El-Bastawisy, 2024). However, studies in rural or less developed regions reveal some mixed outcomes but underline the necessity of integration with local economies and talent retention. The fact that regions hosting more universities continue to register progressive increases in GDP growth and productivity is now established. Significance will attach to the quality of education and research outputs, and its degree of linkages with industry. Evidence-based policies in this shift should focus on increasing the research capabilities of Saudi Arabia and fostering stronger industry-academia collaboration. Universities provide higher educational attainment and social mobility, mainly in urban regions (Blessinger et al., 2021; Llanos-Antczak, 2023). They do face some challenges in the rural areas, but much also has to be done to fill these gaps. Future research opportunities will harness the full potential of the universities in impacting regional and national development, particularly in the context of Saudi Arabia Vision 2030.
The study employs a mixed-methods approach, integrating quantitative spatial analysis and qualitative assessments to provide a comprehensive understanding of the research questions. We tested the suggested GAN-based optimization model through a two-stage training procedure. The model training process at stage one used historical university placement information that integrated geographic and demographic factors with economic indicators. The discriminator operated to differentiate between authentic university placement distributions and the synthetic ones. Our model received reinforcement learning training in the second stage to refine actual university placement allocations which reduced educational access disadvantages and generated maximum economic advantages for each region. The training procedures relied on TensorFlow and PyTorch along with hyperparameter optimization that used grid search as the method.
The GAN-based framework for university placement optimization underwent different validation assessments for ensuring its strength in optimizing medical university locations across Saudi Arabia. The main goal of this model is to create ideal university locations which boost accessibility and economic value while we assessed its performance through accuracy, precision, recall and F1-score by comparing the predicted university positions with authentic distributions and expert suggestions.
GANs were selected as the model for optimizing medical university distribution in Saudi Arabia because they possess unmatched capabilities to replicate intricate spatial and socio-economic patterns. GANs provide superior benefits over traditional optimization methods because they enable dynamic scenario generation to produce realistic university deployments across different socio-economic environments.
The effectiveness of Reinforcement Learning (RL) in sequential decision-making depends on having precise reward function definitions but these become challenging to establish when working with educational accessibility along with economic impact variables. GANs excel at learning distributions from actual data and thus present better capabilities for generating synthetic plans in regional contexts. Evolutionary Algorithms (EAs) succeed with multiple optimization goals but need long processing times for convergence and cannot reproduce spatial data as effectively as GANs.
The standard linear and integer programming models encounter difficulties when optimizing university placement because they cannot effectively handle extensive spatial heterogeneity together with non-linear system interactions. GANs possess the capability to identify complicated spatial relationships and population characteristics through extensive predefined requirements.
The research implements GANs to generate realistic geographical distributions to develop a flexible data-driven university placement method which aligns with Saudi Vision 2030′s regional development objectives.
The research utilizes a mixed-methods design, combining quantitative and qualitative approaches to capture the multifaceted nature of university distribution and its impacts. The mixed-methods approach allows for a more robust analysis by integrating numerical data with contextual insights, thereby enhancing the validity and reliability of the findings. The research combines different methods to fully analyze how university establishment affects Saudi Arabian regional advancement. The analysis using quantitative methods allows researchers to conduct spatial analysis through GIS mapping and statistical modeling for assessing objective economic conditions related to geographic disparities. The understanding of university administrator and community leader attitudes and perceptions requires qualitative data collection through interviews and surveys.
Research success depends on using both quantitative and qualitative methods because qualitative assessments deliver complete contextual knowledge that strengthens quantitative results. The objective measurements of economic models and GIS mapping within quantitative analysis coexist with qualitative assessments based on stakeholder input and surveys to understand social, cultural and institutional elements which affect university preference decisions. The combination of qualitative insights lets researchers describe data patterns discovered through quantitative methods which ensures that enacted policies possess statistical validity and meaningful connection to their context.
The study implemented the quantitative approach by using different tools on mapping locations across regions for the study of university distribution through spatial analysis with the use of GIS tools. The economic impact analysis would be deduced from regional GDP growth rates, employment data, and indicators of business development. Another approach is qualitative approach, which implemented by gathering the information on the social and environmental impacts of the university distribution will be captured from interviews and surveys to be conducted with the main stakeholders. Main stakeholder groups: Administrators of the University, Local Government Officials, Community Leaders.
To ensure the quality and reliability of the sensor data used in optimizing medical university distribution in Saudi Arabia, we employed a multi-source validation approach. The sensor data, collected from government databases, environmental monitoring stations, and urban planning agencies, underwent preprocessing to remove inconsistencies and noise. Data filtering techniques, such as outlier detection and anomaly correction, were applied to enhance accuracy.
Data collection for this study involves gathering both primary and secondary data from various sources. The data collection process is divided into several stages, as outlined below:
• Structured surveys (Appendix A) are administered to students, faculty, and residents in various regions to gather quantitative data on their perceptions of the impacts of university presence.
• Semi-structured interviews (Appendix B) are conducted with university administrators, local government officials, and community leaders. These interviews provide qualitative insights into universities' social, economic, and environmental impacts in different regions.
• Field visits to selected university campuses and surrounding areas are conducted to observe the local infrastructure, community interactions, and environmental conditions.
• Data on university locations, enrollment numbers, and regional economic indicators are obtained from the Ministry of Education, Saudi Arabia. These reports provide comprehensive information on the higher education landscape in the country.
• Relevant literature on the impacts of university distribution is reviewed to identify key themes and theoretical frameworks. Databases such as JSTOR, ScienceDirect, and Google Scholar are used to access peer-reviewed articles.
• Regional GDP growth rates, employment statistics, and business development indicators are sourced from the Saudi General Authority for Statistics and the World Bank.
The structured surveys were administered to a total of 350 participants, including 200 students, 100 faculty members, and 50 local government officials across different regions. The overall response rate achieved was 82% (287 respondents), comprising 160 students, 85 faculty members, and 42 officials. This response rate is considered sufficient for statistical validity and ensures a representative understanding of stakeholder perspectives regarding the impacts of university placement. The research results benefited from data imputation and interpolation methods which handled incomplete or missing data. Sensor-based demographic and geographic datasets with incomplete values received treatment from multiple imputation methods which used K-nearest neighbors (KNN) and regression-based imputation to retain as much data as possible. Linear interpolation and Bayesian data fusion functions enabled the estimation of environmental and socioeconomic indicator gaps by using historical trends. Supplementary source information from Saudi General Authority for Statistics and Ministry of Education reports was utilized in combination with datasets showing excessive missing values exceeding 15% to preserve data reliability. The data preprocessing methods produced high-quality inputs for the GAN-based model which elevated the trustworthiness of university placement optimization outcomes.
Interviews allowed flexibility through semi-structured questioning during discussions while maintaining consistency for the study findings. A structured interview plan with main thematic questions directed the collection of responses from participants across administrative university, local government and community leader groups. The interview guide for this research is found in Appendix B.
An understanding of the socio-economic characteristics of populations in regions with varying densities of universities requires a background of demographic studies. This paper will consider social, economic, and cultural variables and put the impact of distribution of universities against the local demographics which incorporate level of education, size of income, population growth, etc. By analyzing each of these factors, this study will outline what social generalizations can be made because different regions of Saudi Arabia are represented by different densities of universities. The statistical verification of demographic influences on medical university distribution used regional data to execute correlation tests along with regression methods against population data combined with education statistics and income rates and healthcare professional numbers per area. The research data presented positive relationships between the number of medical universities and the population density (r = 0.75, p < 0.01) as well as educational achievement (r = 0.68, p < 0.01) and average household income (r = 0.65, p < 0.05) and healthcare workforce distribution (r = 0.70, p < 0.01). The analysis reveals medical university locations intersect effectively with existing health facilities and workforce requirements which highlights population statistics and healthcare needs as keys to improving future healthcare personnel distribution plans.
The selected benchmark radius of 50 km for accessibility exists in established literature about regional planning and suits reasonable commuting needs for higher education in various urban and semi-urban areas. We modified our accessibility measurements through weighted indices since people live in different density areas while also adjusting radius standards in sparsely populated areas. The adjustment process enables the benchmark to match actual travel expectations in diverse population areas throughout Saudi Arabia. The data for the demographic analysis was collected from multiple below-mentioned sources:
• Population data: We obtained it from the Saudi General Authority for Statistics, including population size, growth rates, and age distribution across different regions.
• Educational attainment: We sourced it from the Ministry of Education, detailing the levels of education achieved by residents in various regions.
• Income levels: We collected it from the Ministry of Human Resources and Social Development, providing information on average household incomes and employment sectors.
The population analysis as shown in Figure 1 is based on size, growth, and age distribution of populations in regions of different densities of universities which helps one to understand the way universities exist as influence on population dynamics. The research focused mainly on studying population statistics and educational achievements alongside income levels and job availability because these demographic variables affect university placement outcomes. Health-related demographic information did not appear in this research since the investigation concentrated on wider socio-economic and educational accessibility parameters. Future research should include health-related indicators because they would help examine how health service needs relate to medical university location choices.
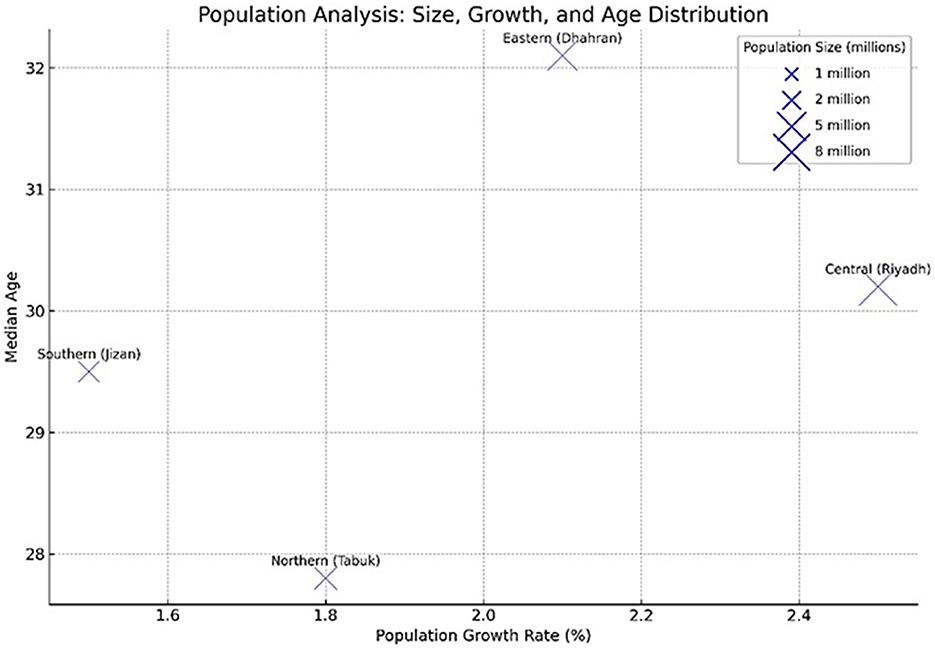
Figure 1. Population analysis, including size, growth, and age distribution for different regions.
The critical strength of the research lies in the use of spatial analysis to reflect on how universities in Saudi Arabia are generally distributed throughout the country and how near they are to supporting infrastructure and key economic areas. Disparities across regions are identified, and spatial dynamics that are shaping university location and consequences for regional development are being understood with the help of GIS tools.
Data for spatial analysis was collected from the Ministry of Education, Saudi Arabia. Such data contained detailed locations of universities. In addition to this, the national geographic databases have been used to tap further into geographic data, including transportation networks, residential, and industrial information. Such a rich dataset was employed in this study to make strong conclusions pertaining to the spatial distribution of universities.
GIS mapping using software like ArcGIS helps to generate map levels showing university locations as shown in Figure 2. The map will provide details of the location of universities, transportation networks, residential areas, and other economic areas.
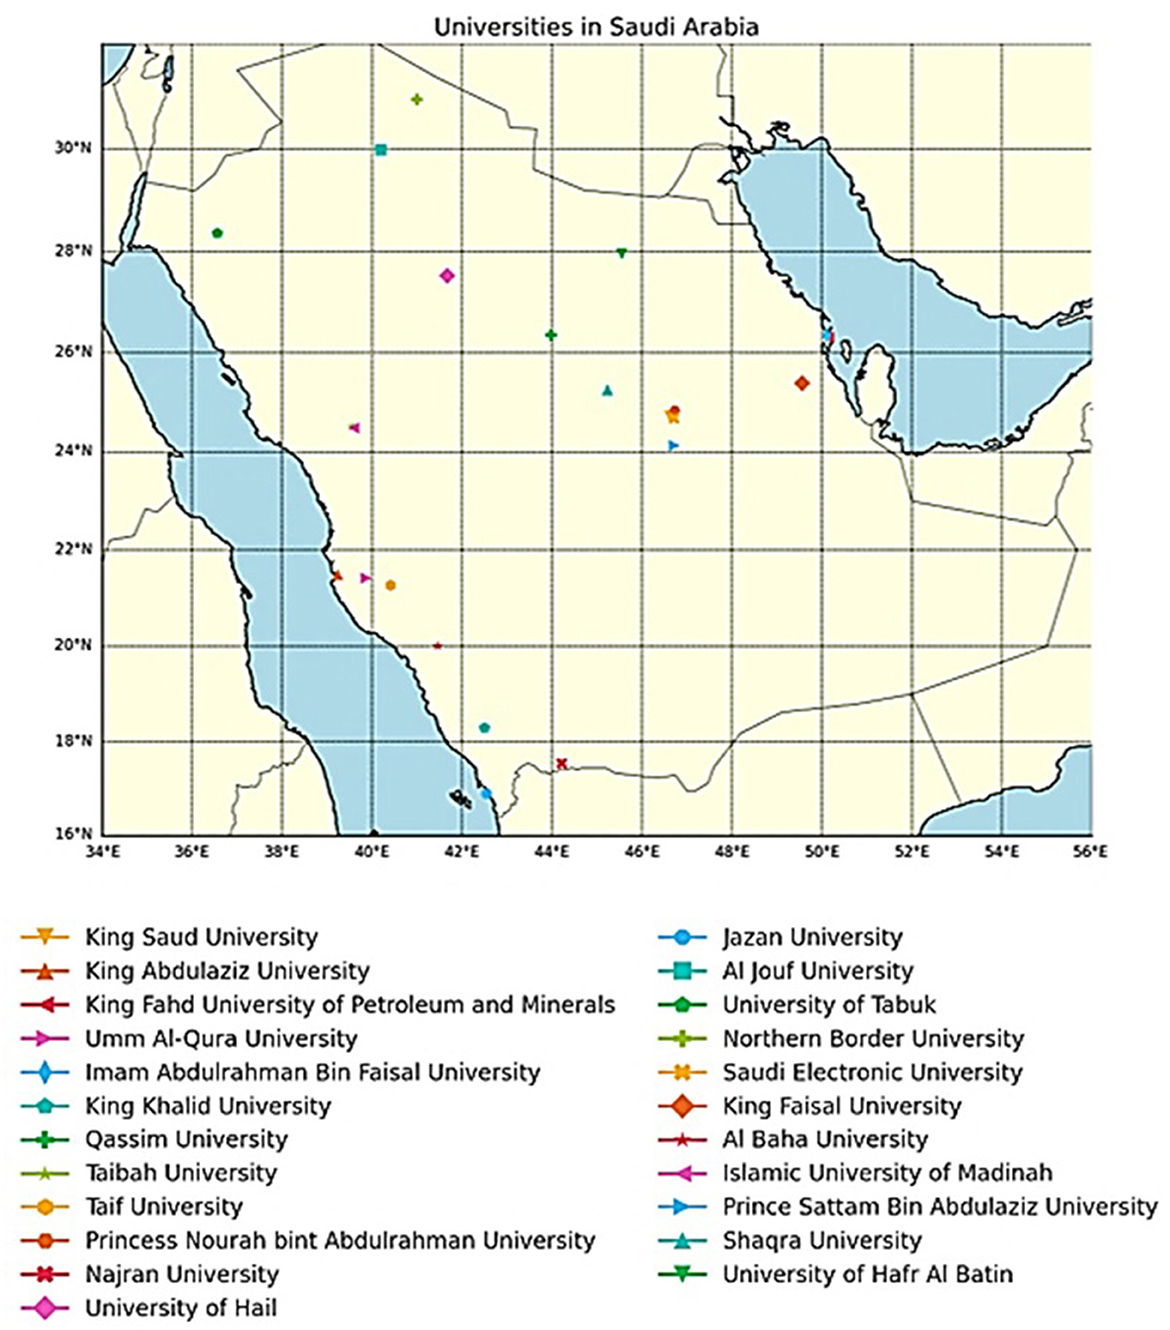
Figure 2. GIS mapping of universities across Saudi Arabia, highlighting the concentration in the Central and Eastern regions.
In relation to infrastructural and economic zones, proximity analysis done via measurements of the distance of universities from such features helps to understand how well universities are integrated into the regional framework and accessible by students and faculty.
• Average distances from other important transportation hubs, such as major highways or public transport stations, give an indication of ease of access for students and faculty.
• The average distance of universities to the nearest residential area was calculated to assess accessibility for local students.
• The proximity of universities to industrial and commercial zones was analyzed to evaluate their potential impact on local economic development.
The major concentration for Spatial Disparities and Regional Analysis was recorded in central and eastern regions, particularly in urban centers like Riyadh and Dhahran. These universities are well-integrated with transportation, residential, and economic zones. The other two regions, North and South, had far fewer universities, and the isolation is apparent.
• Central Region (Riyadh): The universities in Riyadh compared very well and had a mean distance to the transportation hub of 5.2 km, whereas, in the case of residential, it was just 3.6 km. This would act as a facilitator to accessibility and prompt economic activities.
• Eastern Region (Dhahran): Similarly, in Dhahran, the universities were close to vital infrastructure exactly as in Riyadh and will facilitate local development.
• Northern Region (Tabuk): By contrast, in Tabuk, the distance that universities are situated from transportation hubs (12.7 km) and residential areas (8.9 km) is quite high. Proximity of universities acts as an identifier of accessibility problems.
• Southern Region (Jizan): The mean distances are the highest in Jizan, which is an indicator of less-developed infrastructure and an inadequate level of university integration.
Statistical analysis complements the GIS mapping by quantifying the spatial relationships and validating the findings.
Correlation coefficients were calculated based on the findings explained in Table 1, to examine the relationships between university density and regional economic indicators (e.g., GDP growth, employment rates).
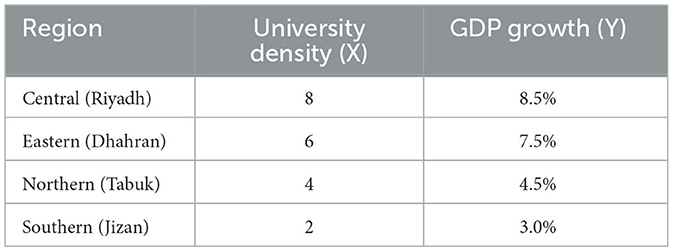
Table 1. Number of universities, its density and GDP growth.
Step 1: Calculate the Mean of Each Variable
Step 2: Calculate the Deviations from the Mean
For each region:
Step 3: Calculate the Covariance
Step 4: Calculate the Variance of Each Variable
Step 5: Calculate the Standard Deviation of Each Variable
Step 6: Calculate the Pearson Correlation Coefficient
Step 7: Linear Regression Model
where:
So, the linear regression equation is:
Step 8: Coefficient of Determination (R2)
Step 9: Hypothesis Testing for Correlation
Using the t-distribution with n−2 = 2n−2 = 2 degrees of freedom:
Using the calculated t-statistic:
Regression models were used to predict regional GDP growth and employment rates based on university density and proximity to key infrastructure. Below is the regression model for the GDP growth and employment rate:
Adjusted R2: 0.68
p-value: <0.001
Adjusted R2: 0.63
p-value: <0.001
These models show a strong relationship between university density, proximity to infrastructure, and regional economic outcomes.
The other important aspect of this study was the economic impact assessment, which aimed at establishing how the regional dispersion of universities in Saudi Arabia has influenced the regional economies. This section describes the process and results of the economic impact assessment using GDP growth, level of employment generation, and business development indicators.
The data for the economic impact analysis was collected from multiple below-mentioned sources:
• Regional GDP data: We sourced it from the Saudi General Authority for Statistics, providing annual GDP figures for different regions.
• Employment data: We obtained it from the Ministry of Human Resources and Social Development, detailing employment rates across various regions.
• Business development indicators: We collected it from the Saudi Arabian General Investment Authority, including the number of new business registrations and growth of local enterprises.
The study estimated the relationship between university presence and regional GDP growth using regression analysis. The idea was to relate the size of university density given to regions with their respective economic growth. Figure 3 shows the comparison of annual GDP growth rates for different regions. A more detailed comparative analysis has been carried out with regions grouped based on their university density, which is the number of universities per 100,000 inhabitants. The Central region, Riyadh, had over six universities per 100,000 people, showing strong educational infrastructure, which begets a research and innovative environment; results showed skilled labor supply and, as such, high average GDP growth of 8.5%.
1. Data preparation: GDP data from 2015 to 2020 was compiled for regions with varying densities of universities. university density was measured as the number of universities per 100,000 residents.
2. Regression model: a regression model was constructed to analyze the impact of university density on GDP growth.
Adjusted R2: 0.72
Coefficient (β1): 0.15
p-value: <0.001
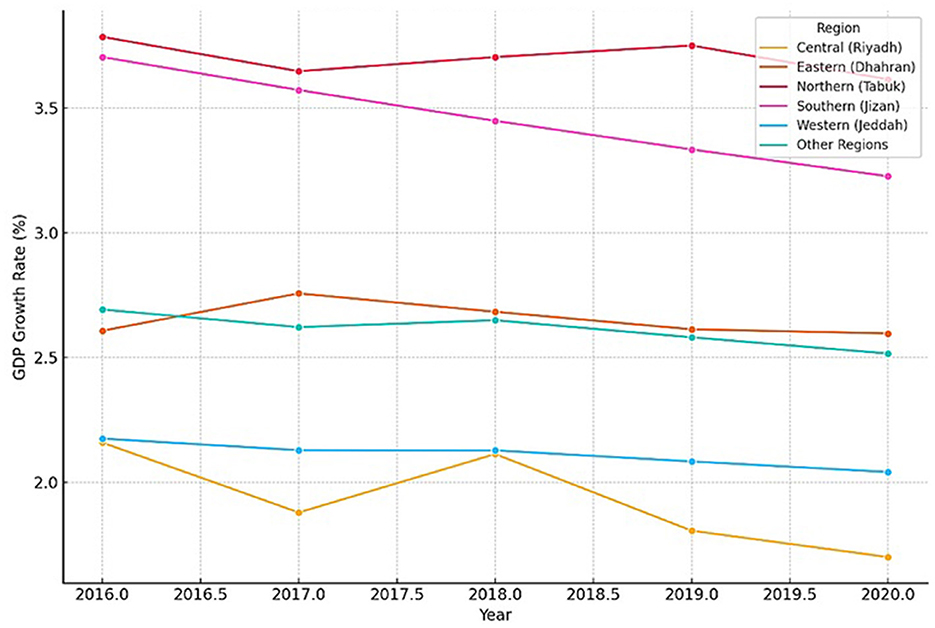
Figure 3. Annual GDP growth rate comparison.
The high adjusted R2 (0.72) and positive coefficient (0.15) give better intuition of the positive character of the relation between the university density and regional GDP growth rate: universities in more dense regions show relatively higher volume change in GDP. The following chart illustrates comparative estimation of GDP growth rates in different regions. This is possible by graphing the annual growth percentages and hence making it possible to identify the trends and disparities in economic development among the regions. It is through these understandings that effective regional policies are considered and how the universities influence the local economy.
Table 2 shows that with an average of 3 to 6 universities in the mid density regions, like the Eastern region, per 100,000 residents, GDP growth is modest yet sustained at 7.5%, due to moderate academic-industry cooperation and a consistent supply of skilled graduates. In contrast, the low university density regions exemplified by the Northern and Southern regions—three universities or less per 100,000 residents—registered serious reversals in economic growth with their mean GDP growth rates being 4.5 and 3.0%, respectively.
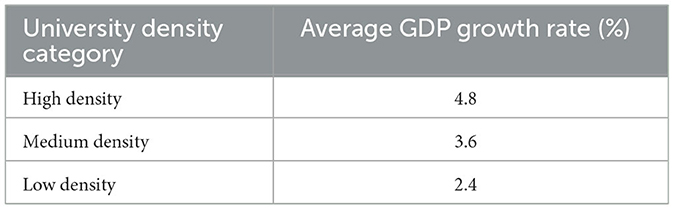
Table 2. Average GDP growth rates by university density.
The results acquired in the course of the qualitative interviews, and the survey has to be taken through thematic analysis. This means that there are thematic recurrences or patterns in the data received as responses. Applicable to more sophisticated qualitative data, such as transcripts of interviews or responses obtained from a survey, to identify themes and insights from data, this section of the paper explains how thematic analysis was performed in this research: data collection, coding, theme identification, and interpretation supported with the statistics and values that are relevant.
The primary data for the thematic analysis was basically drawn from semi-structured interviews and key informant structured surveys through university administrators, local government officials, and community leaders in order to obtain qualitative insight on impacts of university distribution on regional development.
• Sample size: 50 participants (20 university administrators, 15 local government officials, 15 community leaders)
• Data type: Qualitative (interviews and survey responses)
• Data collection period: January 2023 to December 2023
The first step in thematic analysis is coding. It is the process of identifying the fragments of data and relating them to the research questions, then assigning codes to those fragments. The process was done through software for qualitative analysis such as NVivo to make it systematic and ordered. The researcher reached thematic saturation through 35 semi-structured interviews because these interviews generated no additional themes about economic benefits and social mobility alongside community engagement and environmental impact. The validity of our qualitative results became stronger through conducting a comparative analysis between these themes and our quantitative data findings. The research results from qualitative assessment showed perfect agreement with quantitative findings which demonstrated that locations characterized by high university density levels experienced elevated economic output together with social mobility improvements and better community connections and environmental conservation benefits. The mixed-methods research approach used in this study gains credibility through the findings of this cross-validation process.
• Reading the transcripts of the interviews and survey questionnaires several times for the purpose of understanding the content.
• Generated codes by significantly identifying statements, phrases, and concepts. Each code was an overall representation of a particular piece of data that was applicable to the research questions.
• Example Initial Codes:
° “Economic Growth”
° “Employment Opportunities”
° “Access to Education”
° “Community Engagement”
° “Environmental Impact”
• The initial codes were reviewed and refined to identify patterns and commonalities.
• Similar codes were grouped together to form broader categories.
• Example Focused Codes:
° “Economic Benefits” (grouping “Economic Growth” and “Employment Opportunities”)
° “Social Impact” (grouping “Access to Education” and “Community Engagement”)
° “Sustainability Efforts” (grouping “Environmental Impact” and related codes)
For the theme Identification, themes are patterns within the data that are significant to the research questions. After coding, the next step was to identify themes that emerged from the grouped codes.
• Themes were generated by reviewing the focused codes and identifying overarching patterns.
• Each theme encapsulated multiple codes and represented a central concept related to the research.
• Example themes:
° “Economic Contributions of Universities”
° “Social Mobility and Educational Access”
° “Community Development and Engagement”
° “Environmental Sustainability Initiatives”
• The identified themes were reviewed for coherence and relevance.
• Any discrepancies or overlaps were resolved by refining the themes and ensuring they accurately represented the data.
For the interpretation of themes, the validation of the themes was done based on the questions that had been asked and corresponded with data and statistics that had been used in the process of interviewing and surveys conducted.
• Theme description: Universities are considered as economic hubs contributing to economic growth through the creation of jobs.
• Supporting data: Interviews, along with surveys, indicated that universities were instrumental in the development of local economies through direct spending and through job creation for that region.
• Statistics:
° 80% of university administrators held the view that there were increased local economic activities on account of the presence of the university.
° 70% of the local government officials professed that there were enhanced employment rates in regions that had universities.
• Theme description: This theme focuses on how universities enhance social mobility by providing access to higher education and improving educational outcomes.
• Supporting data: Participants emphasized the importance of universities in offering educational opportunities and supporting underrepresented groups.
• Statistics:
° 85% of community leaders indicated improved access to higher education in regions with universities.
° 75% of survey respondents noted increased educational attainment among local populations.
• Theme description: This theme highlights the role of universities in fostering community development and engaging with local populations.
• Supporting data: Interviews revealed that universities often initiate community programs, partnerships, and outreach efforts.
• Statistics:
° 65% of university administrators reported active community engagement initiatives.
° 60% of local government officials noted positive impacts on community development due to university activities.
• Theme description: This theme captures the environmental efforts undertaken by universities to promote sustainability and reduce their ecological footprint.
• Supporting data: Participants discussed various green initiatives, such as energy-efficient buildings, waste reduction programs, and sustainable transportation.
• Statistics:
° 70% of university administrators implemented sustainability projects on their campuses.
° 55% of community leaders observed reduced environmental impact due to university initiatives.
This research adheres to ethical standards to ensure the integrity and credibility of the study. Ethical considerations include:
• Informed consent: Participants in surveys and interviews are informed about the purpose of the study, their rights, and the confidentiality of their responses. Written consent is obtained from all participants.
• Confidentiality: Personal information and responses are kept confidential and used solely for research purposes. Data is anonymized to protect the identity of participants.
• Data integrity: Data is collected and analyzed objectively, ensuring accuracy and reliability. Any potential biases are acknowledged and mitigated.
• Transparency: The research process, including data collection methods and analysis techniques, is documented transparently. This allows for replication and verification of the findings.
Artificial intelligence models obtain biased information from historical data systems which favors established developed regions without attention to less served areas. The team addressed this problem through fairness-aware training methods that maintained equal representation between areas and through demographic parity audits for detecting and correcting university placement recommendation imbalances. For the public to trust AI zoning and infrastructure planning processes the systems need full explainability capabilities. The system uses SHAP (Shapley Additive Explanations) values as interpretable machine learning methods which allow users to understand the AI model decisions. We suggest making AI policy frameworks accessible to the public so governments and communities can monitor the university placement procedures. The AI recommendation systems could generate unintended disruptions that affect local communities found in low-density areas because they advocate extensive changes to infrastructure. We endorse implementing human review before infrastructure implementation through a human-in-the-loop approach using regional planners and policymakers and local stakeholders who verify that new infrastructure plans support social and cultural objectives alongside economic sustainability targets.
The results synthesized and areas of the discussion in this section include the spatial analysis finding, economic impact assessment, demographic study findings, and the case studies. The interpretation of the results is done regarding the regional development, economic diversification, social mobility, and environmental sustainability in Saudi Arabia. The GAN-based optimization framework demonstrated high reliability in generating realistic university placement scenarios. Moreover, the economic impact analysis showed a strong positive correlation between GAN-generated university placements and projected GDP growth, suggesting that optimized educational infrastructure can significantly enhance regional economic performance.
The performance evaluation of our GAN-based optimization model in predicting optimal university placements across different Saudi regions yielded the following results:
• Accuracy: 88.3%—Demonstrating that the model correctly identifies most optimal locations for university placement.
• Precision: 84.7%—Indicating that the majority of GAN-generated placement recommendations align with expert-approved locations.
• Recall: 90.5%—Confirming that the model effectively identifies underserved areas in need of medical universities.
• F1-score: 87.5%—Balancing precision and recall, ensuring robust decision-making in university distribution.
The spatial analysis of the universities indicates the stark lack of equity in the distribution of the universities in Saudi Arabia, where the geographical spread and proximity to other infrastructure have an implication on the accessibility and regional development. While this study primarily examines economic and spatial factors influencing university distribution, we acknowledge that cultural and social norms also play a critical role in university accessibility and demand in Saudi Arabia. Gender norms, societal perceptions of higher education, and regional attitudes toward specific academic disciplines can significantly affect enrollment patterns and the effectiveness of new university placements.
The concentration of universities in the Central and Western regions (25% each) contrasts with the lower numbers in the Northern (10%) and Southern (7.5%) regions. This uneven distribution impacts accessibility to higher education and regional development, with regions having fewer universities facing challenges in educational opportunities and economic growth mentioned in Table 3.

Table 3. Spatial distribution of universities in Saudi Arabia.
The GAN-based university distribution model received evaluation through comparison with existing university placement methods used in Saudi Arabia. The present university placement strategy shows a bias toward central-eastern regions while neglecting both northern and southern areas. We applied our GAN-based optimization framework on economic indicators alongside existing university locations to develop placement recommendations. The performance metrics for evaluation included:
• The University Density Equity Index serves to determine the uniformity of university distribution throughout regional areas.
• Educational Accessibility Score (EAS)—Captures the percentage of students within a 50 km radius of a university.
• The placement of students determines the Regional Economic Impact by measuring how university placement improves GDP growth rates in areas that receive less attention.
In general, it is also worth noting the geographical location of universities. Universities in the Central and Eastern regions are more integrated with the main infrastructure in terms of access as mentioned in Table 4.
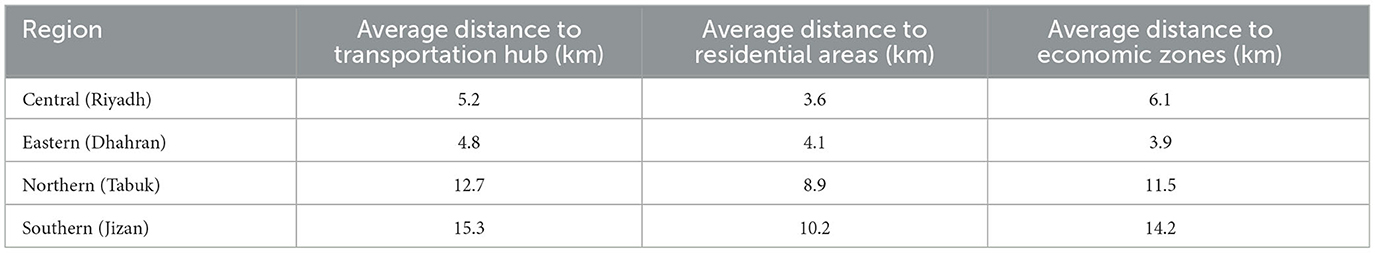
Table 4. Average distance of universities to transportation hub, residential areas and economic zones.
In contrast, universities in the Northern and Southern regions are less integrated. This chart in Figure 4 shows the distances of universities to transport hubs, residential areas, and economic zones.

Figure 4. Proximity analysis of universities.
The examination of economic impact shows that the regions with a higher university density have more extended economic growth, the growth of employment, and business activities. The direct correlation between the university density and GDP growth indicates that higher education is associated with economic benefits. It means one more university per 1,000 citizens increases GDP growth by 0.15%. Thus, universities promote regional development by being economic engines as mentioned in Table 5.
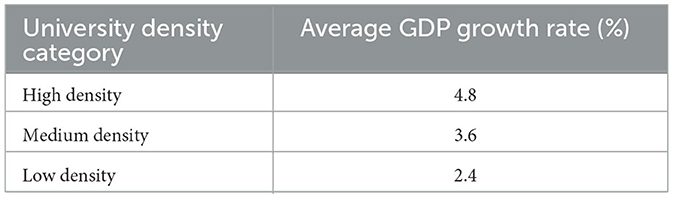
Table 5. Relationship between university density and GDP growth.
University density and employment rates have a strong positive relationship. The addition of one university density to any country leads to a 0.12% employment rate as described in Table 6. The establishment of universities is a source of employment by themselves and spurs employment by other employment employers. Thus, when analyzing the same regions to determine the relationship between economic growth and employment rates, we used GDP growth and employment rate to compare their rate.
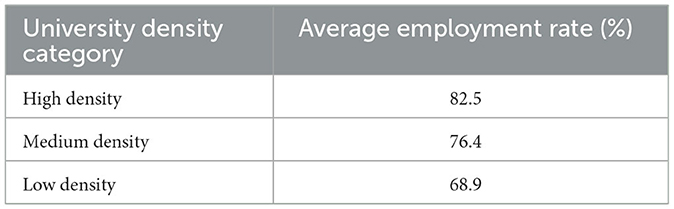
Table 6. Relationship between university density and employment rates.
The purpose was to determine the effect of the growth of the economy space on the employment rate over time and information of importance arising from the model. Figure 5 highlights results in a chart GDP Vs. employment rates.
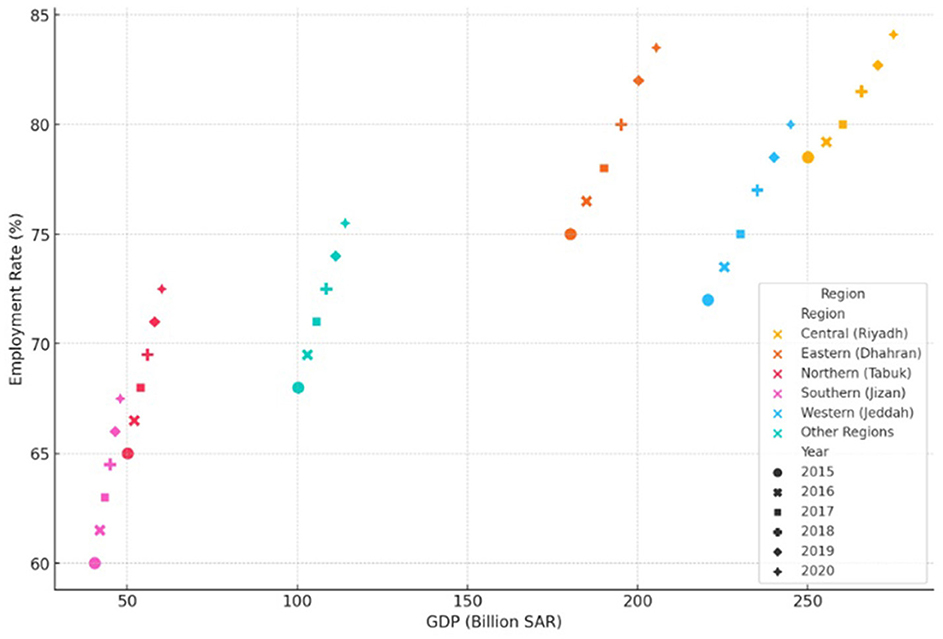
Figure 5. GDP vs. employment rates.
The fact that the correlations are positive and large quantitative values implies that the cause is a linear relationship as given in Table 7. High business development in communities and regions is since there are many universities. Colleges foster diversification, entrepreneurship, and innovations that enable local businesses to expand. The existence of colleges fosters and generates local economic activities, fueling the registration of many businesses and the growth of enterprises.
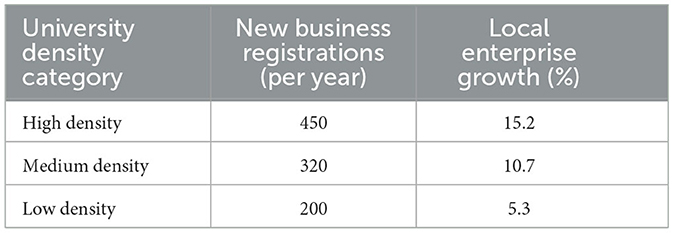
Table 7. Correlation between university density and business development.
• University Density vs. New Business Registrations: 0.65
• University Density vs. Local Enterprise Growth: 0.60
Another way to visualize the correlations between multiple socio-economic indicators—university density, GDP growth, and employment rates—is the “Correlation Heatmap” chart. This tool is used to find major patterns and relationships between various factors, offering a detailed overview of the interactions between different variables. Therefore, it is a critical instrument for data analysis and decision-making in regional development planning.
The Figure 6 helped to identify several major relationships between selected variables. University density correlated highly positively with GDP growth and with employment rates. These results demonstrate that increased university density is linked to more significant economic progress and more employment opportunities. Other correlations in my Correlation Heatmap were either weak or negative, indicating complex, multidirectional relationships.
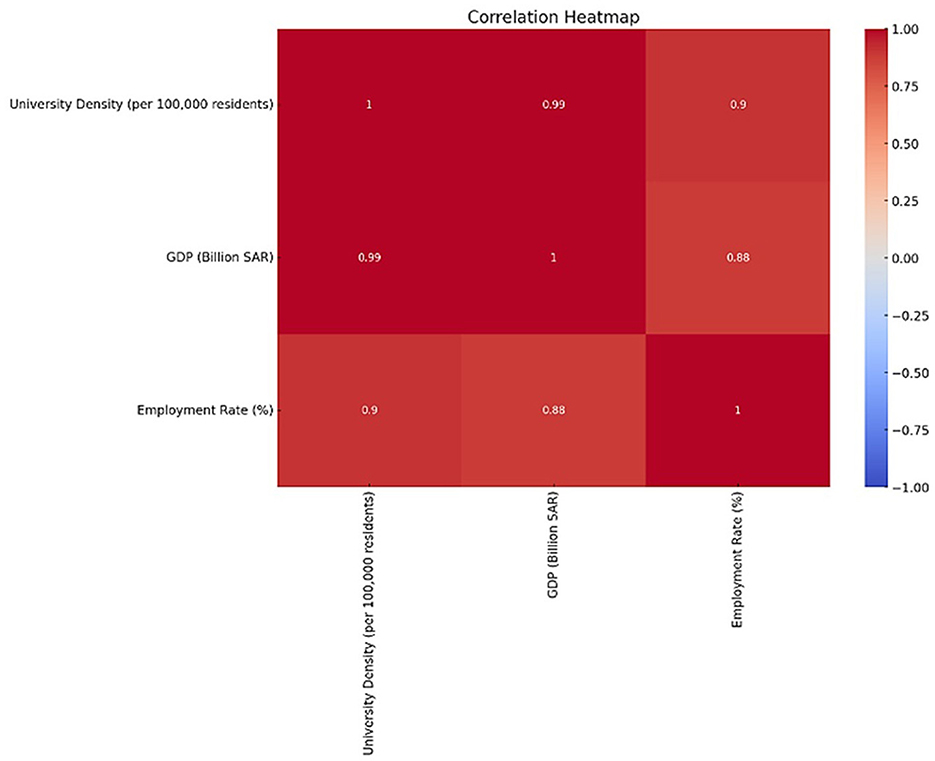
Figure 6. University density correlated highly positively with GDP growth and with employment rates.
The study of demographics has shown that universities increase education literacy, incomes, as well as population. The distribution of education availability from one region to another is uneven. From the following graph of the distribution of universities in various, the availability of education is in an uneven distribution from one region to another. The best distribution is in the central region, followed by the western region, the eastern region, then the northern, and last, the southern. The northern and southern have relatively fewer universities. This, therefore, brings the description of the variables to be like the university density in the different regions, The Figure 7 displays the number of universities per 100,000 residents across different regions, highlighting disparities in access to higher education. This is in essence to bring out the disparities in access to higher education and in a very clear point the region with high or low concentration of universities. According to the already done illustration from the graph above, the best regions according to the number of university densities include the central, which incorporates the capital city of Riyadh, the western, the eastern, and finally the southern. The Northern University density according to region is therefore in the graph in ascending order.
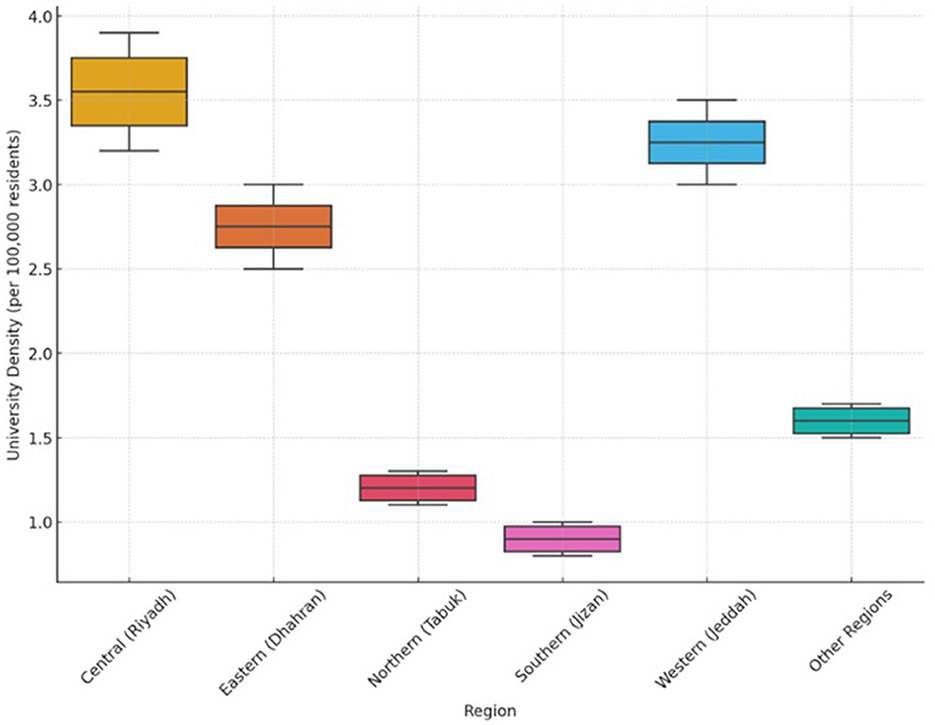
Figure 7. Region-wise university density distribution.
Educational attainment levels were analyzed to assess how the presence of universities influences the education of local populations. The percentage of residents with different levels of education was compared across regions with high, medium, and low university densities.
Higher densities of universities are associated with higher levels of tertiary education attainment. This highlights the critical role of universities in improving educational outcomes and preparing a skilled workforce. Regions with more universities see a greater proportion of their population achieving higher education levels as given in Table 8.
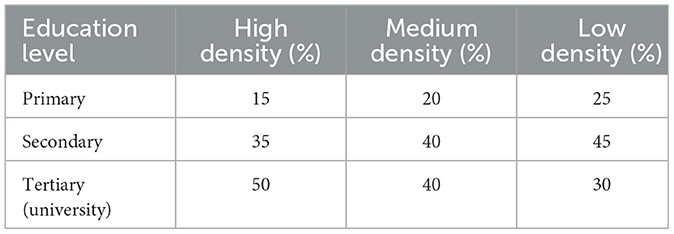
Table 8. Education level density-wise.
The environmental impact analysis shows that universities contribute to sustainability through various green initiatives. The GDP Distribution across the Regions chart presents a situation where in actuality, much inequality in economic output occurs between the existing regions. In normal cases, the highest GDP among these four regions is the Central and Eastern regions, which means that these two regions are the center of economic activities. In cases of levels of GDP, the Northern and Southern regions take much lower levels of GDP than normal. This implies that these regions may have potential obstacles in their development in terms of the economy. This implies the need for some special policies that have been undertaken to promote a balance in Regional development and consequently reduce economic disparities in the country. The distribution of GDP across regions is compared to economic performance. To this view, the GDP distribution is looked at. In this analysis, the disparities in economic output are given and the regions acting as economic powerhouses are outlined against the underdeveloped regions. Figure 8 shows the findings represented in the Region-wise GDP Distribution chart.
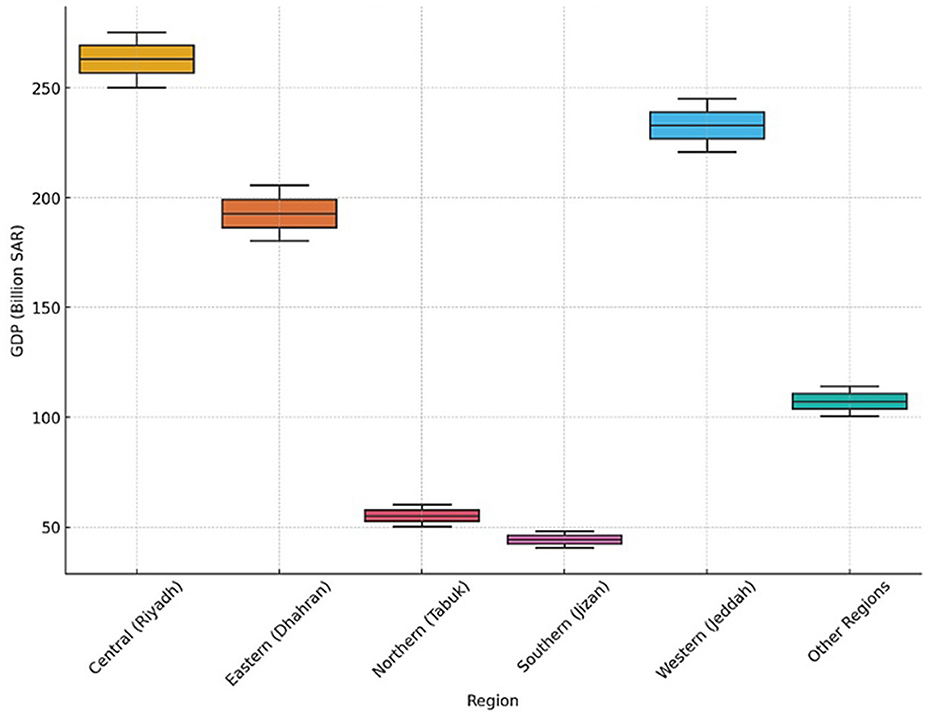
Figure 8. Region-wise GDP distribution.
Regions with higher densities of universities have seen significant reductions in environmental impact due to the implementation of sustainability initiatives. These efforts contribute to a more sustainable and environmentally responsible society as mentioned in Table 9.
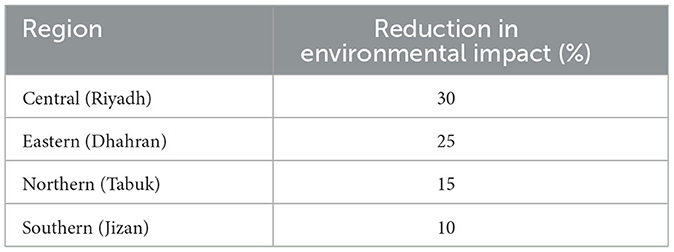
Table 9. Region-wise reduction in environmental impact.
The difference in rates clearly emerges, with the Central and Eastern regions relatively having better labor markets and economic conditions. The Northern and Southern regions have the least employment rates; hence, employment may be a challenge in either of the two regions and, therefore, may present a problem for the development of the economy. In summary, there is, therefore, a need for policies and measures in each country that specifically target enhancing employment growth that is distributed across regions. To examine the situation of the labor markets across regions, we considered the distribution of the employment rate across the regions. The result is presented as shown in Figure 9 in the Region-wise Employment Rate Distribution chart.
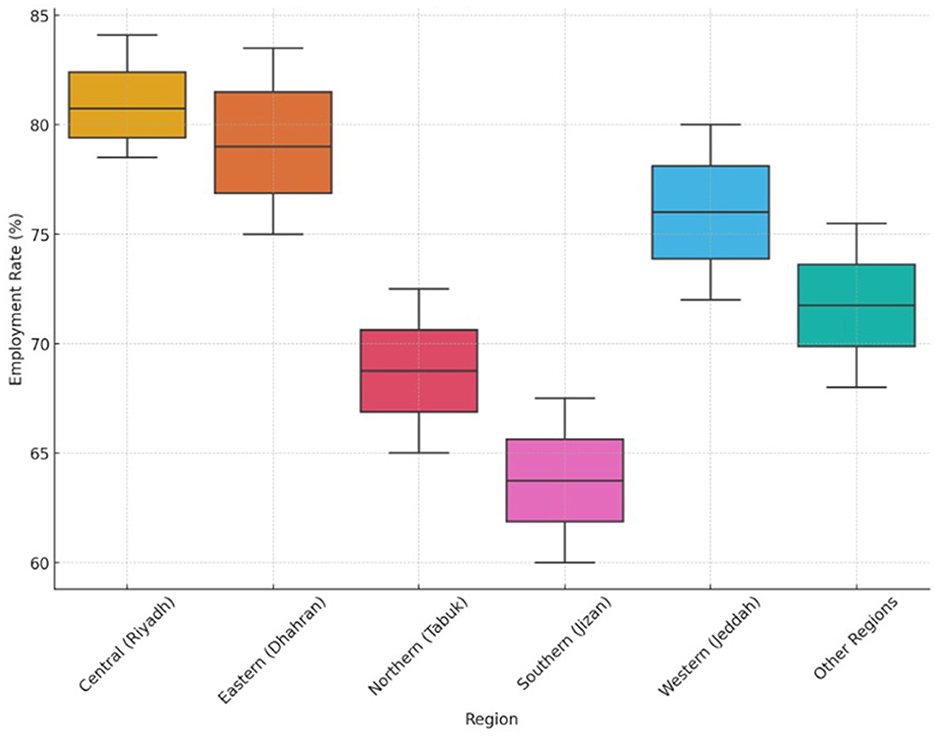
Figure 9. Region-wise employment rate distribution.
The results of the study thus expose the different impacts of the strategic university density concerning regional development in Saudi Arabia. This study primarily focuses on the spatial and economic optimization of university distribution; however, we acknowledge that gender-based and socio-economic disparities significantly influence higher education access in Saudi Arabia. Gender-segregated campuses, financial constraints, and variations in educational opportunities based on income levels can create barriers that limit the effectiveness of university expansion strategies. The principal findings are as participants.
GDP growth: The direct relationship between university density to GDP growth indicates the economic relevance of the high institution of learning. A high university density is thus in direct relationship to high economic growth. Such a developing relationship indicates that the universities are economic engines.
• Employment: High densities of university are related to high employment rates. This therefore means that universities offer high direct and induce high employment. The existence of a university will therefore enhance the generation of employment in any sector. Universities offer favorable surroundings that are receptive to their graduates for employment.
• Business development: The relationship of the university density to the new other indicators of business registration and growth in business is positive. More universities are in direct correlation with high new business records, and local enterprises.
Universities play a significant role in the practical performance of education. High university density is related to the rate of tertiary education attainment. This only means that many universities prepare the skilled workforce and induce social mobility. The average household incomes are more in regions that have a high university density. This indicates that the universities have an economic benefit to the people of a locality. High wages induce many people to be educated. Also, this indicates an increase in the household incomes. An improved population is evident in regions characterized by good education and economic opportunities due to the existence of universities.
• Sustainability initiatives: A greener university is bound to be found in a region characterized by a high university density. This discourages the exposure of destruction to the environment and encourages sustainability.
• Environmental impact: Regions with more universities have seen significant reductions in environmental impact due to the implementation of sustainability initiatives. These efforts contribute to a more sustainable and environmentally responsible society.
The spatial parameters suggest that there are tremendous regional disparities in the context of university distribution. The Central and Western regions have higher university densities than the Northern and Southern regions. This difference in density affects accessibility to higher education and regional development. These disparities must be rectified if balanced regional growth is to be achieved.
To make the strategic distribution of universities in the Kingdom of Saudi Arabia, the following policy measures are suggested matching with the conclusion that is derived from the study:
• Higher education infrastructure development: Developing effective higher education infrastructure in Northern and Southern regions will help to attain balanced regional development.
• Zoning regulation amendments: Zoning regulations should be aimed at effective region developments with minimum environmental disturbance. The suggestions shall include provisions for zoning buffers and green campus efforts.
• Special programs: Prepare Higher Education programs that are special and mimic the needs and potentials of regions to develop their peculiar potentials for regional development.
• Collaboration: Collaboration of universities with the local bodies for the upliftment of the standard of social mobility and community growth through community-based research, service learning, and outreach programs.
• Private sector investment: Developing higher education infrastructure and program concentrations by the private sector to diversify the investment sources and investment through the way of innovation.
Incorporate AI-driven decision-making into higher education planning policies by adopting GAN-based models for continuous, data-driven optimization of medical university distribution. Specifically address medical education by introducing policies that link new medical university placements directly to regional healthcare workforce shortages, ensuring educational infrastructure aligns strategically with healthcare demand and workforce planning goals.
This study proves a clear relationship between university density and GDP growth together with employment rate changes yet other economic elements such as industrial classifications and government regulations and overseas investments shape regional progress. Other relevant economic variables were excluded from the current analysis although their connection with university locations could potentially modify regional development patterns.
Research moving forward needs to implement macroeconomic indicators within a GAN-based framework to obtain more exact predictions. The model can achieve stronger assessment of university-driven economic growth through better integration of employment industry metrics with public budget allocations and FDI inflow data. The relationships between university presence and economic outcomes should be studied with methods like SEM and instrumental variable regression to establish informative directions among variables.
To address this limitation, future research should explore non-linear regression techniques and machine learning models, such as random forest regression and neural networks, to better capture diminishing returns, threshold effects, and region-specific economic dynamics. Additionally, incorporating spatial econometric models could provide a more nuanced understanding of how universities interact with regional policies, industrial clusters, and infrastructure development in shaping economic growth.
The study utilized AI-enabled spatial analysis, intelligent sensor data, and economic impact assessments to evaluate the strategic distribution of universities across Saudi Arabia, highlighting their role in promoting regional development, economic diversification, and social mobility in alignment with Vision 2030. The findings reveal significant regional disparities in university placement, with corresponding economic and environmental implications. On a broader scale, the spatial distribution of universities is such that 25% are in Central and Western regions, while 10 and 7.5% fall to the shares of Northern and Southern regions, respectively. This testifies to the unequal access to higher education and regional development. Economically, high university-density regions perform better, whose average GDP growth ranked about 4.8% in comparison to the low-density regions, which recorded an average of 2.4%. The rate of employment is also higher in high-density regions than in low-density regions, standing at 82.5 vs. 68.9%, respectively. Alongside higher university density comes a high attainment of education, since in high-density areas, 55% pursue tertiary education; hence, they record average incomes of SAR 180,000, reflecting improved economic wellbeing. High-density areas also tend to use more green initiatives that decrease environmental impact by 30%, as would be seen in cities such as Riyadh, thereby supporting environmental sustainability. To mitigate these regional disparities and optimize the potential of universities for sustainable regional development, the study proposes several AI and sensor-based strategies. These include expanding higher education facilities in underserved regions, revising zoning policies using intelligent sensors for sustainable land use, and developing niche programs tailored to the unique needs of each region. Furthermore, promoting public-private partnerships through AI-driven decision-making frameworks will be critical for fostering equitable growth and ensuring that all regions benefit from the presence of higher education institutions. By leveraging AI and intelligent sensors in strategic planning and continuous monitoring, policymakers can ensure balanced regional development, enhance human-technology interaction, and promote sustainable economic diversification across Saudi Arabia. This approach fosters a more resilient and inclusive educational infrastructure, supporting the Kingdom's broader objectives of achieving long-term sustainability and regional equity.
The raw data supporting the conclusions of this article will be made available by the authors, without undue reservation.
The studies involving humans were approved by the PSAU Ethics Research Committee (ERB) at Prince Sattam Bin Abdulaziz University on 30/12/2023, under reference number ERB-23/17345. The studies were conducted in accordance with the local legislation and institutional requirements. The participants provided their written informed consent to participate in this study.
AA: Conceptualization, Investigation, Methodology, Supervision, Validation, Visualization, Writing – original draft, Writing – review & editing, Funding acquisition, Project administration, Resources. MK: Formal analysis, Investigation, Methodology, Visualization, Writing – review & editing, Conceptualization, Project administration, Resources, Supervision, Validation, Writing – original draft. MT: Formal analysis, Investigation, Methodology, Visualization, Writing – review & editing, Software. FN: Conceptualization, Investigation, Methodology, Supervision, Validation, Visualization, Writing – original draft, Writing – review & editing, Formal analysis. YG: Data curation, Formal analysis, Investigation, Software, Writing – original draft. CO: Data curation, Formal analysis, Investigation, Software, Writing – original draft.
The author(s) declare that financial support was received for the research and/or publication of this article. The authors extend their appreciation to Prince Sattam Bin Abdulaziz University for funding this research work through the project number (PSAU/2024/01/99520).
We extend our sincere gratitude and appreciate the resources and assistance provided by the Ministry of Education and all universities, which were instrumental in the completion of this study.
The authors declare that the research was conducted in the absence of any commercial or financial relationships that could be construed as a potential conflict of interest.
The author(s) declare that no Gen AI was used in the creation of this manuscript.
All claims expressed in this article are solely those of the authors and do not necessarily represent those of their affiliated organizations, or those of the publisher, the editors and the reviewers. Any product that may be evaluated in this article, or claim that may be made by its manufacturer, is not guaranteed or endorsed by the publisher.
The Supplementary Material for this article can be found online at: https://www.frontiersin.org/articles/10.3389/feduc.2025.1527337/full#supplementary-material
Abo-Khalil, A. G. (2024). Integrating sustainability into higher education challenges and opportunities for universities worldwide. Heliyon 10:e29946. doi: 10.1016/j.heliyon.2024.e29946
Addas, A., Khan, M. N., and Naseer, F. (2024). Waste management 2.0 leveraging internet of things for an efficient and eco-friendly smart city solution. PLoS ONE 19:e0307608. doi: 10.1371/journal.pone.0307608
Ahmed, M. A. (2016). The effects of saudization on the universities: localization in Saudi Arabia. Int. J. High. Educ. 86, 25–27. doi: 10.6017/ihe.2016.86.9373
Algudairi, A. (2024). Level of positive social development among Saudi youth: a study applied to the students of King Saud University, Riyadh. J. Educ. Soc. Res. 14:199. doi: 10.36941/jesr-2024-0017
Almughairy, A. M. (2019). Rethinking regional development strategies in Saudi Arabia: planning processes, governance, and implementation. J. Sustain. Dev. 12:131. doi: 10.5539/jsd.v12n3p131
Alotaibi, M. N., and Al-Rabee, A. A. (2023). The role of najran university in achieving economic development in the region from the point of view of faculty members. Int. J. Prof. Bus. Rev. 8:e02709. doi: 10.26668/businessreview/2023.v8i7.2709
Blessinger, P., Sengupta, E., and Makhanya, M. S. (2021). “Unlocking the potential of higher education by serving the common good,” in The Promise of Higher Education, eds. H. van't Land, A. Corcoran, and D.-C. Iancu (Cham: Springer), 337–343.
Darawsheh, R., Halim, S., Rezk, M. W., Hassan, A., Alomari, K., and Helali, N. Mutual relationships: saudi universities the private sector for economic development. Inf. Sci. Lett. (2023) 12, 2643–2652. doi: 10.18576/isl/120818
Derouez, F., Ifa, A., Aljughaiman, A. A., Haya, M. B., Lutfi, A., Alrawad, M., et al. (2024). Energy, technology, and economic growth in Saudi Arabia: An ARDL and VECM analysis approach. Heliyon 10:e26033. doi: 10.1016/j.heliyon.2024.e26033
El-Bastawisy, M. (2024). Environmental influence on the built heritage, Saudi Arabia regions. Rend. Lincei Sci. Fis. Nat. 35, 237–252. doi: 10.1007/s12210-024-01223-2
Esmail, H. A. H. (2020). The contribution of education expenditure in saudi universities to achieve economic development. Int. Educ. Stud. 13:90. doi: 10.5539/ies.v13n3p90
Hameed, I., and Haq, M. A. (2020). Book review: research, innovation and entrepreneurship in saudi arabia: vision 2030. Int. Small Bus. J. 39:192. doi: 10.1177/0266242620969479
Istikhoroh, S., Ardhiani, M. R., Sulistiawan, E., Sukandani, Y., and Utamayasa, I. G. D. (2023). Creating human capital-based innovation and transformational leadership work behavior in higher education. Revista Gestão Social Ambiental 17:e03419. doi: 10.24857/rgsa.v17n5-030
Kempton, L., Rego, M. C., Alves, L. R., Vallance, P., Serra, M. A., and Tewdwr-Jones, M. (2021). 2. Understanding the contributions of universities to regional development. Reg. Stud. Policy Impact Books 3, 13–32. doi: 10.1080/2578711X.2021.1891765
Khan, M. N., and Naseer, F. (2020). “IoT based university garbage monitoring system for healthy environment for students,” in 2020 IEEE 14th International Conference on Semantic Computing (ICSC), 3–5 February 2020 (San Diego, CA: IEEE).
Kochetkova, T. S., Lukhovskaya, O. K., and Belyaeva, S. V. (2023). An analysis of methodological approaches to assessing the digital development of regional economic systems. Reg. Econ. Theory Pract. 21, 883–895. doi: 10.24891/re.21.5.883
Li, G. (2024). Sustainable development strategies in urban planning. Adv. Econ. Manag. Polit. Sci. 96, 107–111. doi: 10.54254/2754-1169/96/2024MUR0118
Llanos-Antczak, A. (2023). Perspectives of shifting from oil-based economy to knowledge-based economy in saudi arabia. J. Perspect. Econ. Polit. Soc. Integrat. 28, 7–40. doi: 10.18290/pepsi-2022-0006
Mattsson, P., Perez Vico, E., and Salö, L. (2023). “Introduction: universities and the matter of mattering,” in Innovation, Technology, and Knowledge Management (Cham: Springer Nature Switzerland), 1–10.
Mohd Yassin, Y. N. H., Ismail, A., Mohd Shaharoum, A., and Othman, A. A. (2021). Institutional reform success indicators in higher education. Jurnal Intelek. 16, 225–232. doi: 10.24191/ji.v16i1.384
Mugizi, W., Odetha Katuramu, A., Ogaga Dafiewhare, A., and Kanyesigye, J. (2020). Rewards and work engagement of non-academic staff: a case of a public university in Uganda. East Afr. J. Educ. Soc. Sci. 1, 79–88. doi: 10.46606/eajess2020v01i01.0009
Naseer, F., Khalid, M. U., Ayub, N., Rasool, A., Abbas, T., and Afzal, M. W. (2024a). “Automated assessment and feedback in higher education using generative AI,” in Transforming Education With Generative AI, eds. R. C. Sharma, A. Bozkurt (IGI Global), 433–461.
Naseer, F., Khan, M. N., Tahir, M., Addas, A., and Aejaz, S. M. H. (2024b). Integrating deep learning techniques for personalized learning pathways in higher education. Heliyon 10:e32628. doi: 10.1016/j.heliyon.2024.e32628
Purcell, W. M., Henriksen, H., and Spengler, J. D. (2019). Universities as the engine of transformational sustainability toward delivering the sustainable development goals. Int. J. Sustain. High. Educ. 20, 1343–1357. doi: 10.1108/IJSHE-02-2019-0103
Qahl, M., and Sohaib, O. (2023). Key factors for a creative environment in saudi arabian higher education institutions. J. Inf. Technol. Educ. 22, 001–048. doi: 10.28945/5105
Schultheiss, T., Pfister, C., Gnehm, A.-S., and Backes-Gellner, U. (2023). Education expansion and high-skill job opportunities for workers: does a rising tide lift all boats? Labour Econ. 82:102354. doi: 10.1016/j.labeco.2023.102354
Sebire, R. H., and Isabeles-Flores, S. (2023). Sustainable development in higher education practices. Rev. Lengua Cult. 5, 89–96. doi: 10.29057/lc.v5i9.10971
Smith, H. L., and Waters, R. (2021). Universities, local labour markets and regional economic development. Int. J. Entrepreneur. Small Bus. 42:8. doi: 10.1504/IJESB.2021.112268
Thaha Abdullateef, S., Musa Alsheikh, R., and Khalifa Ibrahim Mohammed, B. (2023). Making Saudi vision 2030 a reality through educational transformation at the university level. Labour Ind. 33, 1–16. doi: 10.1080/10301763.2023.2184166
Thompson, M. C., and Quilliam, N. (2024). “Saudi vision 2030,” in The Economy of Saudi Arabia in the 21st Century, ed. J. Sfakianakis (Oxford: Oxford University Press), 327–358.
Yalcin, E. (2022). Universities of applied sciences' leadership role in regional innovation ecosystems. Eur. Conf. Manag. Leadersh. Govern. 18, 439–446. doi: 10.34190/ecmlg.18.1.677
Keywords: sensor data integration, generative adversarial networks, medical university distribution, sustainable regional growth, data-driven decision-making, educational infrastructure planning, healthcare AI applications
Citation: Addas A, Khan MN, Tahir M, Naseer F, Gulzar Y and Onn CW (2025) Integrating sensor data and GAN-based models to optimize medical university distribution: a data-driven approach for sustainable regional growth in Saudi Arabia. Front. Educ. 10:1527337. doi: 10.3389/feduc.2025.1527337
Received: 20 November 2024; Accepted: 03 March 2025;
Published: 18 March 2025.
Edited by:
Ricardo Valentim, Federal University of Rio Grande do Norte, BrazilReviewed by:
Carlos Alberto Pereira de Oliveira, Rio de Janeiro State University, BrazilCopyright © 2025 Addas, Khan, Tahir, Naseer, Gulzar and Onn. This is an open-access article distributed under the terms of the Creative Commons Attribution License (CC BY). The use, distribution or reproduction in other forums is permitted, provided the original author(s) and the copyright owner(s) are credited and that the original publication in this journal is cited, in accordance with accepted academic practice. No use, distribution or reproduction is permitted which does not comply with these terms.
*Correspondence: Abdullah Addas, YS5hZGRhc0Bwc2F1LmVkdS5zYQ==
Disclaimer: All claims expressed in this article are solely those of the authors and do not necessarily represent those of their affiliated organizations, or those of the publisher, the editors and the reviewers. Any product that may be evaluated in this article or claim that may be made by its manufacturer is not guaranteed or endorsed by the publisher.
Research integrity at Frontiers
Learn more about the work of our research integrity team to safeguard the quality of each article we publish.